Monitor Azure Synapse Link for Azure SQL Database through Synapse Studio and Azure Monitor
This article provides a guide on how to get started with monitoring your Azure Synapse Link for Azure SQL Database connections. Before you go through this article, you should know how to create and start an Azure Synapse Link for Azure SQL Database link connection from Get started with Azure Synapse Link for Azure SQL Database. Once you've created and started your Synapse Link connection, you can monitor your link connection through Synapse Studio or Azure Monitor.
Monitor the status of an Azure Synapse Link for Azure SQL Database connection in Synapse Studio
You can monitor the status of your Azure Synapse Link connection, see which tables are being initially copied over (snapshotting), and see which tables are in continuous replication mode (replicating) directly in Synapse Studio. In this section, we'll deep dive link-level monitoring and table-level monitoring:
Link-level monitoring
Once your link connection is running in your Azure Synapse workspace, navigate to the Monitor hub, and then select Link connections.
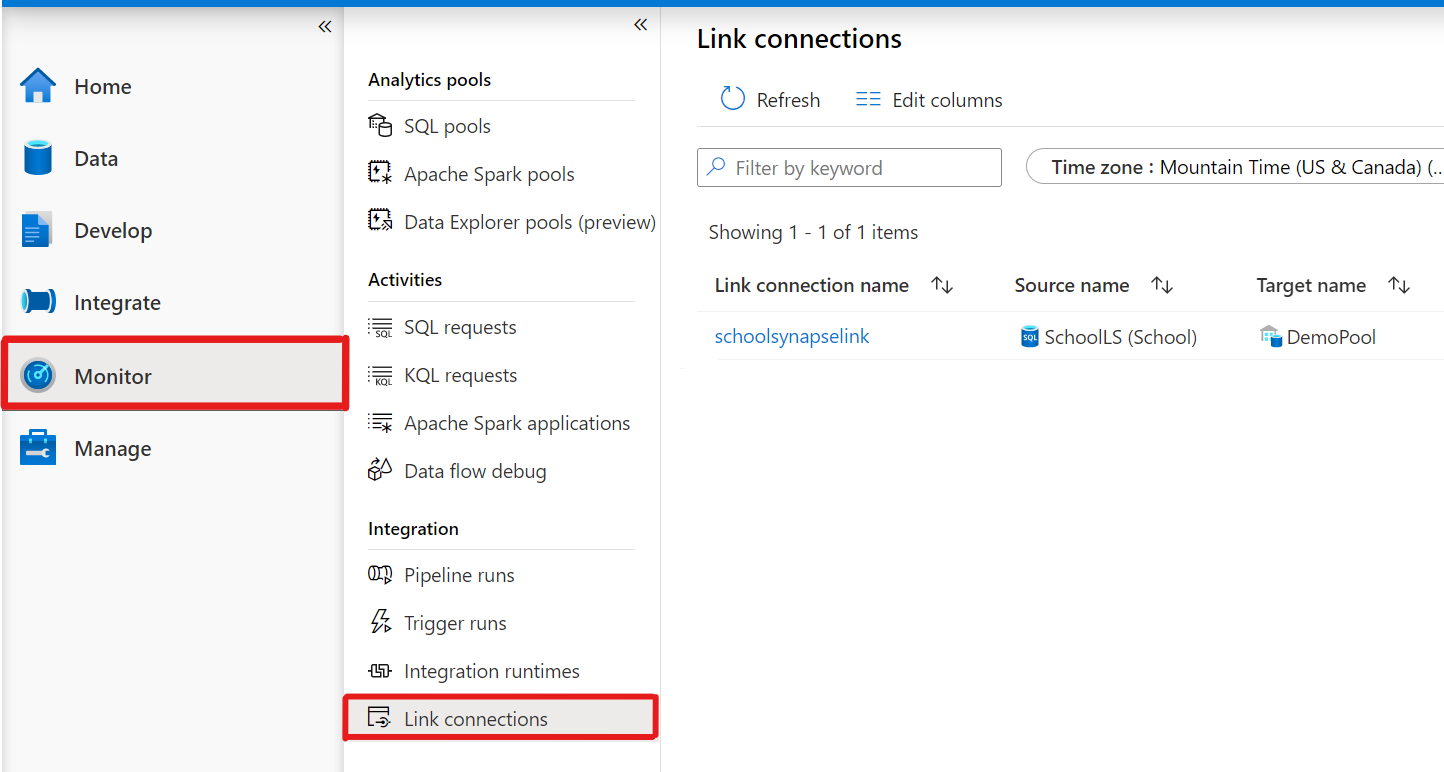
Automatically all your link connections will show up on this page, along with link-level monitoring metrics that summarize a few details of your link connection.

The link-level connection grid contains the following columns:
Column Name Description Link connection name Name of the Link Connection Source name The name of the data source where the data is coming from (Azure SQL Database or SQL Server 2022) Target name The name of the destination location where the data is being replicated into (a dedicated SQL Pool) Status Initial, Starting, Running, Stopping, Stopped, Pausing, Paused, or Resuming. Details of what each status means can be found here: Azure Synapse Link for Azure SQL Database Start time Start date and time for the link connection run (Month, Date, Year, HH:MM:SS AM/PM) End time End date and time for the link connection run (Month, Date, Year, HH:MM:SS AM/PM) Landing zone SAS token expire time Expiration date/time for the SAS token that is used to access the landing zone storage. More details can be found here: Configure an expiration policy for shared accessed signatures (SAS) Continuous run ID ID of the link connection run *Helpful when troubleshooting any issues and contacting Microsoft support. You need to manually select the Refresh button to refresh the list of link connections and their corresponding monitoring details. Autorefresh is currently not supported.
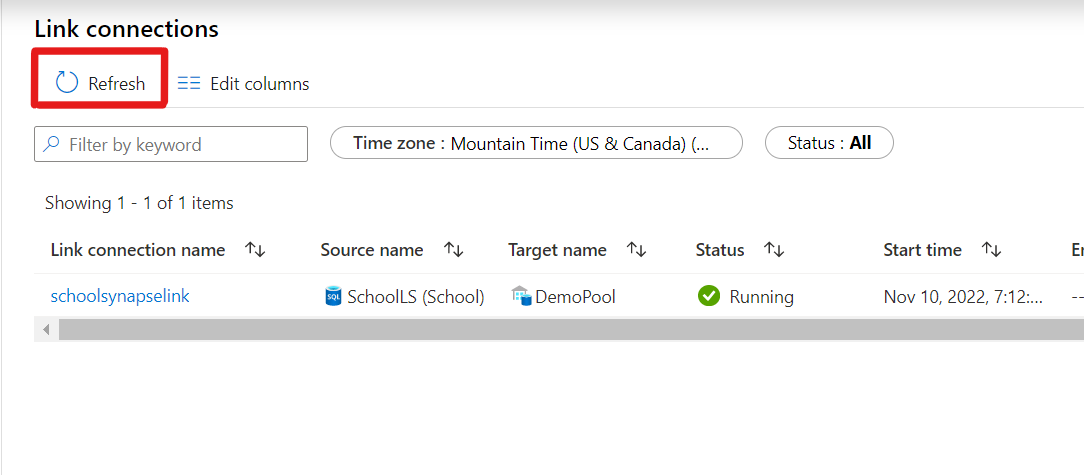

Table-level monitoring
Follow the same steps 1 and 2 above from the link-level monitoring.
Click on the Link connection name of the link connection that you want to monitor.
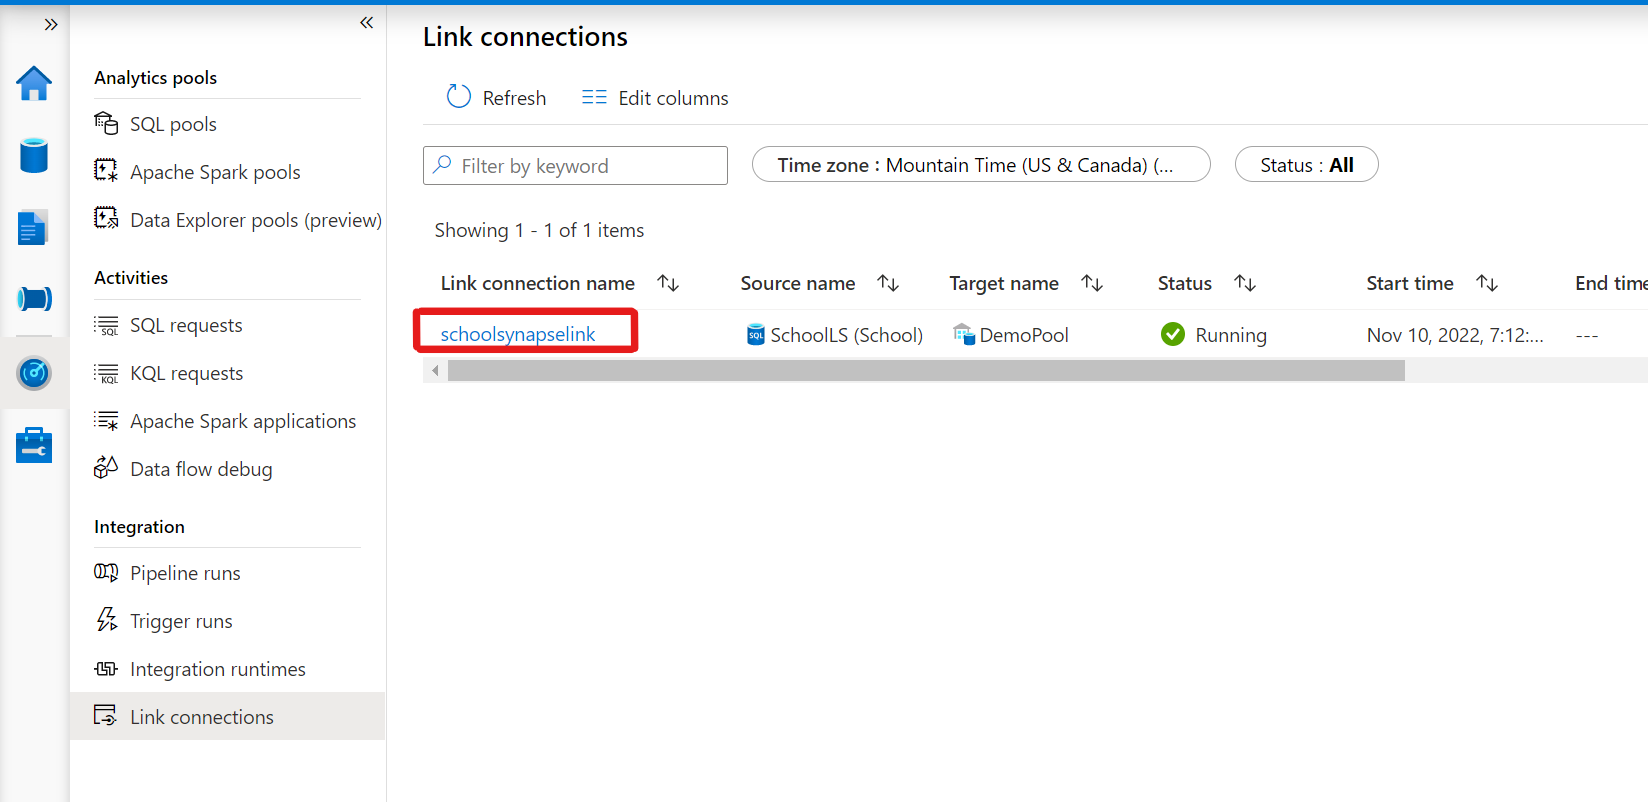
After clicking on your link connection, you'll see the tables and their corresponding table-level metrics that summarize a few details about the tables that you're replicating over in your link connection.

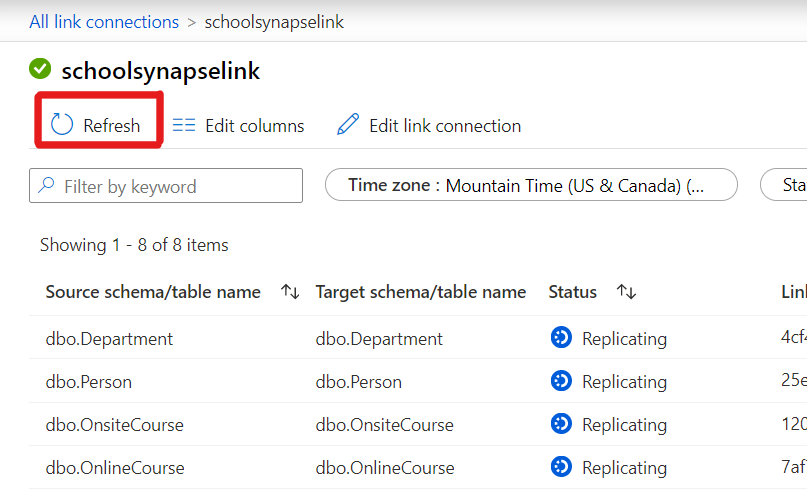
The table-level connection grid contains the following columns:
Column Name Description Source schema/table name Name of the source table that is being replicated from Target schema/table name Name of the destination table that the source table is being replicated to Status Waiting, Snapshotting, Replicating, Failed, Suspended. Details of what each status means can be found here: Azure Synapse Link for Azure SQL Database Link table ID ID of the table in the link connection. *Helpful when troubleshooting any issues and contacting Microsoft support. Processed rows Row counts processed by Synapse Link for SQL Processed data volume Data volume in bytes processed by Synapse Link for SQL Time of last processed data Time when last processed change data arrived in the landing zone (Month, Date, Year, HH:MM:SS AM/PM) You need to manually select the Refresh button to refresh the list of tables in the link connections and their corresponding monitoring details. Autorefresh is currently not supported.

Advanced monitoring with Azure Monitor
No matter what cloud applications you're using, it's hard to manage and keep track of all the moving pieces. Azure Monitor provides base-level infrastructure metrics, alerts, and logs for most Azure services. Azure diagnostic logs are emitted by a resource and provide rich, frequent data about the operation of that resource. Azure Synapse Analytics can write diagnostic logs in Azure Monitor, to help you understand deep insights about your applications, improve application performance, and more.
For more information, refer to How to monitor Synapse Analytics using Azure Monitor
In this section, we'll deep dive into setting up metrics, alerts, and logs in Azure Monitor to ensure that you understand more of the advanced capabilities of monitoring your link connection.
Metrics
The most important type of Monitor data is the metric, which is also called the performance counter. Metrics are emitted by most Azure resources. Azure Monitor provides several ways to configure and consume these metrics for monitoring and troubleshooting.
Azure Synapse Link emits the following metrics to Azure Monitor:
| Metric | Aggregation types | Description |
|---|---|---|
| Link connection events | Sum | Number of Synapse Link connection events, including start, stop, and failure |
| Link latency in seconds | Max, Min, Avg | Synapse Link data processing latency in seconds |
| Link processed data volume (bytes) | Sum | Data volume in bytes processed by Synapse Link |
| Link processed rows | Sum | Row counts processed by Synapse Link |
| Link table events | Sum | Number of Synapse Link table events, including snapshot, removal, and failure |
Now let’s step through how we can see these metrics in the Azure portal.
Sign in to the Azure portal.
Search for your Synapse workspace that your link connection resides in.
Once you've landed on the overview page for your Synapse Workspace, click on the Metrics tab underneath “Monitoring”.
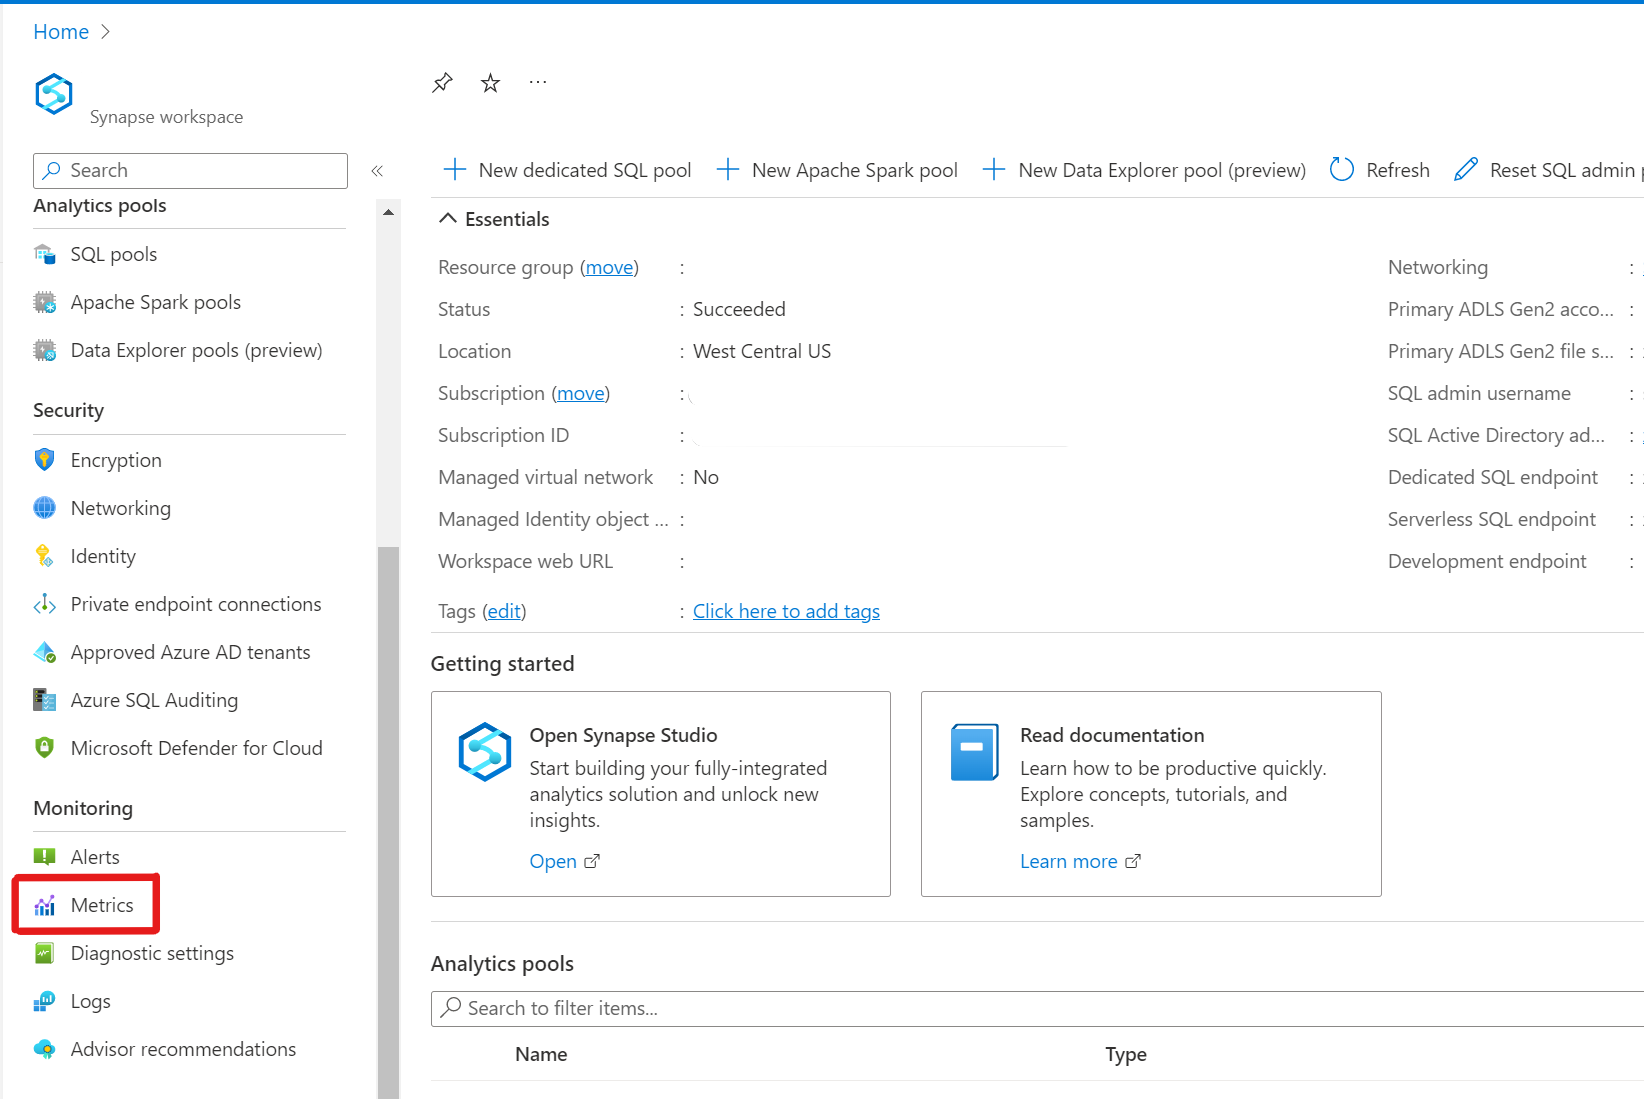
You'll then see a new chart that is automatically generated for you.
Under the Metric dropdown, you'll see many different categories of metrics. You want to scroll down to the INTEGRATION category, and choose any one of the 5 Link metrics:
- Link connection events
- Link latency in seconds
- Link processed data volume (bytes)
- Link processed rows
- Link table events
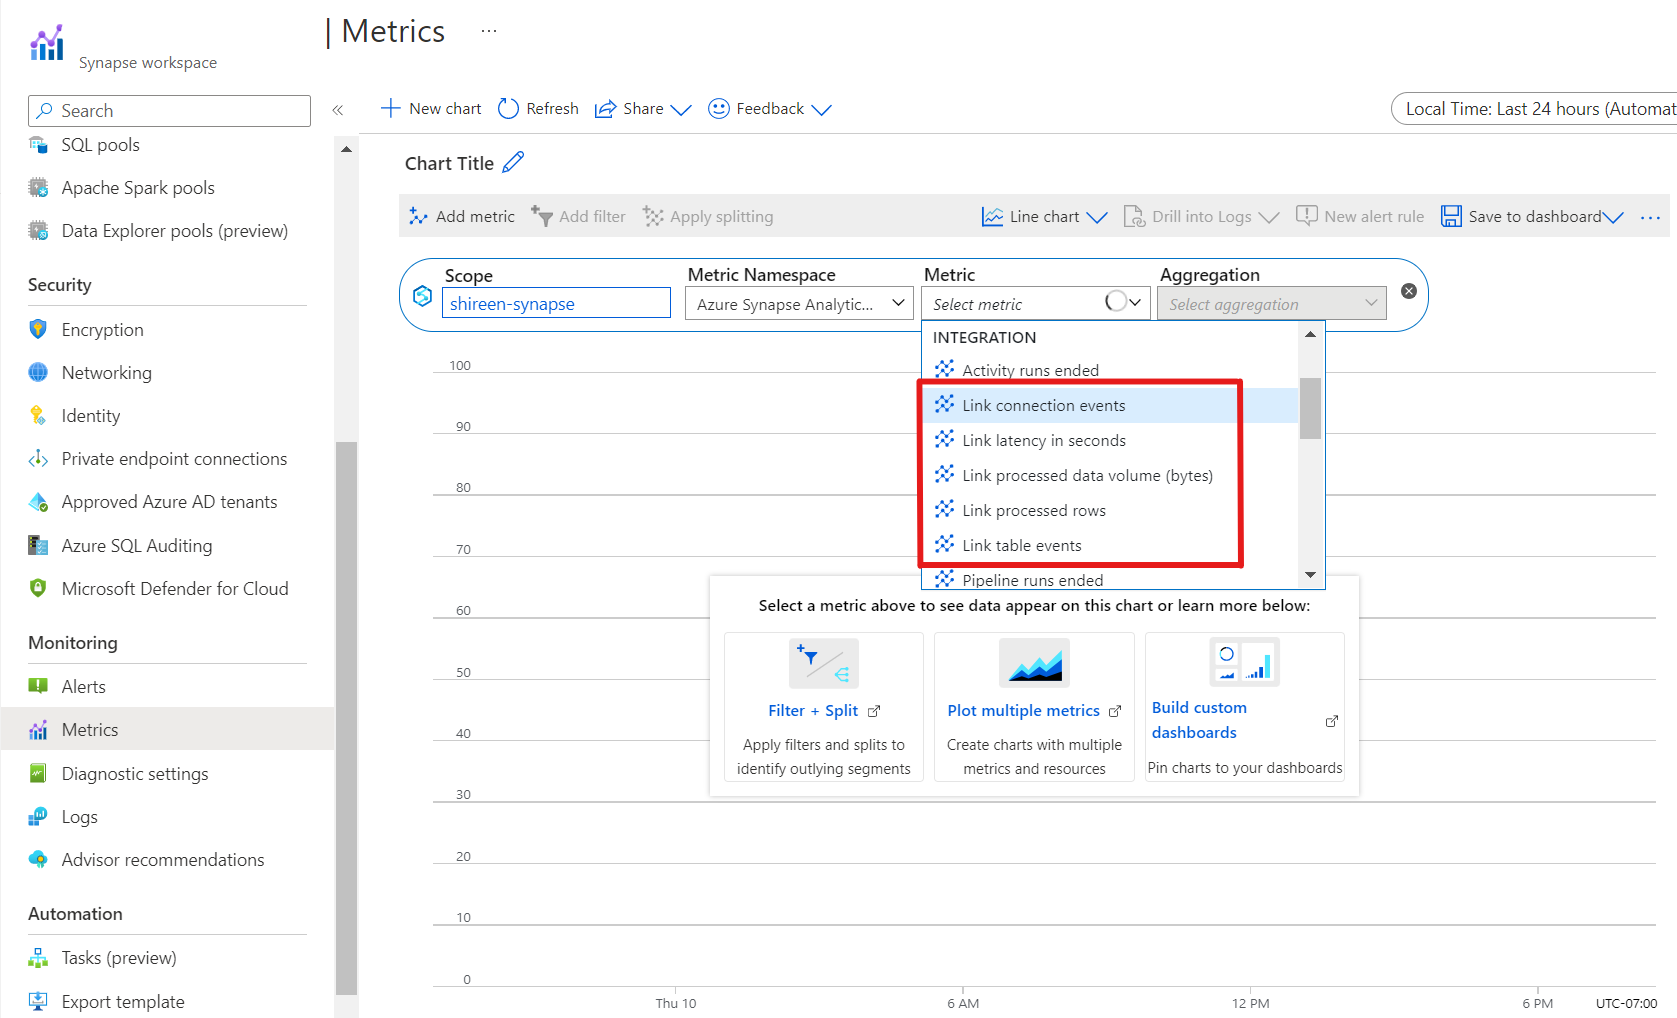
After selecting a metric of your choosing, you can see a graph representation of the data below.

A few things that you can adjust on this screen (refer to the letter on the screenshot above to the bullet point letter below):
You can add another chart.
You can add another metric to the same chart. Then you can click between the metrics and their corresponding graphs.
You can customize the aggregation. Some of the metrics only have one aggregation, but others have many. Refer to the chart above for the aggregations available for each metric.
You can pick how far back you want the metrics to go. By default, the metrics show the past 24 hours, but you've the ability to customize the time period by clicking on the time.
You can pin your metrics chart to your dashboard. This functionality makes it easy to look at your specific chart whenever you log in into your Azure portal.

Alerts
Azure Monitor has set up built-in functionality to set up alerts to monitor all your Azure resources efficiently. Alerts allow you to monitor your telemetry and capture signals that indicate that something is happening on the specified resource. Once the signals are captured, an alert rule a defined to see if the signal meets the criteria of the condition. If the conditions are met, an alert is triggered, and notifications are sent through the appropriate channels.
In this section, we're going to walk through how you can set up alerts for your Azure Synapse Link connection through Azure Synapse Analytics. Let’s say, for example, that you're running your link connection and realize that you want to monitor the latency of your link connection. The workload requirements for this scenario require that any link connection with a maximum latency over 900 seconds (or 15 minutes) needs to be alerted to your Engineering team. Let’s walk through how we would set up an alert for this example:
Sign in to the Azure portal.
Search for your Synapse workspace that your link connection resides in.
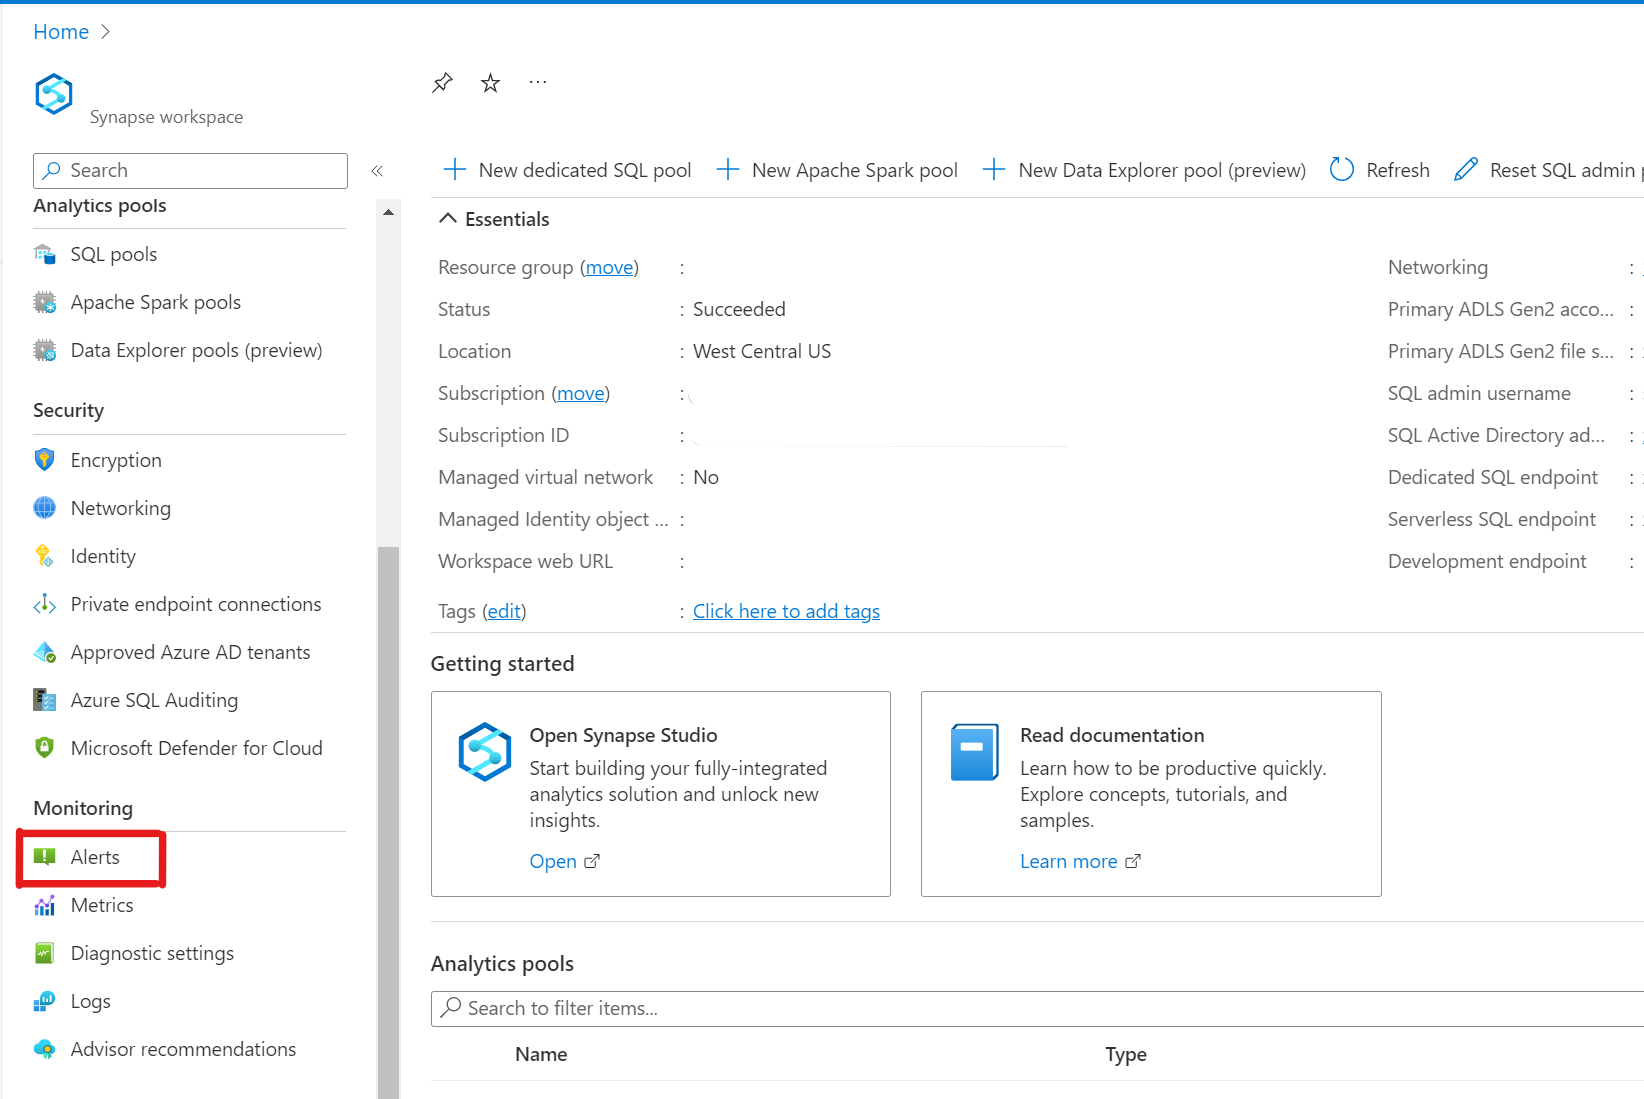
Once you've landed on the overview page for your Synapse Workspace, click on the Alerts tab underneath “Monitoring”.
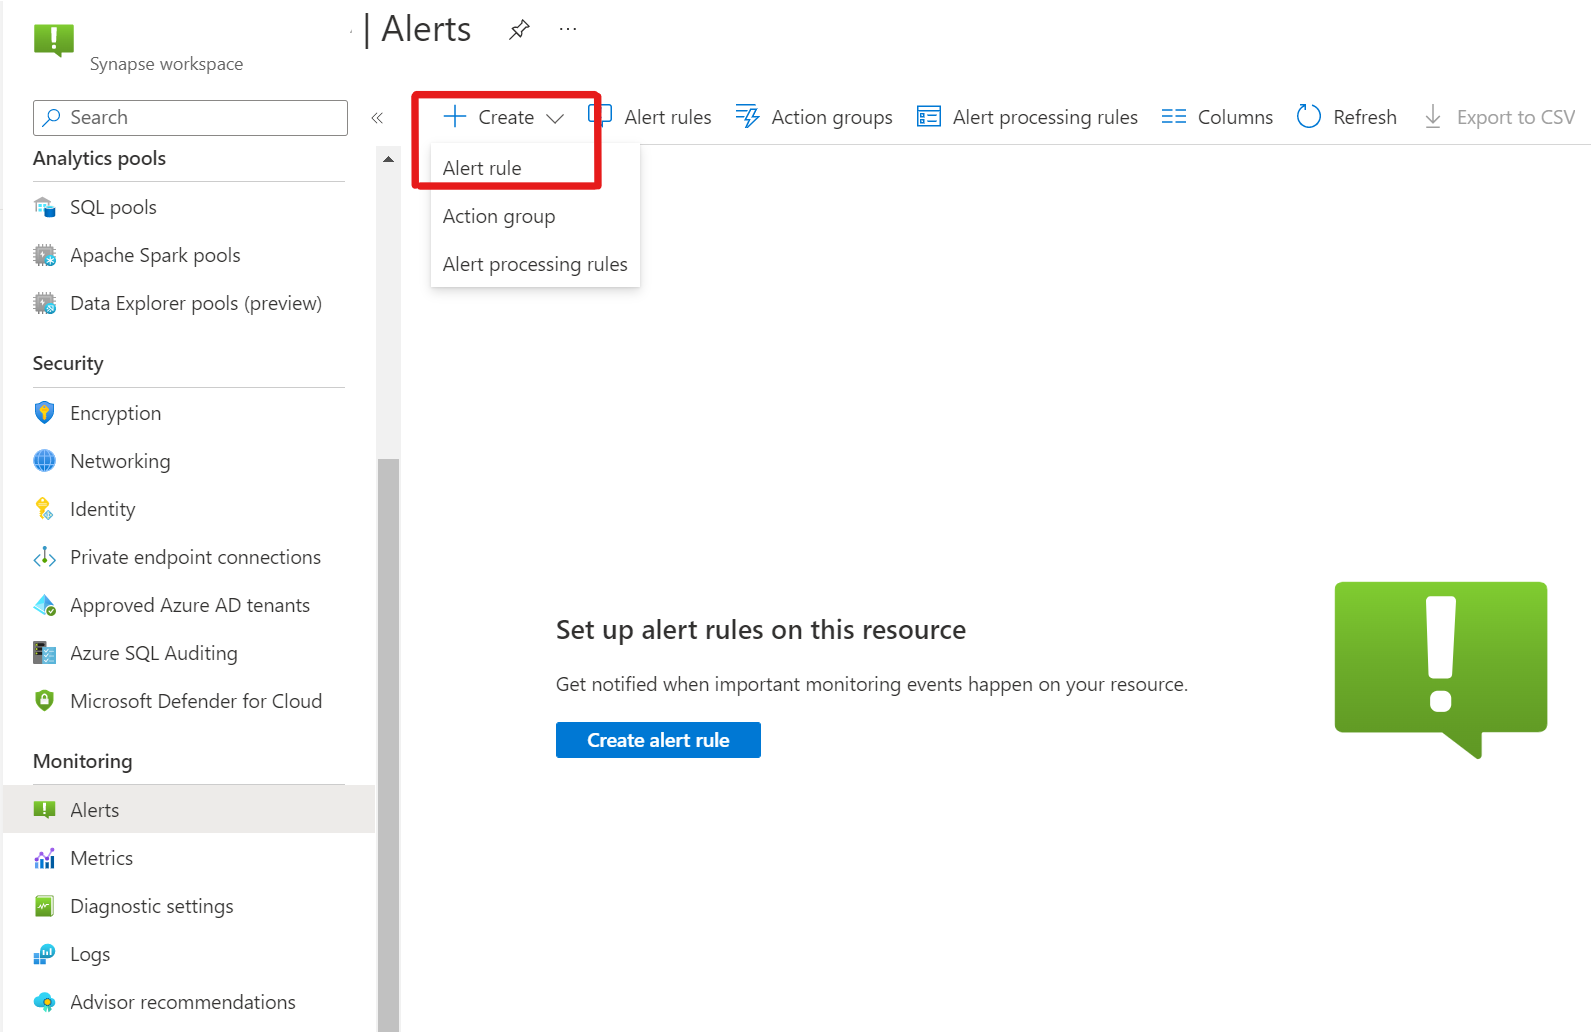
Click on the dropdown Create.
Click on Alert rule to add a new alert rule.
The first step is to define the scope. The scope is the target resource that you want to monitor, and in this case, your scope should be Azure Synapse Analytics. The scope should automatically be filled out as current Azure Synapse Analytics workspace that you're creating the alert for.
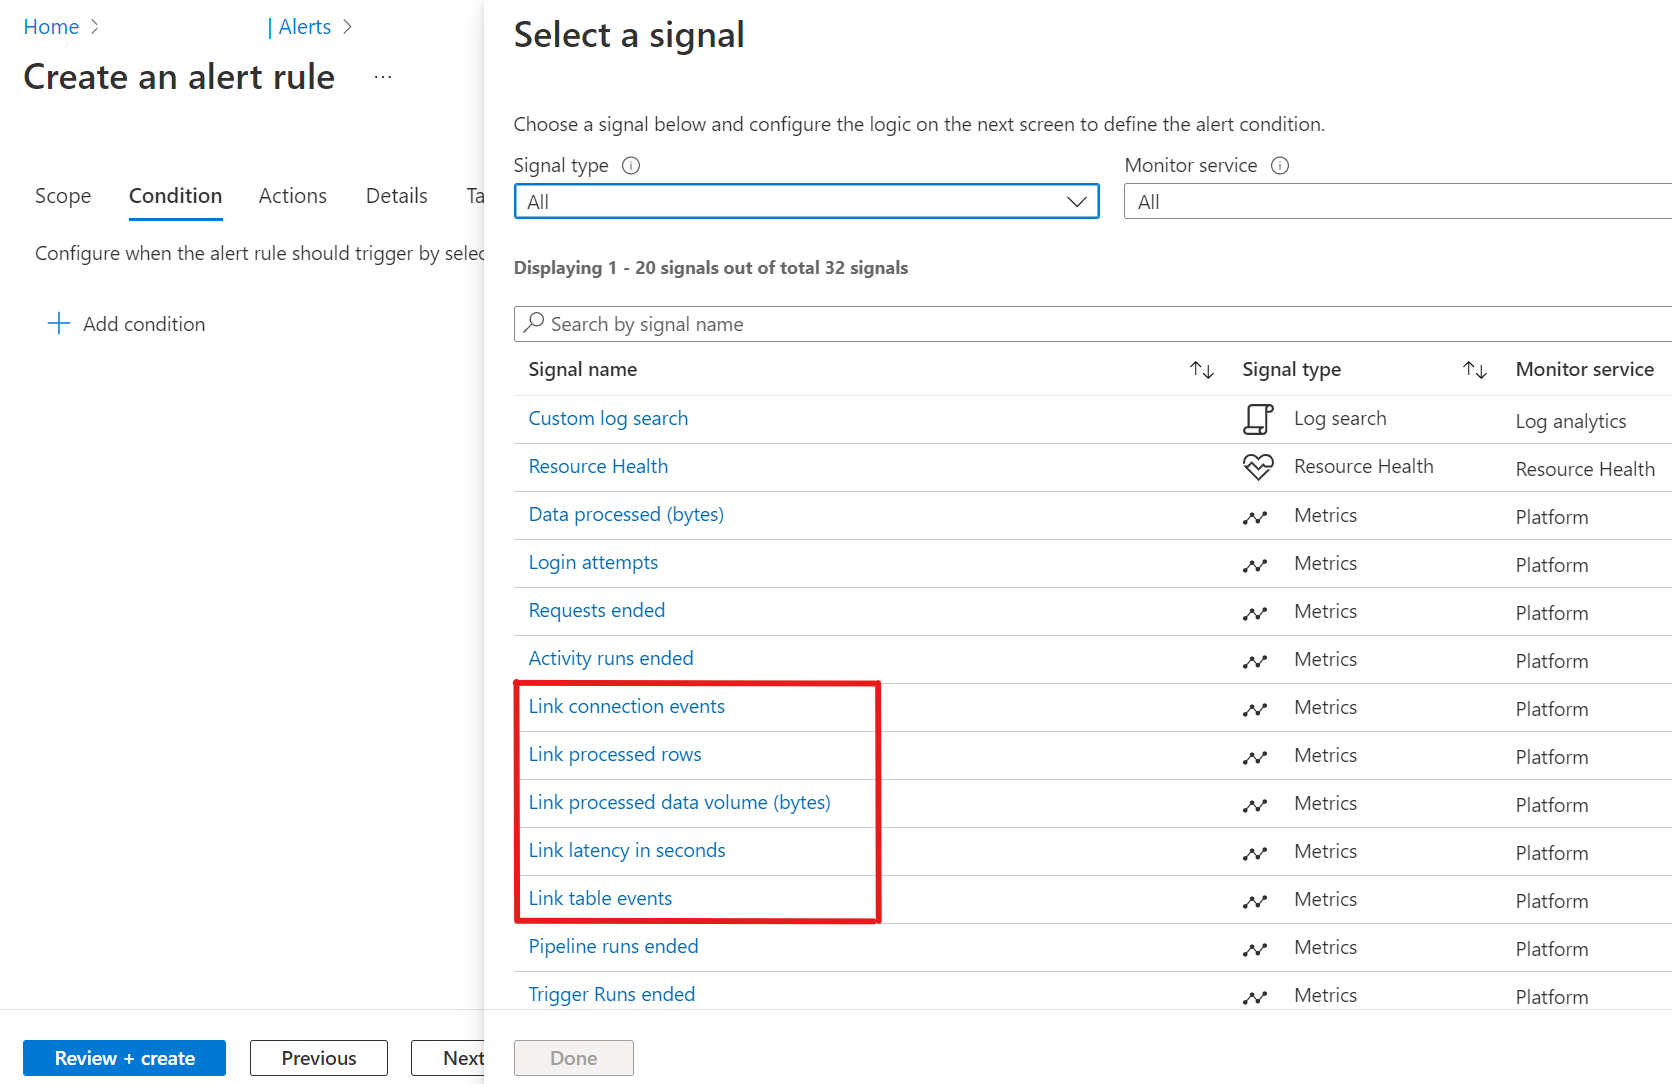
Second, we need to define the condition. The condition defines the logic of when the alert rule should trigger.
a. Click +Add condition
b. You can see the 5 link connection signal names. For this example, let’s choose the Link latency in seconds signal.
Third, we need to configure the alert logic, or when the alert rule should be triggered.
Select Static for the Threshold field
Enter the following values for Aggregation type, Operator, and Unit fields:
- Aggregation type: Maximum
- Operator: Greater than
- Unit: Count
Input a Threshold value of 900 (Note: this value is in seconds)
You can also configure the Split by dimensions value that monitors specific time series and provides context to the fired alert. These additions do have their own separate charge. For this example, we'll leave it blank.
Choose 30 minutes for Check every and 1 hour for Lookback period fields. These fields define how often you want the checks to happen.
The graph in the Preview shows the events based on the alert logic that we defined, along with the estimated cost per month.

Fourth, we now need to set up Actions. we'll configure an action group, which is a set of actions that can be applied to an alert rule.
a. The Select action group option is chosen if you already have an action group that you want to choose. Let's click on create action group.
On the Basic tab, pick a Subscription, resource group, and region. Then provide appropriate values for the Action group name and Display name. Then press Next.
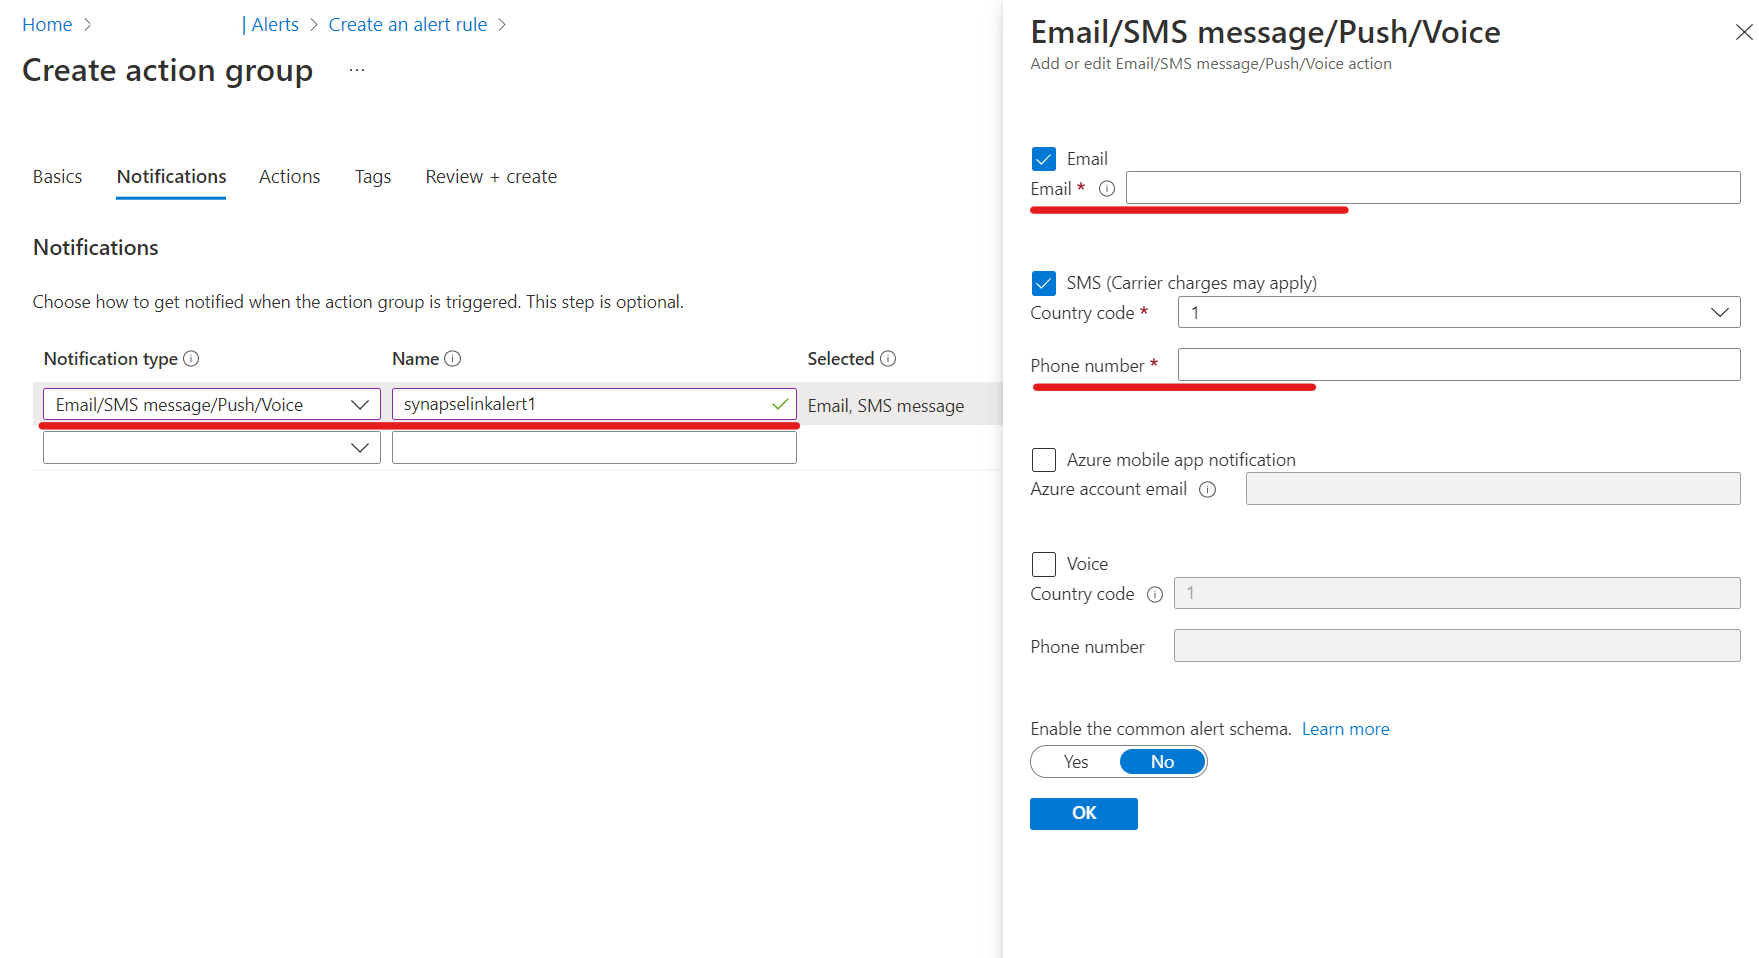
On the Notifications tab, under the Notification type, select Email/SMS message/Push/Voice. And give it an appropriate name.
a. Check the boxes for Email and SMS, and then provide the corresponding values. Then press OK.
b. Then press Next.
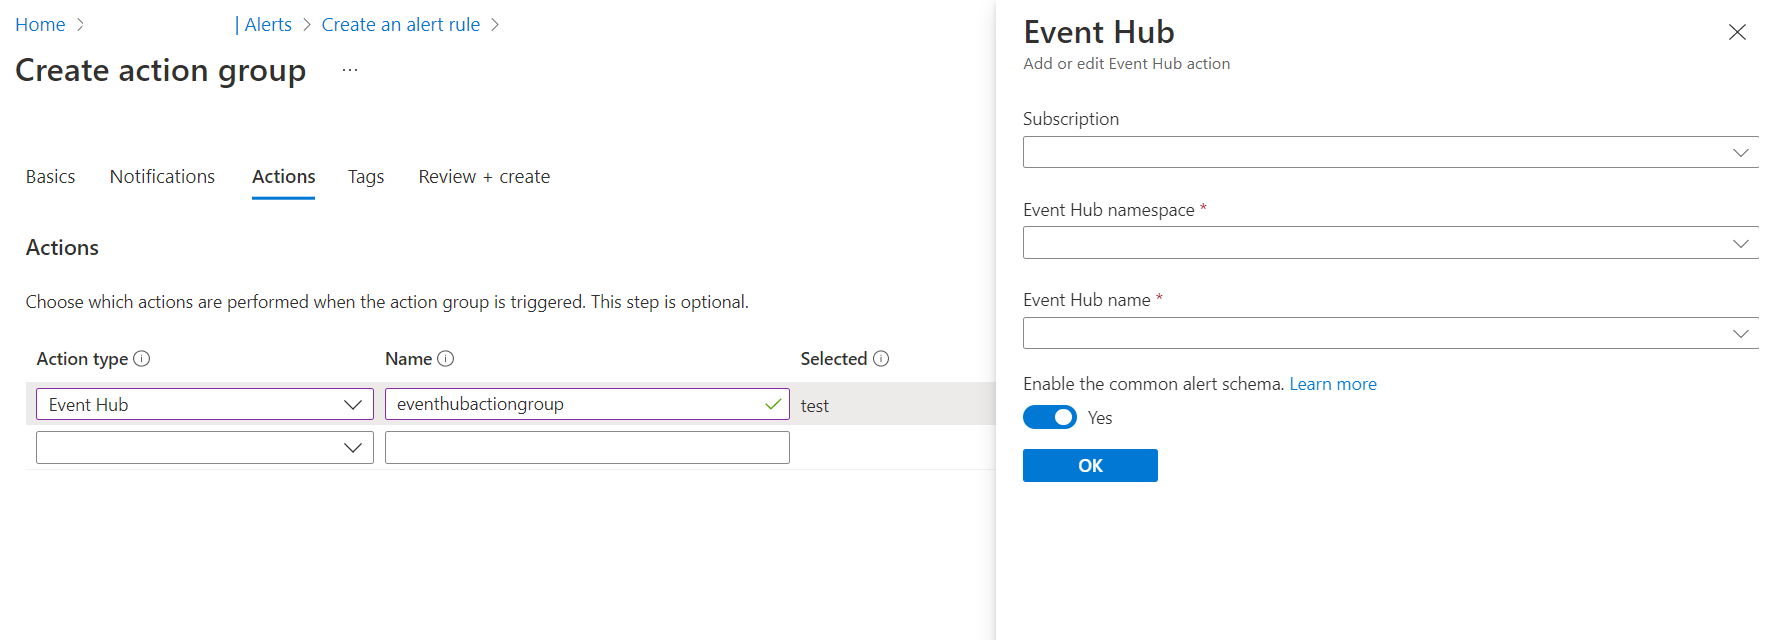
On the Actions tab, let’s select an option for Action type.
In this example, let's use the Event Hubs action type, so we'll need to input the subscription name, Event Hub namespace, and select an Event Hub name. Then click on OK.
a. If you don’t have an Event Hub created, refer to the document here to create one: Configure an expiration policy for shared accessed signatures (SAS)
Click on Review + Create to review the settings, and then hit Create.
Immediately we're taken back to the Alerts homepage. If we click on the Alert Rules on the top, we can see our newly created alert.
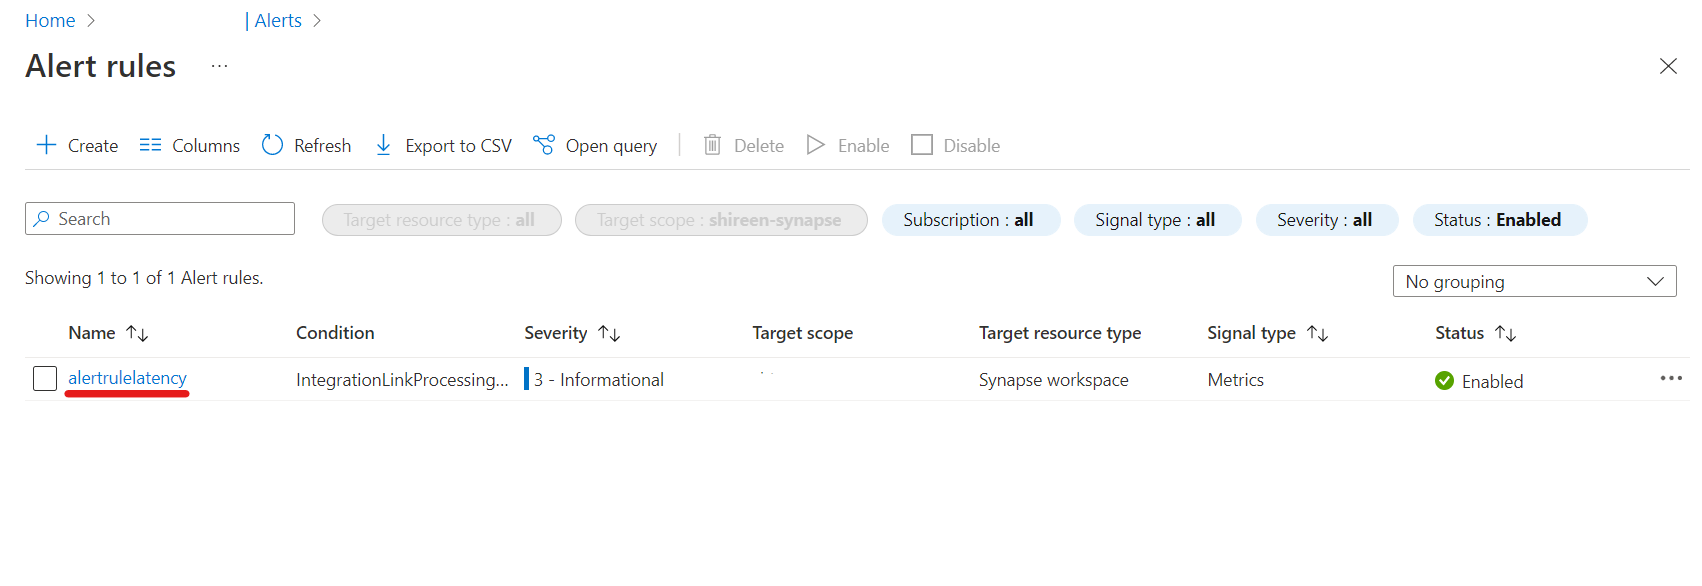

This was just one example of how to create an alert rule following an example. You've the ability to create multiple alerts for your Azure Synapse Link connections through Azure Synapse Analytics.
Logs
Azure Monitor Logs is a feature of Azure Monitor that collects and organizes log and performance data from monitored resources. Several features of Azure Monitor store their data in Logs and present this data in various ways to assist you in monitoring the performance and availability of your cloud and hybrid applications and their supporting components. You can analyze Logs data by using a sophisticated query language that’s capable of quickly analyzing millions of records.
Now let’s step through how we can see logs for our Azure Synapse Link connections in the Azure portal:
Sign in to the Azure portal.
Search for your Synapse workspace that your link connection resides in.
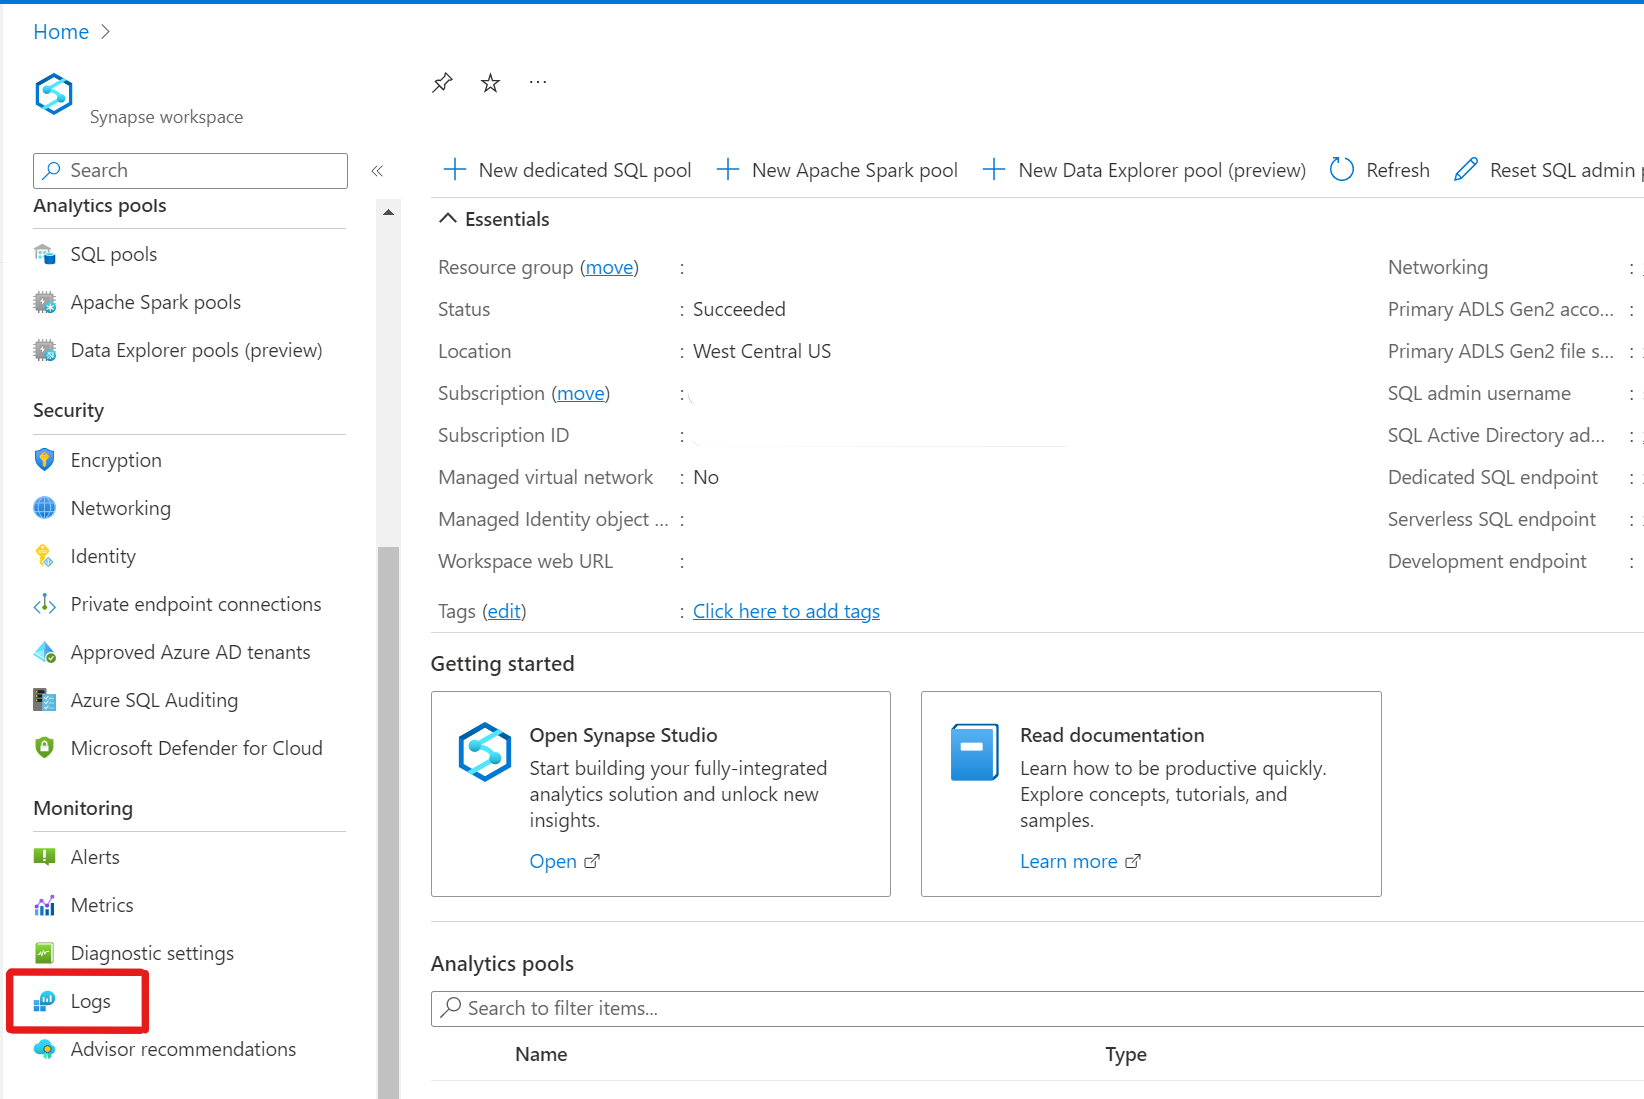
Once you've landed on the overview page for your Synapse Workspace, click on the Logs tab underneath “Monitoring”.
You're immediately greeted with a workspace that is roughly the equivalent of a database in Azure Data Explorer. Tables are structured the same, and both use Kusto Query Language (KQL)
a. There is a table called “SynapseLinkEvent” that stores many different values for each of the link connections. The table and the details are shown on the left-hand side.
b. You can perform a query in the query pane that retrieves a specific set of records. In this case, we'll type in “SynapseLinkEvent” in the query pane and then press the blue Run button. We can see the link connections that ran in the Results section where you can see details about each of the link connections.


Next steps
If you're using a database other than an Azure SQL database, see:
Feedback
Coming soon: Throughout 2024 we will be phasing out GitHub Issues as the feedback mechanism for content and replacing it with a new feedback system. For more information see: https://aka.ms/ContentUserFeedback.
Submit and view feedback for