How to deploy to production with Desktop Analytics
After you've deployed to pilot and have reviewed the status of your assets, you're ready to update the rest of your production environment.
Use the following definitions to differentiate between pilot and production:
Pilot: A subset of your devices that you want to validate before you deploy to a larger set. Use Desktop Analytics to add individual devices to the pilot set. Devices in the pilot are ready to upgrade when:
All assets that have Microsoft known issues have been marked as Ready or Ready (with remediation) Note.
No assets have been marked as Unable to upgrade.
Production: All other devices enrolled to Desktop Analytics that aren't in the pilot. Production devices are ready to upgrade when all Critical and Important assets are marked as Ready or Ready (with remediation) Note. Desktop Analytics automatically signs off all other assets.
Note
Starting in Configuration Manager version 2103 with update rollup 10036164, items can also be marked Ready (with remediation).
There are three main parts to accomplishing the deployment of updates to production devices:
Review assets that need an upgrade decision: To make devices ready for production deployment, their assets must have their upgrade decision set to Ready or Ready, remediations required.
Deploy to devices that are ready: Use Configuration Manager to update devices that are ready. Desktop Analytics provides the list of devices ready for production deployment, and reports for monitoring the success of the deployment.
Monitor the health of updated devices: As the update deployment progresses, monitor the health of important assets. If some need attention, troubleshoot and fix those issues. If you decide the issues can't be fixed, stop the deployment to the affected devices by setting their upgrade decision to Unable.
Note
When you're confident in the success of the pilot deployment, start the production deployment at any time. There's no requirement that all pilot devices reach the "completed" state first.
Review assets that need an upgrade decision
Desktop Analytics guides you through the process of reviewing your assets for production deployment. In Desktop Analytics, go to Deployment plans, select a deployment plan, and then select Prepare production in the left menu.

Review the state of your apps. Use that information to set the upgrade decision for each of those assets.
Use each of the tabs to review the status of the apps. In each tabbed view, you can filter the results to show devices that are on track for upgrade, need your attention, devices with mixed results, and those devices in an undetermined state.
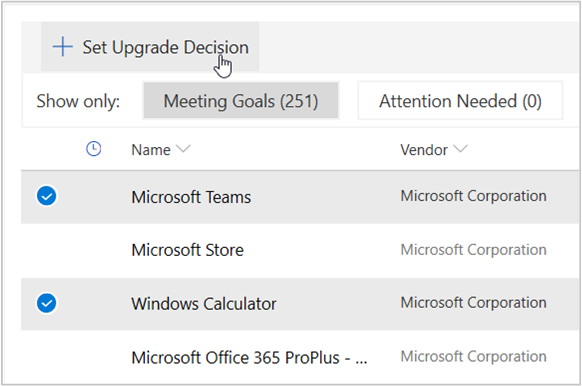
Select Meeting Goals to filter the view to assets that are likely ready for production deployment based on the following criteria:
Risk: a pre-upgrade assessment of known risks for updating devices that have this asset installed
Health status: a post-upgrade assessment of devices in other deployments and whether they experienced problems after the update was installed. For more information about health, see Monitor the health of updated devices.
To approve an asset for upgrade, select the name in the list, and then select one of the following options from the Upgrade decision list:
- Review in progress
- Ready
- Ready (with remediation)
- Unable
- Not reviewed
To set this value for multiple apps at once, use the first column to Select this item, and then choose Set Upgrade Decision.
Select No data to view assets that couldn't be classified. These assets generally are assets that don't have enough coverage for Desktop Analytics to perform an analysis of the risk or health status. To improve the coverage, add additional devices with these assets to the pilot, or ask pilot users to try these assets.
There might also be assets in the Attention Needed or Mixed Results state. These assets may require additional review before you make an upgrade decision for them.
Review all apps. Once a given device has a positive upgrade decision for all assets, then its state changes to "ready for production." See the current count on the main page for the deployment plan by selecting the third deployment step, Deploy.
Deploy to devices that are ready
Configuration Manager uses the data from Desktop Analytics to create a collection for the production deployment. Don't deploy the task sequence using a traditional deployment. Use the following procedure to create a Desktop Analytics-integrated deployment:
If you followed the recommended process to Deploy to pilot devices, the Configuration Manager phased deployment is ready. As you mark assets as ready, Desktop Analytics automatically synchronizes those devices to Configuration Manager. These devices are then added to the production collection. When the phased deployment moves to the second phase, these production devices receive the upgrade deployment.
If you configured the phased deployment to Manually begin the second phase deployment, then you need to manually move it to the next phase. For more information, see Manage and monitor phased deployments.
If you created a Desktop Analytics-integrated single deployment to the pilot collection, then you need to repeat that process to deploy to the production collection.
Address deployment alerts
As with the pilot deployment, Desktop Analytics advises you of any issues that need your attention during the production deployment. In Desktop Analytics, go to the deployment plan, and select Deployment status in the left menu. The deployment status view lists devices in the following categories:
- Not started
- In progress
- Completed
- Needs attention - Devices (sorted by device name)
- Needs attention - Issues (sorted by issue type)

Monitor the health of updated devices
Note
Starting in July 2021, the Monitor health page only reports on devices that run Windows 10 version 1809 or later. For more information, see Support for the Windows diagnostic data processor configuration.
The Prepare production page focuses on helping you make upgrade decisions for your assets. That page by default shows only those assets that aren't yet in the Ready state. The Monitor health page shows health issues on any noteworthy asset, even those assets that are marked Ready. If it discovers issues, you can troubleshoot and fix the problem, or change the upgrade decision to Unable. When you change the upgrade decision, this action prevents future upgrades on devices with that asset.
Filter this page by assets with the following health states:
| Health status filter | Description |
|---|---|
| Attention needed | (Default filter) Desktop Analytics detects a statistically significant regression to some health metric for that asset |
| Meeting goals | Desktop Analytics detects no regression in behavior |
| Insufficient data | Desktop Analytics doesn't have enough data about this asset to make any recommendations |
| No data | No usage data yet available for this asset |
To show an unfiltered view of all assets, select the current filter. This action removes that filter.
Note
To reduce the number of assets with insufficient data, Desktop Analytics monitors the assets on all of your devices that have upgraded to the target Windows version specified in your deployment plan. These devices include those not included in the specific deployment plan.
The default sort order is by the number of devices that have had an incident with that particular asset, so you can quickly see which ones are causing the most problems. For example, when viewing Apps, it sorts by Devices with app crashes last 2 weeks.
If you want to look at health for all assets, even those assets with insufficient data for Desktop Analytics to make statistical inferences, use the following process:
Select the drop-down on the Devices with app crashes last 2 weeks column. Add a filter to only those assets that have had incidents on some minimum number of devices to be interesting. For example, show items with values greater than 100.
Select the drop-down on the % Devices with app crashes last two weeks column, and select to sort by Descending.
The resulting view shows the assets with the highest rate of incident at a minimum number of incidents.
Select an asset to get more details or change its upgrade decision.
For more information, see Health status monitoring.
Feedback
Coming soon: Throughout 2024 we will be phasing out GitHub Issues as the feedback mechanism for content and replacing it with a new feedback system. For more information see: https://aka.ms/ContentUserFeedback.
Submit and view feedback for