Troubleshooting: Using the Event Viewer to Monitor Long Running SQL Queries in Business Central
This article shows how you can monitor long running SQL queries in Event Viewer. You use the information determine SQL queries that are good candidates for optimization.
Resolution
Identifying long running SQL queries can be a good starting point when doing a performance analysis. Open the Event Viewer and go to the Windows Logs Application.
Note
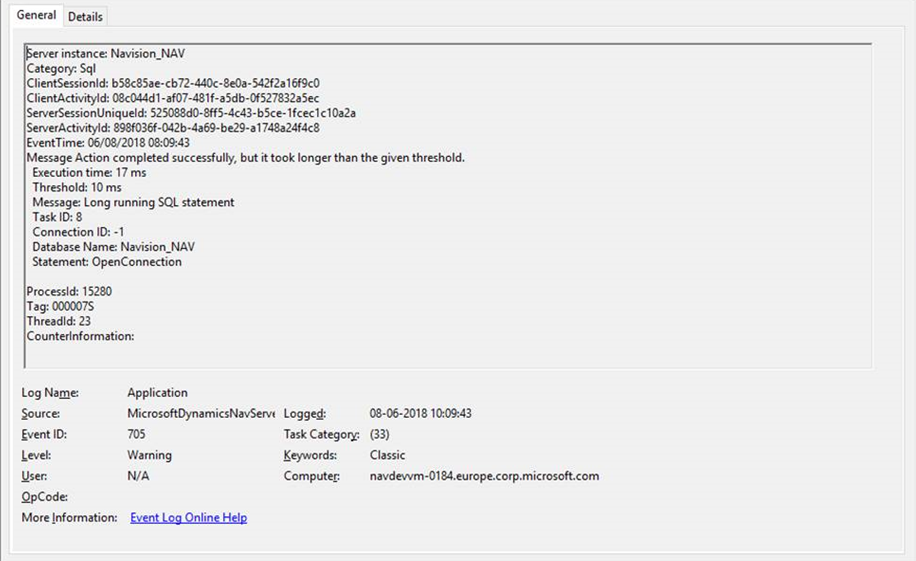
The SQL queries which exceed the set threshold will be displayed in the Application window of the Event Viewer as Warning.
If the value of the SqlLongRunningThreshold key was set to the default value of 1000 milliseconds, you'll see the message: "Action completed successfully, but it took longer than the given threshold." for actions that took longer.
To meet performance expectations in production, you can set the threshold to a different value. You can set the threshold without restarting the server instance. For more information on how to set the threshold, see Monitoring Long Running SQL Queries using the Event Log.
If the value of the SqlLongRunningThreshold key was set to the default value of 1000 milliseconds, you'll see the message: "Action completed successfully, but it took longer than the given threshold." for actions that took longer. To meet your performance expectations in production, you can set the threshold to a different value without doing a server restart. For more information, see Monitoring Long Running SQL Queries using the Event Log.
Using the AL call stack
Long running queries that involve the explicit execution of AL code will include an AL call stack in the event log. Long running queries that aren't the result of explicit AL code won't include an AL call stack. For example:
- GetPage calls that load data into the UI.
- Calls to triggers that don't include any code. These calls won't include an AL call stack, because there no AL code is run.
Looking at the AL call stack can help you identify what caused the delay. For queries that include an AL call stack, the generated SQL statement is listed in the AL CallStack column. The following code example shows which AL method generated a slow running query.
Server instance: BC
Category: Sql
ClientSessionId: 00000000-0000-0000-0000-000000000000
ClientActivityId: 828c9342-891a-4631-8eb3-a1da7304fdc9
ServerSessionUniqueId: 24b32889-9be9-439f-b86c-9615d5e51319
ServerActivityId: 19bf285d-a8f2-42b6-a4c0-4afe9fb5b4b4
EventTime: 06/08/2018 08:10:15
Message Action completed successfully, but it took longer than the given threshold.
  Execution time: 33 ms
  Threshold: 10 ms
  Message: Long running SQL statement
  Task ID: 3
  Connection ID: 2
  Database Name: BCDB
  Statement: SELECT "2161"."timestamp","2161"."User","2161"."Default Execute Time","2161"."Current Job Queue Entry" FROM "SQLDATABASE".dbo."CRONUS International Ltd_$Calendar Event User Config_" "2161"  WITH(UPDLOCK)  WHERE ("2161"."User"=@0) OPTION(OPTIMIZE FOR UNKNOWN)
    AppObjectType: CodeUnit
  AppObjectId: 2160
  AL CallStack: "Calendar Event Mangement"(CodeUnit 2160).GetCalendarEventUserConfiguration line 2
"Calendar Event Mangement"(CodeUnit 2160).FindJobQueue line 1
"Calendar Event Mangement"(CodeUnit 2160).FindOrCreateJobQueue line 1
"Calendar Event Mangement"(CodeUnit 2160).CreateOrUpdateJobQueueEntry line 1
"Calendar Event"(Table 2160).Schedule line 12
"Calendar Event"(Table 2160).OnInsert(Trigger) line 1
"Calendar Event Mangement"(CodeUnit 2160).CreateCalendarEventForCodeunit line 6
"Create Telemetry Cal. Events"(CodeUnit 1352).OnRun(Trigger) line 5

ProcessId: 15280
Tag: 000007L
ThreadId: 10
CounterInformation:
See Also
Troubleshooting: Analyzing Long Running SQL Queries Involving FlowFields by Disabling SmartSQL
Monitoring Long Running SQL Queries using the Event Log
Tools for Monitoring Performance Counters and Events
Business Central Server Administration Tool
Troubleshooting: Using Query Store to Monitor Query Performance in Business Central
SQL Trace
Feedback
Coming soon: Throughout 2024 we will be phasing out GitHub Issues as the feedback mechanism for content and replacing it with a new feedback system. For more information see: https://aka.ms/ContentUserFeedback.
Submit and view feedback for