Configure advanced settings for forecasts
Use the Advanced step of the forecast configuration to customize the forecast. You can enable features, such as multi-currency selection and Kanban view. You can also override column headers and customize the underlying records grid by using javascript.
License and role requirements
| Requirement type | You must have |
|---|---|
| License | Dynamics 365 Sales Premium or Dynamics 365 Sales Enterprise More information: Dynamics 365 Sales pricing |
| Security roles | System Administrator or Forecast Manager More information: Predefined security roles for Sales |
Automatically hide parent row
In a forecast, each parent row in the hierarchy entity has its own contributor row. This row shows the parent's individual simple columns, such as quota and revenue contribution. These dedicated contributor rows are shown whether or not they contain any values to contribute.
You may not want to see duplicate zero-value parent rows. To hide them, turn on Auto-hide parent row.
For example, Grace Mbele, a sales manager, has created a forecast based on the User hierarchy. On opening the forecast, Grace sees two rows each for the sales leads, Jeremy Johnson and Jason Smith. The first row is the parent. The second is the contributor row.

After turning on Auto-hide parent row, Grace still sees the rolled-up parent rows for Jeremy and Jason, but not the duplicate zero-value rows.

Important
The parent row won't be hidden if it has underlying records or values in simple columns.
Turn on multi-currency selection
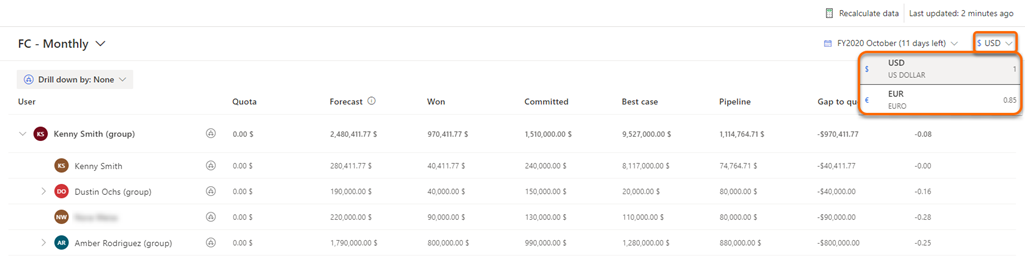
For global sales teams, viewing forecast revenue values in the organization's base currency might be confusing for users who are accustomed to working in their local currency. Turn on Multi-currency selection to convert forecast revenue data to any currency that's available in the system. The conversion happens in real time, based on the latest exchange rate defined by your organization.
For example, your organization has sales teams in the United States, Canada, and Europe. The US dollar is set as the base currency for your organization. The Canadian dollar and euro are also available in the system. You create a forecast with multiple-currency selection turned on. All three sales teams initially see the forecast revenue values displayed in US dollars. The sales teams in Canada and Europe can display revenue in their local currency. Any manual adjustments made to the forecast grid will use the selected currency.
Set Kanban as the default view for underlying records (preview)
[This section is prerelease documentation and is subject to change.]
Important
- This is a preview feature.
- Preview features aren’t meant for production use and may have restricted functionality. These features are available before an official release so that customers can get early access and provide feedback.
The underlying records of a forecast can be displayed in a table view or a Kanban (swimlane) view. Table view is the default. To change it, turn on Set kanban as default.

A user's most recent selection overrides the default for that user. For example, the default view for the underlying records of a forecast is Kanban and a user switches to the table view. The underlying records open in the table view the next time the user views the forecast.
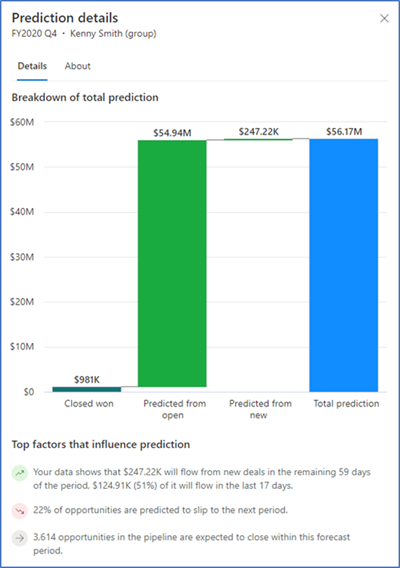
View prediction factors
Predictive forecasting draws on many factors to create a prediction. You can analyze these factors to discover new insights about your data and understand how it's influencing the prediction.
You'll need to turn on Enable prediction factors in your forecast's advanced settings first. To see the details of a prediction, including the top factors that influenced it, select a value in the Prediction column of the forecast.
Note
Premium forecasting must be turned on for the Prediction details view to work. For more information, see About premium forecasting.
Select the default attribute to group underlying records (preview)
From the Default group by attribute for underlying records (Preview) dropdown list, select an attribute by which to group underlying records by default. Users can select a different grouping attribute. Their selection overrides the default the next time they view the forecast.
The following screenshot illustrates how selecting the attribute will group the underlying records by default:

Note
Grouping is only available in the table view. If you want to group underlying records, you'll need to turn off Set kanban as default. If you select both Kanban view and grouping, then the default view is set to Kanban, and groups appear only when the user switches to the table view.
Select the default view for underlying records (preview)
If you want underlying records to open in a specific view (such as My open opportunities view) by default, select it in Default underlying records view. For more information, see View and manage underlying opportunities.
The following screenshot illustrates how selecting a default view displays the underlying records in that view by default:

Note
View selection is only available in the table view. If you want to open the records in a specific view by default, you'll need to turn off Set kanban as default. If you select both Kanban view and a default view, then the records open in Kanban view, and the default view appears only when the user switches to the table view.
Override column headers (preview)
In the Layout step of the forecast configuration, you select columns that you need in the forecast grid. These columns help your sellers better understand the forecast.

If you want to translate the column names or add tooltips for additional context, you can define a control with the customization that you need. You can then override the column headers with the custom control. For more information about how to create a custom control for the header, see Customize column headers in the forecast grid.
In the Override column headers (Preview) section, select the custom control that includes the customizations.

Customize underlying records grid
Add a JavaScript library to customize the underlying records grid in a forecast.
Before you upload the JavaScript library, it must be created according to the schemas defined in Events and context object.
Create a JavaScript library
Write your custom JavaScript code. The following example disables all fields except a few for the Opportunity entity.
function OnRowLoad(executionContext) {

// Get the logical name of the loaded entity as part of forecasting editable grid.
var entityName = executionContext.getFormContext().data.entity.getEntityName();

    if (entityName === "opportunity") {

        // Defining the attributes list from opportunity that must be enabled if loaded as part of view.
        var OPTY_ENABLE_ATTRS_LIST = ["name", "msdyn_forecastcategory", "actualvalue", "actualclosedate", "estimatedvalue", "estimatedclosedate"];

        executionContext.getFormContext().data.entity.attributes.forEach(
            attribute => {
                // Disabling all attributes other than OPTY_ENABLE_ATTRS_LIST
                if (!OPTY_ENABLE_ATTRS_LIST.includes(attribute.getName())) {
                    attribute.controls.get(0).setDisabled(true);
                }
            }
        )
    }
}
For more such customization examples, see Override save, update, and load events for editable fields on forecasting grid.
Note
- The function names in the JavaScript file must match the event names, and must accept the context object parameter.
- The forecasting context object that's referred to in the example is different from the execution context of Microsoft Dataverse. A forecasting context object is specific to forecasting. It supports the advanced configurations of the underlying records grid. For more information, see Events and context object.
Add your JavaScript code in a Script web resource
- In Dynamics 365 Sales, select Settings > Customizations.
- Select Customize the System.
- In the solution explorer, under Components, select Web Resources.
- Select New.
- Enter a Name (for example, mySampleScript.js) and Display Name (for example, Sample: Walkthrough script) for your web resource.
- In Type, select Script (JScript), and then do one of the following:
- Select Choose File to upload a file containing your JavaScript code.
- Select Text Editor, and then paste your JavaScript code in the editor.
- Select Save, and then select Publish.
Upload the JavaScript library to your forecast
Note
You can have only one JavaScript file at a time in a forecast. You must remove the existing file before you can upload a new one. You can add a file to a forecast at any time.
On the forecast configuration page, Advanced step, under Customize underlying records, select Add a javascript library.
Search for your JavaScript file, and then select Add.

Can't find the options in your app?
There are three possibilities:
- You don't have the necessary license or role.
- Your administrator hasn't turned on the feature.
- Your organization is using a custom app. Check with your administrator for exact steps. The steps described in this article are specific to the out-of-the-box Sales Hub and Sales Professional apps.
See also
Configure forecasts in your organization
Events and context objects for underlying records grid
Feedback
Coming soon: Throughout 2024 we will be phasing out GitHub Issues as the feedback mechanism for content and replacing it with a new feedback system. For more information see: https://aka.ms/ContentUserFeedback.
Submit and view feedback for