Machine status scenario (preview)
[This article is prerelease documentation and is subject to change.]
The machine status scenario lets you use sensor data to monitor the availability of your equipment. If you set up a sensor that sends a signal when a production job on a machine resource produces output, but no sensor signal is received within a specified interval, a notification is shown on the supervisor's dashboard.
Scenario dependencies
The machine status scenario has the following dependencies:
- A notification can be triggered only if a production job is in progress on a mapped machine.
- A signal that represents a part-out signal must be sent to the IoT hub.
Prepare demo data for the machine status scenario
If you want to use a demo system to test the machine status scenario, use a system where the demo data is installed, select the USMF legal entity (company), and prepare the additional demo data as described in this section. If you're using your own sensors and data, you can skip this section.
Set up a sensor simulator
If you want to try this scenario without using a physical sensor, you can set up a simulator to generate the required signals. For more information, see Set up a simulated sensor for testing.
Verify that resource 3118 is used for product P0111
A production order will be scheduled and released. Therefore, a production job is released to resource 3118 (Foam cutting machine). Follow these steps to verify that resource 3118 is used for product P0111 in your demo data.
- Go to Product information management > Products > Released products.
- Find and select the product where the Item number field is set to P0111.
- On the Action Pane, on the Engineer tab, in the View group, select Route.
- On the Route page, on the Overview tab at the bottom of the page, select the line where the Oper. No. field is set to 30.
- On the Resource requirements tab at the bottom of the page, make sure that resource 3118 (Foam cutting machine) is associated with the operation.
Create and release a production order for product P0111
Follow these steps to create and release a production order for product P0111.
Go to Production control > Production orders > All production orders.
On the All production orders page, on the Action Pane, select New batch order.
In the Create batch dialog box, set the following values:
- Item number: P0111
- Quantity: 10
Select Create to create the order and return to the All production orders page.
Use the Filter field to search for production orders where the Item number field is set to P0111. Then find and select the production order that you just created.
On the Action Pane, on the Production order tab, in the Process group, select Estimate.
In the Estimate dialog box, select OK to run the estimate.
On the Action Pane, on the Production order tab, in the Process group, select Release.
In the Release dialog box, make a note of the number of the batch order that you just created.
Select OK to release the order.
Configure the production floor execution interface
You will use the production floor execution interface to start the job that was scheduled and released for item number P0111 in the previous section. Follow these steps to configure the production floor execution interface.
- Go to Production control > Manufacturing execution > Production floor execution.
- If you haven't previously set up the interface, a sign-in page appears. Enter your credentials.
- On the welcome page, select Configure to open the Configure device wizard.
- On the Configure device - Step 1 - Select configuration page, select the Default configuration.
- Select Next.
- On the Configure device - Step 2 - Define the production floor area page, set the Resource field to 3118.
- Select OK.
Enable the search option in the production floor execution interface
To make it easier to find the production job for the production order that was released earlier, follow these steps to enable the search option in the production floor execution interface.
- Go to Production control > Setup > Manufacturing execution > Configure production floor execution.
- Select the Default configuration.
- On the Action Pane, select Edit.
- On the General FastTab, set the Enable search option to Yes.
- Close the page.
Start the first job in the batch order
Follow these steps to start the job scheduled on resource 3118.
- Go to Production control > Manufacturing execution > Production floor execution.
- In the Badge ID field, enter 123. Then select Sign in.
- If you're prompted for an absence reason, select one of the cards for absence, and then select OK.
- In the Search field, enter the batch order number that you previously made a note of. Then select the Return key.
- Select the order, and then select Start job.
- In the Start job dialog box, select Start.
Set up the machine status scenario
Follow these steps to set up the machine status scenario in Supply Chain Management.
Go to Production control > Setup > Sensor Data Intelligence > Scenarios.
In the Machine status scenario box, select Configure to open the setup wizard for this scenario.
On the Sensors page, select New to add a sensor to the grid. Then set the following fields for it:
- Sensor ID – Enter the ID of the sensor that you're using. (If you're using the Raspberry PI Azure IoT Online Simulator and have set it up as described in Set up a simulated sensor for testing, enter MachineStatus.)
- Sensor description – Enter a description of the sensor.
Repeat the previous step for each additional sensor that you want to add now. You can come back and add more sensors at any time.
Select Next.
On the Business record mapping page, in the Sensors section, select the record for one of the sensors that you just added.
In the Business record mapping section, select New to add a row to the grid.
On the new row, set the Business record field to the resource that you're using the selected sensor to monitor. (If you're using the demo data that you created earlier in this article, set the field to 3118, Foam cutting machine.)
Select Next.
On the Machine status threshold page, define how long after the last part-out signal the system should send a machine status notification. There are two ways to define the threshold:
- Default threshold (minutes) – Set this field to define the default threshold. The value will then apply to all resources where the Threshold to determine machine not responding (minutes) field is set to two minutes or less. The minimum value is 2 (minutes).
- Threshold to determine machine not responding (minutes) – For each resource in the grid that you don't want to use the default threshold for, enter an override value in this field. Resources that are set to use a threshold of two minutes or less will use the Default threshold (minutes) setting instead.
Note
Typically, you will use a part-out signal to monitor machine status. Therefore, you should verify that the threshold for each machine resource is longer than the machine requires to produce each part.
Select Next.
On the Activate sensors page, in the grid, select the sensor that you added, and then select Activate. For each activated sensor in the grid, a check mark appears in the Active column.
Select Finish.
Work with the machine status scenario
After you install your sensors and configure the scenario, you can view machine status events in Supply Chain Management. This section describes where and how to view this information.
View machine status data on the Resource status page
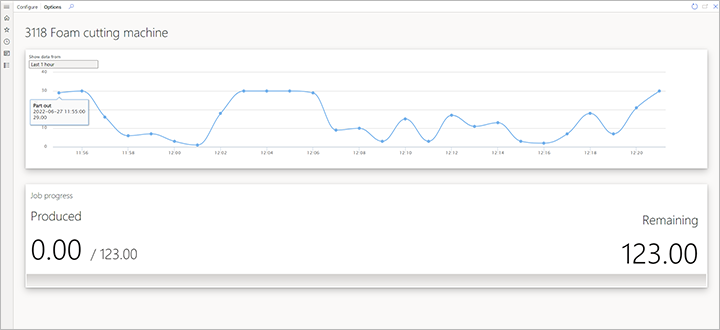
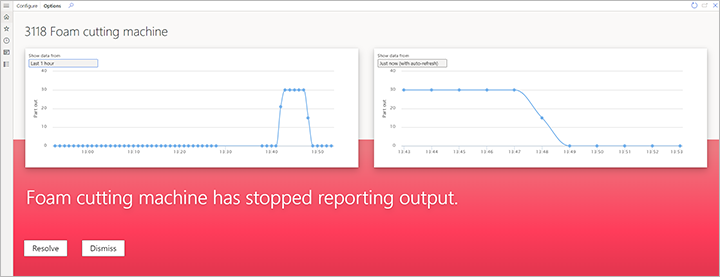
On the Resource status page, supervisors can monitor a timeline of the part-out signal that is received from the sensors that are mapped to each machine resource. Follow these steps to configure the timeline.
Go to Production control > Manufacturing execution > Resource status.
In the Configure dialog box, set the following fields:
- Resource – Select the resources that you want to monitor. (If you're working with the demo data, select 3118.)
- Time series 1 – Select the record (metric key) that has the following format for its name: MachineReportingStatus:<Sensor>
- Display name – Enter Parts out signal.
The following illustration shows an example of machine status data on the Resource status page during standard operation.

The following illustration shows an example of machine status data when downtime is detected.

View machine status on the Notifications page
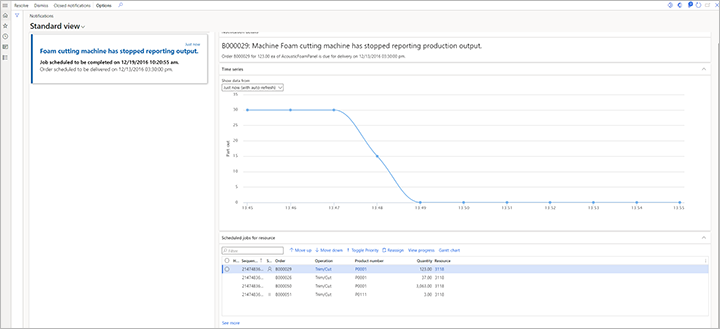
On the Notifications page, supervisors can view the notifications that are generated when too much time has passed since the sensor last delivered a part-out signal. Each notification provides an overview of the production job that is affected by the outage and gives the option to reassign the affected job to another resource.
To open the Notification page, go to Production control > Inquiries and reports > Sensor Data Intelligence > Notifications.
The following illustration shows an example of a machine status notification.

Feedback
Coming soon: Throughout 2024 we will be phasing out GitHub Issues as the feedback mechanism for content and replacing it with a new feedback system. For more information see: https://aka.ms/ContentUserFeedback.
Submit and view feedback for