Monitor Spark jobs within a notebook
The Microsoft Fabric notebook is a web-based interactive surface for developing Apache Spark jobs and conducting machine learning experiments. This article outlines how to monitor the progress of your Spark jobs, access Spark logs, receive advice within the notebook, and navigate to the Spark application detail view or Spark UI for more comprehensive monitoring information for the entire notebook.
Monitor Spark Job progress
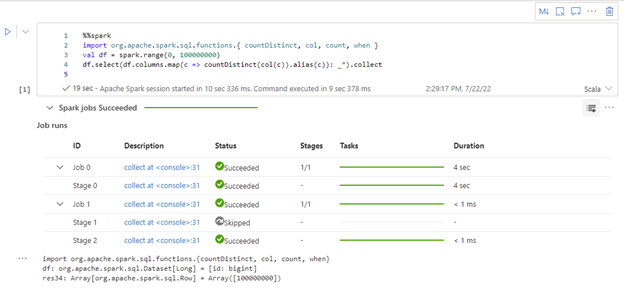
A Spark job progress indicator is provided with a real-time progress bar that helps you monitor the job execution status for each notebook cell. You can view the status and tasks' progress across your Spark jobs and stages.
Monitor Resource usage
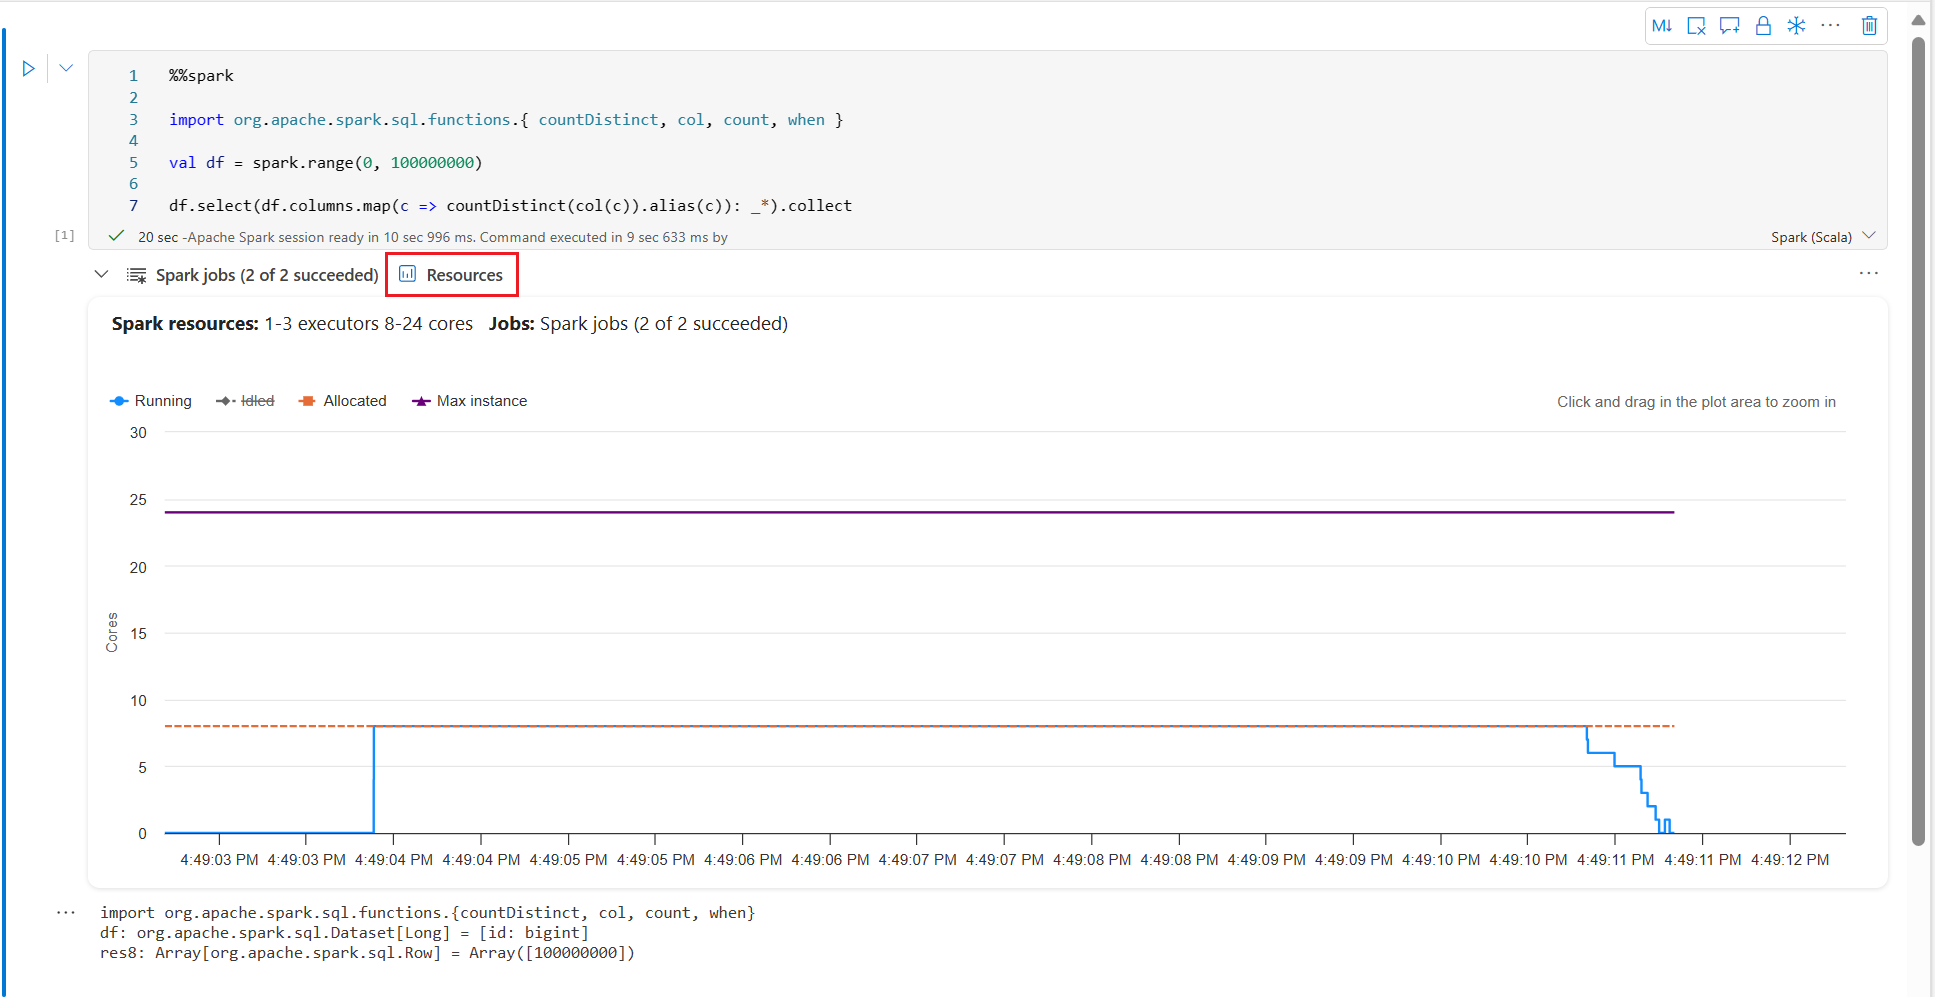
The executor usage graph visually displays the allocation of Spark job executors and resource usage. Currently, only the runtime information of spark 3.4 and above will display this feature. Click on Resources tab, the line chart for the resource usage of code cell will be showing.
View Spark Advisor recommendations
A built-in Spark advisor analyzes your notebook code and Spark executions in real-time to help optimize the running performance of your notebook and assist in debugging failures. There are three types of built-in advice: Info, Warning, and Error. The icons with numbers indicate the respective count of advice in each category (Info, Warning, and Error) generated by the Spark advisor for a particular notebook cell.
To view the advice, click the arrow at the beginning to expand and reveal the details.
After expanding the advisor section, one or more pieces of advice become visible.
Spark Advisor Skew Detection
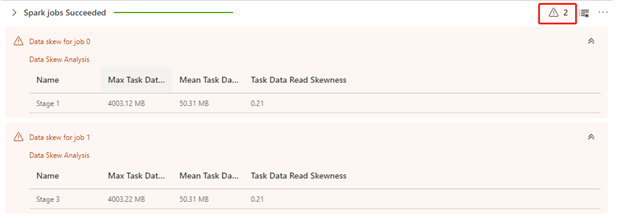
Data skew is a common issue users often encounter. The Spark advisor supports skew detection, and if skew is detected, a corresponding analysis is displayed below.
Access Spark Real-time logs
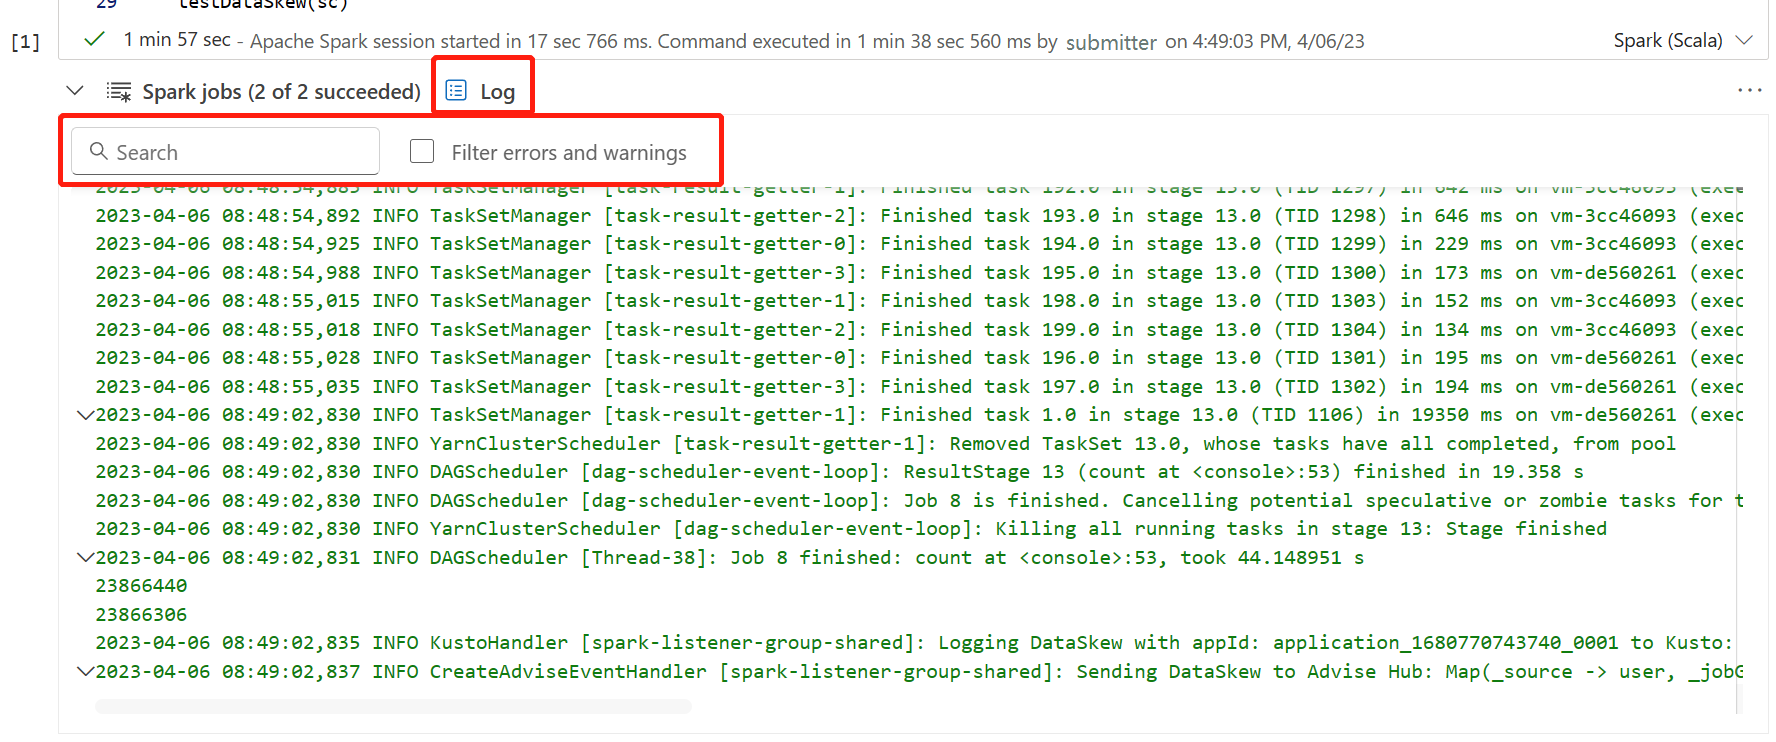
Spark logs are essential for locating exceptions and diagnosing performance or failures. The contextual monitoring feature in the notebook brings the logs directly to you for the specific cell you are running. You can search the logs or filter them by errors and warnings.
Navigate to Spark monitoring detail and Spark UI
If you want to access additional information about the Spark execution at the notebook level, you can navigate to the Spark application details page or Spark UI through the options available in the context menu.
Related content
Feedback
Coming soon: Throughout 2024 we will be phasing out GitHub Issues as the feedback mechanism for content and replacing it with a new feedback system. For more information see: https://aka.ms/ContentUserFeedback.
Submit and view feedback for


