Create an empty table
Tables are named entities that hold data. A table has an ordered set of columns, and zero or more rows of data. Each row holds one data value for each of the columns of the table. The order of rows in the table is unknown, and doesn't in general affect queries, except for some tabular operators (such as the top operator) that are inherently undetermined.
You can create an empty table without a data source to use as a testing environment, or for ingesting data in a later stage. In this article, you learn how to create an empty table within the context of a KQL database.
Prerequisites
- A workspace with a Microsoft Fabric-enabled capacity
- A KQL database with editing permissions
Create an empty table in your KQL database
Browse to your desired KQL database.
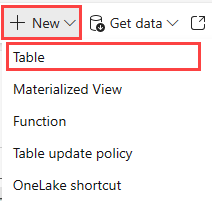
Select +New > Table.
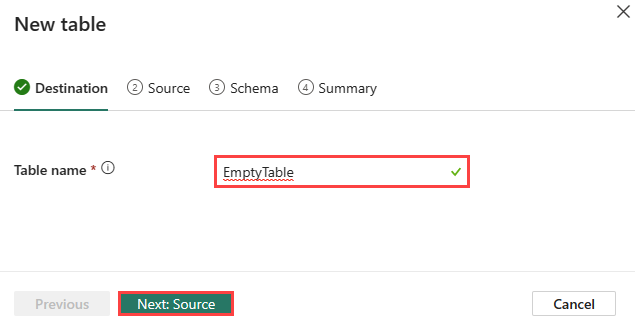
Enter a name for your table.
Note
Table names can be up to 1024 characters including alphanumeric, hyphens, and underscores. Special characters aren't supported.
Select Next: Source.
Source
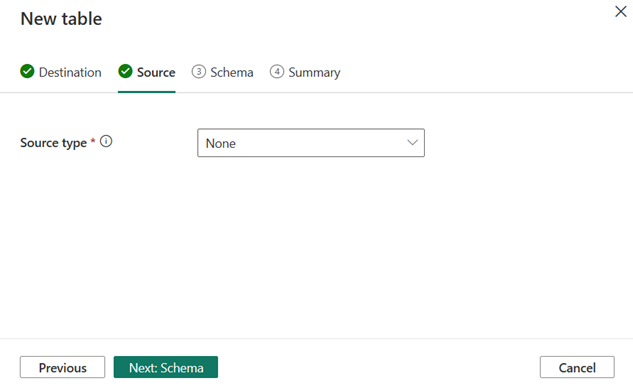
- By default, the Source type is set to None. If you select None, you can manually define the table schema.
- Select Next: Schema.
Schema
The tool automatically infers the schema based on your data. To create a schema without a data source, you need to add columns under Partial data preview.
Command viewer
The command viewer shows the commands for creating tables, mapping, and ingesting data in tables.
To open the command viewer, select the v button on the right side of the command viewer. In the command viewer, you can view and copy the automatic commands generated from your inputs.

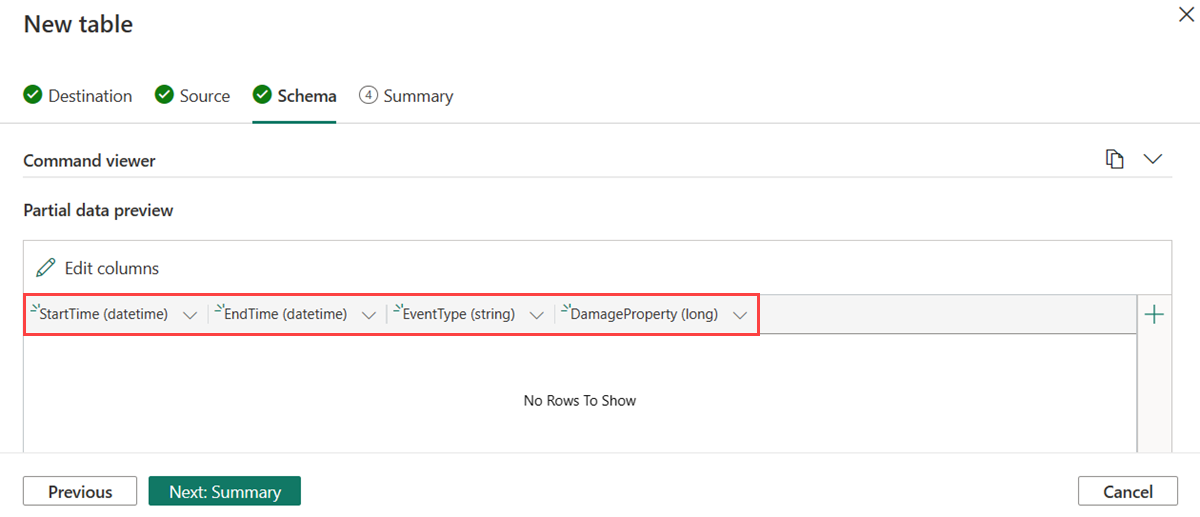
Partial data preview
The partial data preview is automatically inferred based on your data.
To add a new column, select Add new column under Partial data preview.

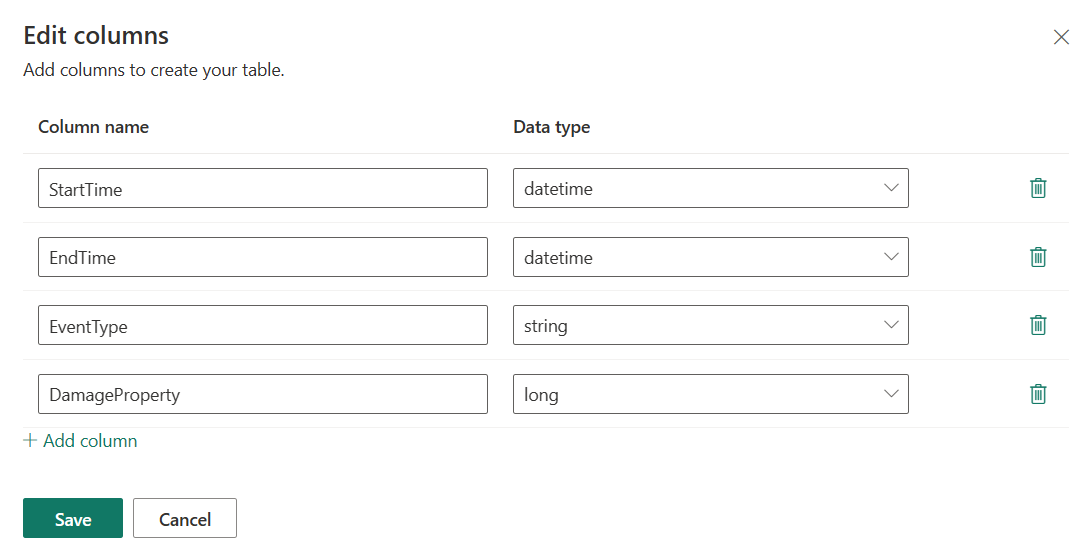
Edit columns
Enter a column name. The column name should start with a letter, and can contain numbers, periods, hyphens, or underscores.
Select a data type for your column. The default column type is
stringbut can be altered in the dropdown menu of the Column type field.Select Add column to add more columns.
Select Save to add the columns to your table.
The Partial data preview reflects the added columns:
Note
Optionally, you can edit existing columns and add new columns by selecting Edit columns or the + button on the right-hand column under Partial data preview.
Select Next: Summary to create the table mapping.


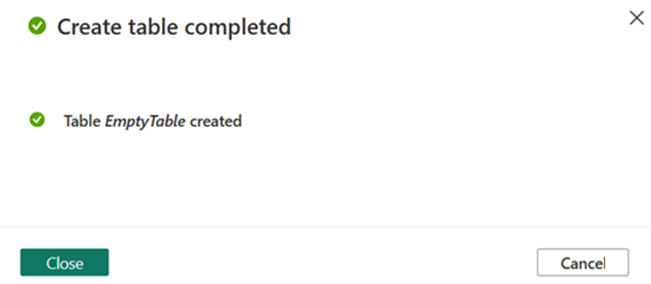
Summary tab
In the Create table completed window, the empty table is marked with a green check mark to indicate that it was created successfully.
Related content
Feedback
Coming soon: Throughout 2024 we will be phasing out GitHub Issues as the feedback mechanism for content and replacing it with a new feedback system. For more information see: https://aka.ms/ContentUserFeedback.
Submit and view feedback for