Microsoft 365 Reports in the admin center - Microsoft Teams apps usage reports
The Microsoft 365 Reports dashboard shows you the activity overview across the products in your organization. It enables you to drill in to individual product level reports to give you more granular insight about the activities within each product. Check out the Reports overview article. In the Microsoft Teams app usage report, you can gain insights into the Teams apps activity in your organization. This article explains how to access the report and view and interpret the various metrics within the report.
You can use this report to understand who is installing/using apps, and deep dive on a per-app and per-user level.
What's in the report
The Teams app usage report is available in the Microsoft 365 admin center and the data is provided through two separate reports:
App usage - This report helps you answer:
- How many apps have users in your environment installed?
- How many apps have at least one active user in your environment?
- How many apps are being used by platform (Windows, Mac, Web, or mobile)?
- How many active users and active teams are using the app?
User activity - This report helps you answer:
- How many users in your environment installed at least one app?
- How many users in your environment used at least one app?
- How many users are using an app across platforms (Windows, Mac, Web, etc.)?
- How many apps has each user used?
How to get to the Microsoft Teams apps usage report
In the admin center, go to the Reports > Usage page.
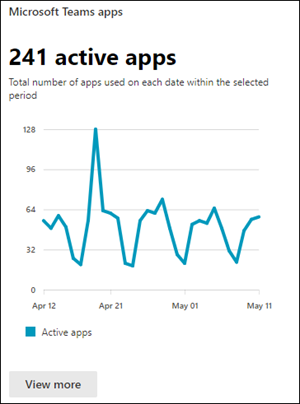
From the dashboard homepage, select the View more button on the Microsoft Teams apps activity card.
Considerations
Usage/installs data for a newly published app can take about five days to show up in the report. Data for a given day shows up within 48 hours. For example, data for January 10 should show up in the report by around January 12.
The start date for all installs metrics is October 2021. Only apps installed after that date are counted.
App IDs in this report are the External (manifest) App IDs. For more information on how to tie this ID to an app in the Manage Apps experience in Teams Admin Center, see Manage app setup policies in Microsoft Teams.
You can export the report data into an Excel .csv file by selecting the Export link. This exports data for all users/apps and enables you to do simple sorting and filtering for further analysis.
Exploring the report - App usage tab
You can view the App usage in the Teams app usage report by choosing the Apps usage tab.

On the top of the report, three charts describe cross-app trends across your organization.
- Apps installed
- Apps used
- Platform
You can filter all charts by the time range picker in the top right.
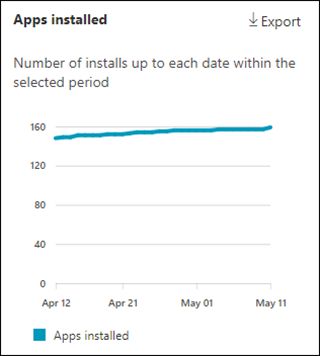
Apps installed
This chart shows you the total number of app installs across your organization up to each date within the selected period. For example – if you select January 28, 2022, the chart will show you the total number of installs from October 2021 up to January 28, 2022.
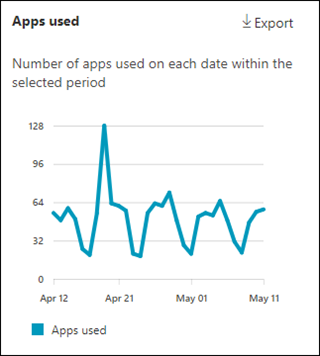
Apps used
This chart shows you the number of apps used across your organization on each date within the selected period. For example – if you select January 28, the chart will show you the total number of apps used on January 28.
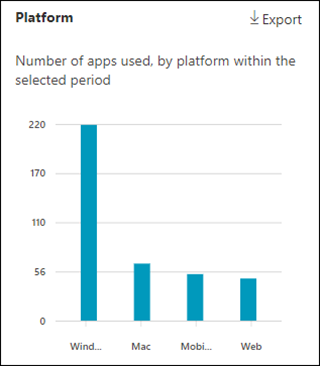
Platform
This chart shows you the number of apps used across your organization by platform for the selected period. Available platforms are Windows, Mac, Mobile (across iOS and Android), and Web.
Apps usage details table
This table shows you per-app view with the following metrics for each app. A subset of the metric columns are included by default, and you can select/edit the column list by clicking on Choose columns in the top right.

| Metric | Definition | Included by default? |
|---|---|---|
| App ID | The external App identifiers present in the app manifest. | Yes |
| Last used date | The date when that app was last used by anyone in your organization. | Yes |
| Teams using this app | The number of distinct Teams teams that have at least one user using this app. | Yes |
| Users using this app | The number of distinct users in your organization that are using this app. | Yes |
| Used on Windows | This value indicates whether that app was on Windows by at least one user in your organization. | Yes |
| Used on Mobile | This value indicates whether that app was on Mobile by at least one user in your organization. | Yes |
| Used on Web | This value indicates whether that app was used on Web by at least one user in your organization. | Yes |
| Used on Mac | The number of ad hoc meetings a user organized during the specified time period. | No |
| App name | The Name of this application as present in the app manifest. | No |
| Publisher | The publisher of this application as present in the app manifest. This metric is only available for apps published to the global Store. | No |
Exploring the report - Teams apps usage user activity tab
You can view the user activity in the Teams app usage report by choosing the User activity tab.

On the top of the report, three charts describe cross-app trends across your organization.
- Users who installed apps
- Users who used apps
- Platform
You can filter all charts by the time range picker in the top right.
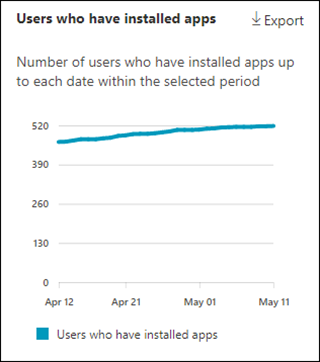
Users who have installed apps
This chart shows you the total number of unique users that have installed an app up to each date within the selected period. For example – if you select January 28, 2022 the chart will show you the total number of users from October 2021 up to January 28, 2022.
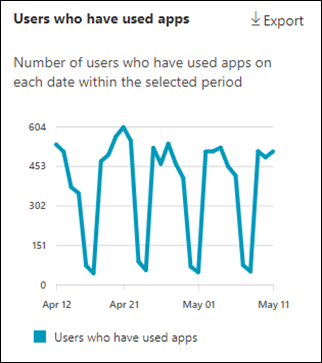
Users who have used apps
This chart shows you the number of unique users that have used any app on each date within the selected period. For example – if you select January 28, the chart will show you the total number of users on January 28.
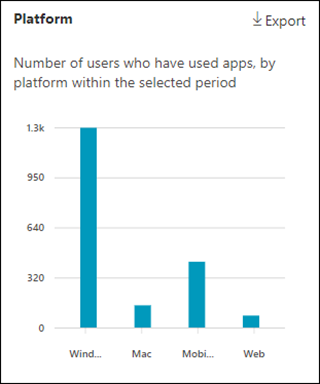
Platform
This chart shows you the number of apps used across your organization by platform for the selected period. Available platforms are Windows, Mac, Mobile (across iOS and Android), and Web.
User activity details table
This table shows you per-user view with the following metrics for each app. A subset of the metric columns are included by default, and you can select/edit the column list by clicking on Choose columns in the top right.

| Metric | Definition | Included by default? |
|---|---|---|
| User name | The User name for a unique user. Value is concealed by default. | Yes |
| Apps installed | The number of unique apps (across Store and custom) that the user has installed. | Yes |
| Apps used | The number of unique apps (across Store and custom) that the user has opened and/or used. | Yes |
| Apps used in a Team | The number of unique apps (across Store and custom) that the user has opened and/or used in a team in Microsoft Teams. | Yes |
| Used on Windows | This value indicates whether that user used any app on Windows. | Yes |
| Used on Mobile | This value indicates whether that user used any app on Mobile (iOS or Android). | Yes |
| Used on Web | This value indicates whether that user used any app on Web. | Yes |
| Used on Mac | This value indicates whether that user used any app on Mac. | No |
Managing apps in the Teams Admin Center
For more information about how to manage your Teams apps, refer to About apps in Microsoft Teams.
To link an app in this report to the Manage Apps experience in Teams Admin Center, you can use the following items:
- App Name
- External App ID
External App IDs are equivalent to the ID in the Manage apps page for Store apps. For custom apps, to view External App ID in the Manage Apps page, follow the instructions on Manage apps setup policies in Microsoft Teams to add the column in the column settings. You can also view it on the app details page for a custom app.
Feedback
Coming soon: Throughout 2024 we will be phasing out GitHub Issues as the feedback mechanism for content and replacing it with a new feedback system. For more information see: https://aka.ms/ContentUserFeedback.
Submit and view feedback for