Microsoft 365 network provider assessments.
Microsoft measures network performance and availability between client applications on user machines and Microsoft's network.
Network performance
Read about the network performance assessment calculation method at Microsoft 365 network assessment.
Network availability
The reliability of Microsoft 365 services as experienced by the client is shown by the network availability metric. It's measured as the length of time that Exchange and SharePoint are working, and for Microsoft Teams as a proportion of calls that connected successfully both expressed as a percentage.
Exchange and SharePoint Network availability
Exchange and Sharepoint availability are the proportion of minutes without any major user errors out of the total user minutes. This is how it's calculated:
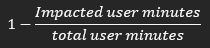
We receive notification of unsuccessful connections after network connectivity is restored.
Teams Network availability
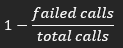
By using telemetry data from the actual calls, Microsoft Teams availability is computed as a percentage of calls that failed compared to total calls. This is how it's calculated:
Detecting network providers
Network providers are detected from network attributes in Office 365 network telemetry. Network attributes that may be used for detection include:
- Public IP Address ownership
- Public ASN ownership
- VPN network interface details
- SSL Certificate ownership
Specific network attributes for a network provider solution are either obtained from public sources, from Microsoft network telemetry, or contributed to Microsoft by the network provider.
When a network provider solution is detected on network telemetry the Office 365 measured performance and availability from that connection is attributed to the network provider and aggregated. This isn't intended to represent the network provider but rather represents Office 365 performance and availability experienced by users as attributed to detected network providers.
Calculation of standard error of sampling
What if you don't see the exact same measurement as our aggregation? Our aggregation of network telemetry is sample based and this sample represents the complete possible population of network connections that may be made. We calculate the standard error of sampling and present it along with results. If this error is greater than 20% or there are fewer than 24 samples, then we don't show the result, but instead show an error marker in the data field.
The formula used for the standard error is:
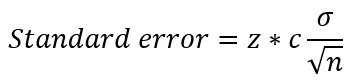
Where:
- z is the statistical coefficient and for 95% confidence interval the value is 1.96
- c is the error coefficient for the percentile and for the 50th percentile it's 1.09
- σ is the standard deviation of the aggregation
- n is the number of samples
Data aggregation slicing
For customer specific reporting the aggregations are sliced by the customer and by detected network provider and by work location type. They're also sliced by office location for drill-down capability. For the NPI Chart views including Target Baseline metrics are aggregations sliced by network provider and by country/region and state. The NPI Chart data is aggregated from all Office 365 customers.
For network providers the aggregations are sliced by network provider, by geography (including country/region, state, and city), and by /24 public network.
Data aggregation statistical evaluations
There are some markers we show where data can't be reported.
- Statistical significance – As described above we don't show data where the standard error of sampling is greater than 20%.
- No data – This is displayed if for some reason this data element had no samples.
- Privacy requirement – This is displayed for the network provider view if there were fewer than five customers in any aggregation result or if there were fewer than 24 samples in the aggregation. We don't provide customer performance data directly to network providers for customer privacy reasons.
- Dominating customer – Even where there are five or more customers, there might be cases where a customer can be guessed due to the specific network provider having a large customer in a geographic area. To avoid this, we compare the population including the largest customer with the same population excluding the largest customer. Using a Cohen's D calculation, we discard results where the population difference is greater than 0.5. This means that where the largest customer has a medium to large Cohen's D effect on the aggregation result the result is blocked. A network provider simply needs to expand their geographic area where they have more customers to see results.
The markers Privacy requirement and Dominating customer aren't shown in customer reports. In addition, we remove outliers from the sample source where outliers are defined as:

Network providers will additionally not be shown in a tenant or location view if that network provider accounts for fewer than 0.01% of users represented in that view.
Network Provider Index Chart
The NPI Chart shows the network providers with the highest performance for Office 365 applications for customers who are in the same country/region and state as your office. We show availability and performance data related to these providers. This chart also has a target baseline that shows the best performance observed in the same country/region and state.
Note: NPI Chart is currently available only for United States of America. The chart will be expanded soon to all locations globally.
Related articles
Network connectivity in the Microsoft 365 Admin Center
Microsoft 365 network assessment
Feedback
Coming soon: Throughout 2024 we will be phasing out GitHub Issues as the feedback mechanism for content and replacing it with a new feedback system. For more information see: https://aka.ms/ContentUserFeedback.
Submit and view feedback for