View the resource files that make up a webpage
You can view the resources that make up a web page from within several tools (or panels) in Microsoft Edge DevTools, including:
- Network tool
- Sources tool
- Application tool
Resources are the files that make up a webpage. Examples of resources include:
- CSS files
- JavaScript files
- HTML files
- Image files
See also:
- Learn web development at Mozilla.org
- Overview of DevTools
Open resource files from the Command Menu
When you know the name of a webpage's resource file that you want to inspect, the Command Menu in DevTools provides a fast way of finding and opening that resource.
In a new window or tab, go to a webpage, such as the Accessibility-testing features demo. (The source files for that webpage are at MicrosoftEdge / Demos > devtools-a11y-testing.)
To open DevTools, right-click the webpage, and then select Inspect. Or press Ctrl+Shift+I (Windows, Linux) or Command+Option+I (macOS).
When DevTools has focus, press Ctrl+P (Windows, Linux) or Command+P (macOS). Or, click the Customize and control DevTools (
 ) button in DevTools and then select Open file. The Command Menu opens, displaying the Open File list:
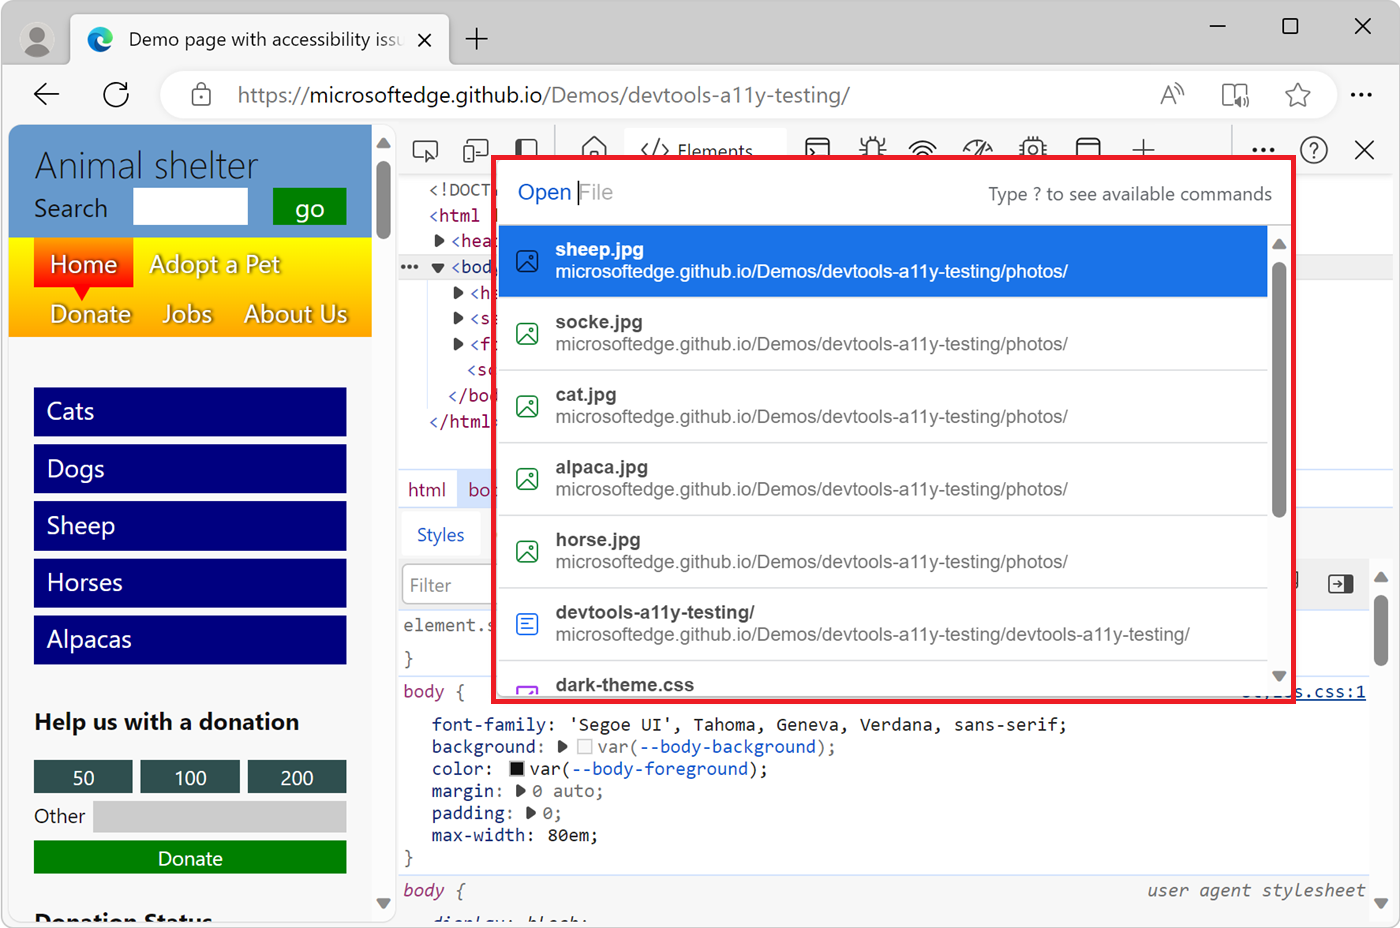
If there's a greater-than (>) prompt, press Backspace to get to the Open File prompt.
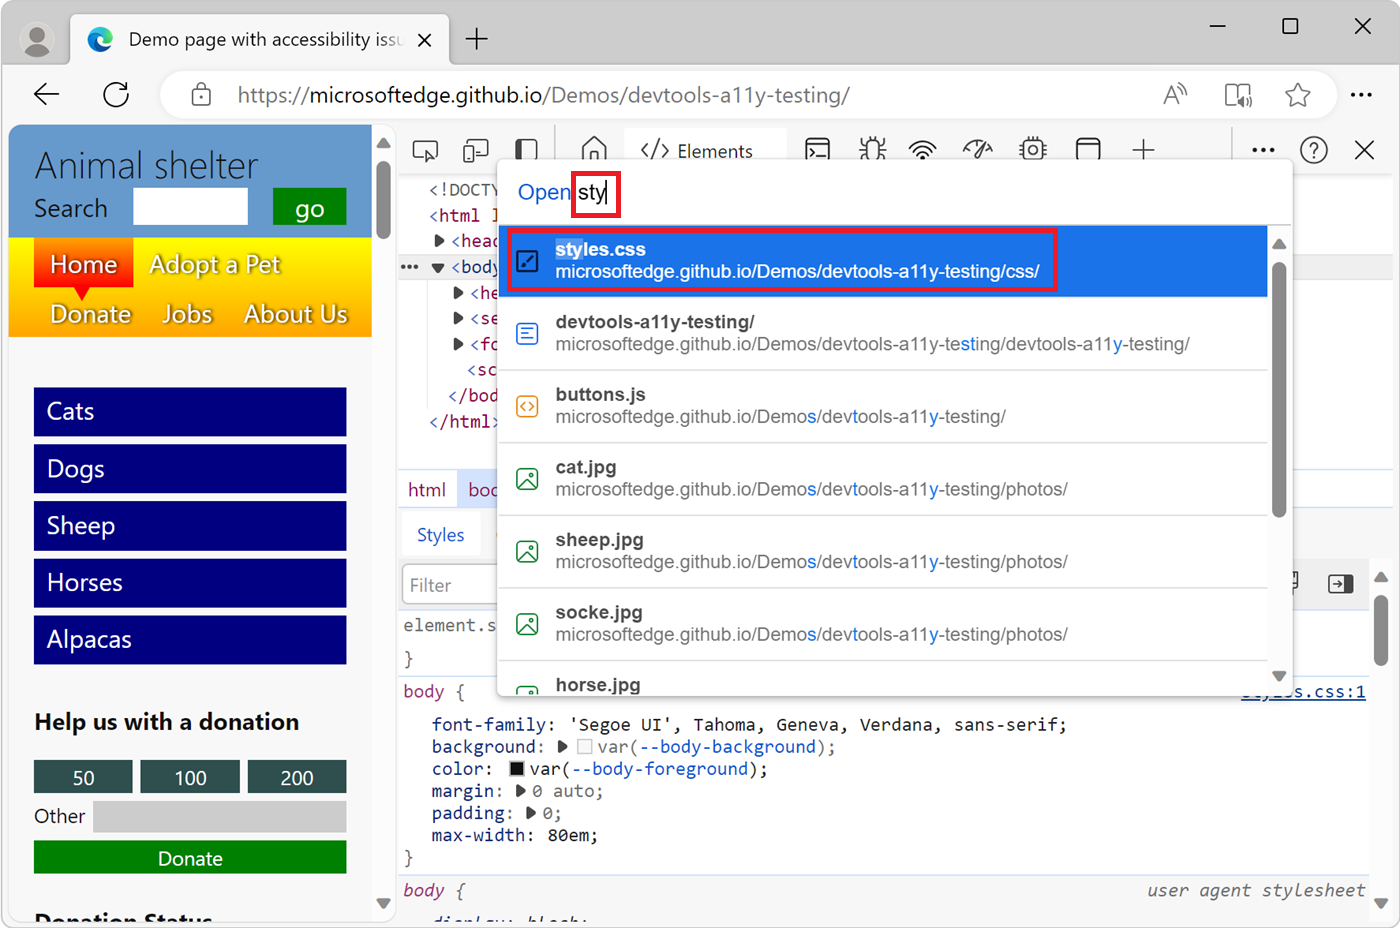
Start typing the file name, and then press Enter when the correct file is highlighted in the autocomplete box, or select the file from the dropdown list:
Browse resource files in the Network tool
In the Network tool, you can inspect the resource files that make up the current webpage, such as .html, .css, .js, and image files. To learn how to get the details for a specific resource, see Inspect the details of the resource in Inspect network activity.
In a new window or tab, go to a webpage, such as the Inspect Network Activity Demo. (The source files for that webpage are at MicrosoftEdge / Demos > network-tutorial.)
To open DevTools, right-click the webpage, and then select Inspect. Or, press Ctrl+Shift+I (Windows, Linux) or Command+Option+I (macOS). DevTools opens.
In DevTools, on the Activity Bar, select the Network tab. If that tab isn't visible, click the More Tools (
 ) button.
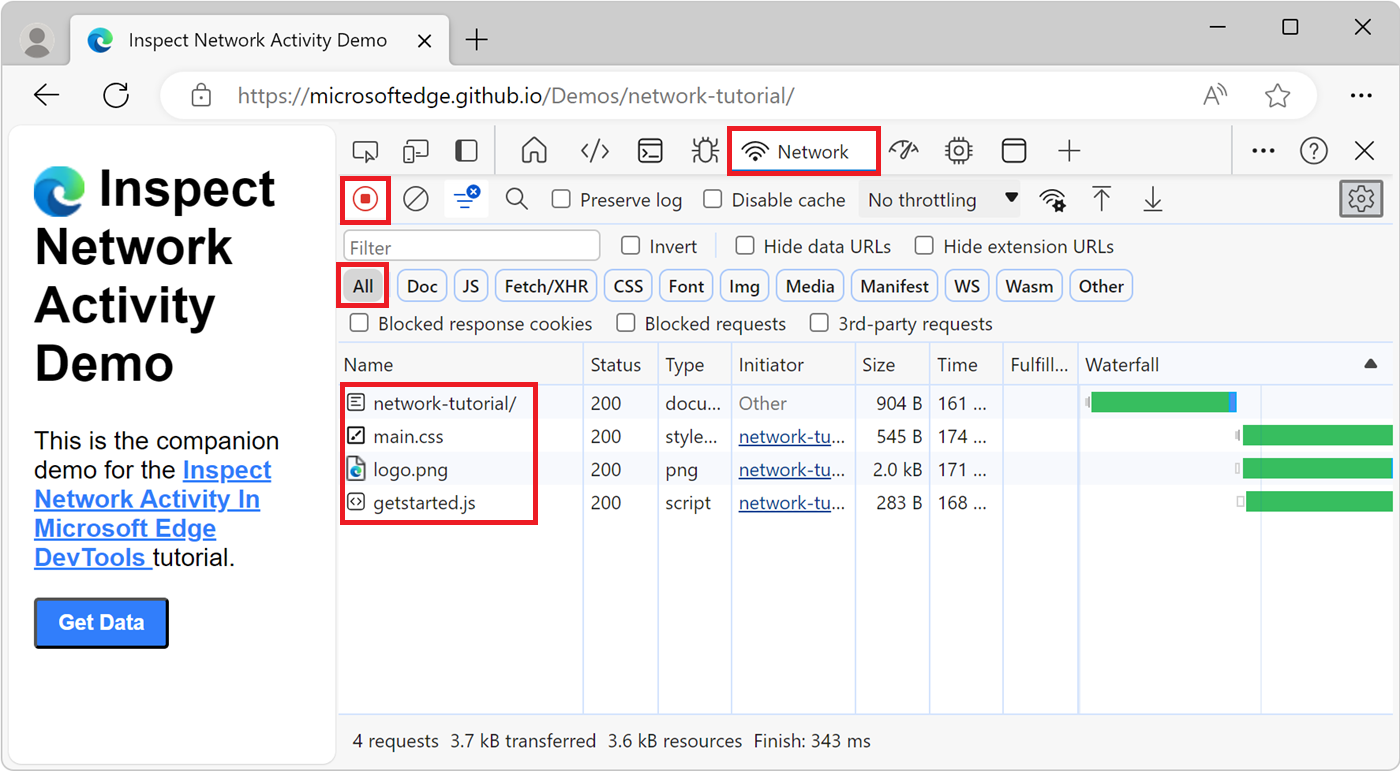
Make sure the Record network log button in the upper left is selected (red).
Refresh the page. By default, the All filter button is selected, so all the webpage's resource files are listed in the Network tool, one row per resource file:
Select a resource to view it. For example, select the
network-tutorialpath to displayindex.html: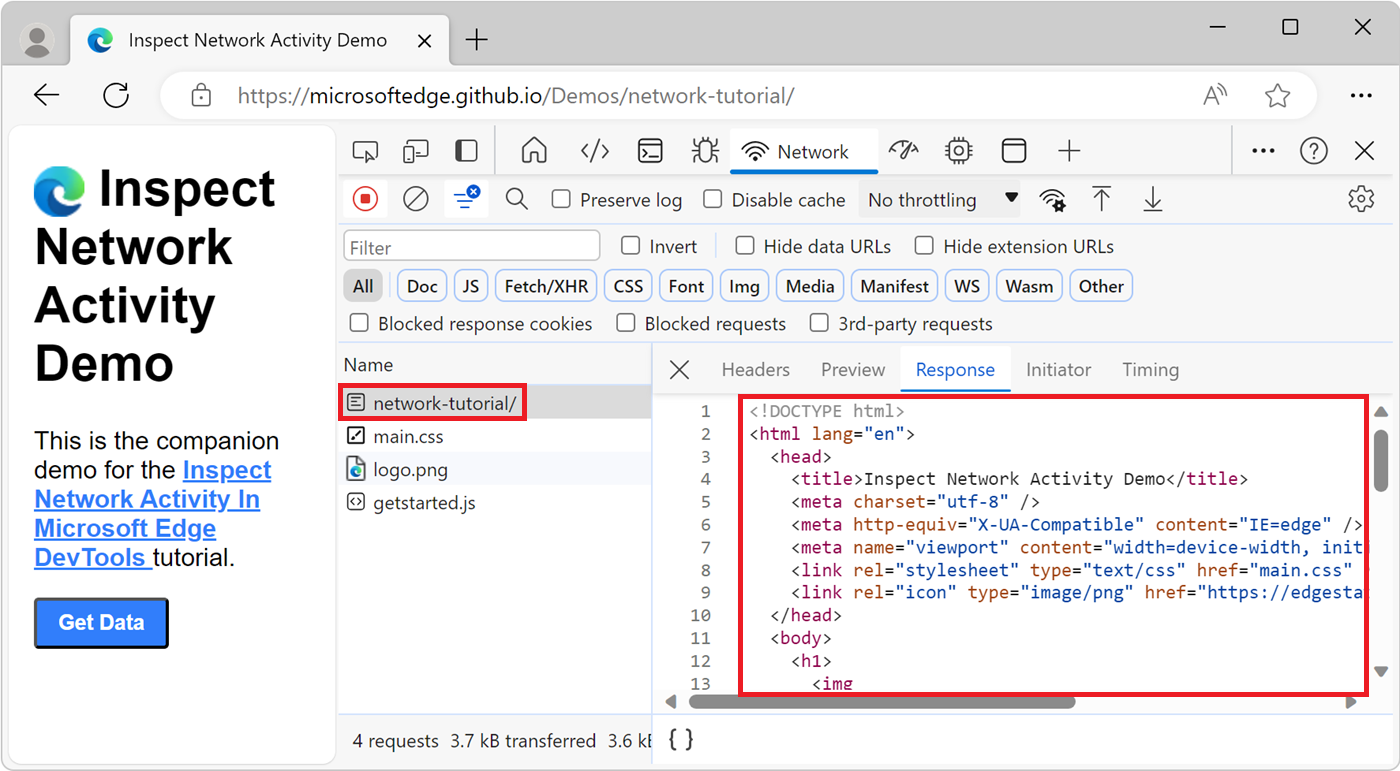
To learn more about how to show the network activity that's generated by the page resources, see Log network activity in the article Inspect network activity.
Browse resource files by file type by filtering in the Network tool
In the Network tool, when you view the list of resource files that make up the current webpage, you can filter which type of resources to list, such as only showing .css or .js files.
For example, to only display CSS files:
In a new window or tab, go to a webpage, such as the Inspect Network Activity Demo. (The source files for that webpage are at MicrosoftEdge / Demos > network-tutorial.)
To open DevTools, right-click the webpage, and then select Inspect. Or, press Ctrl+Shift+I (Windows, Linux) or Command+Option+I (macOS). DevTools opens.
In DevTools, on the Activity Bar, select the Network tab. If that tab isn't visible, click the More Tools (
) button.Refresh the page. By default, the All filter button is selected, so all the webpage's resource files are listed in the Network tool.
Click CSS to filter and only display CSS files. Only the
main.cssfile is listed: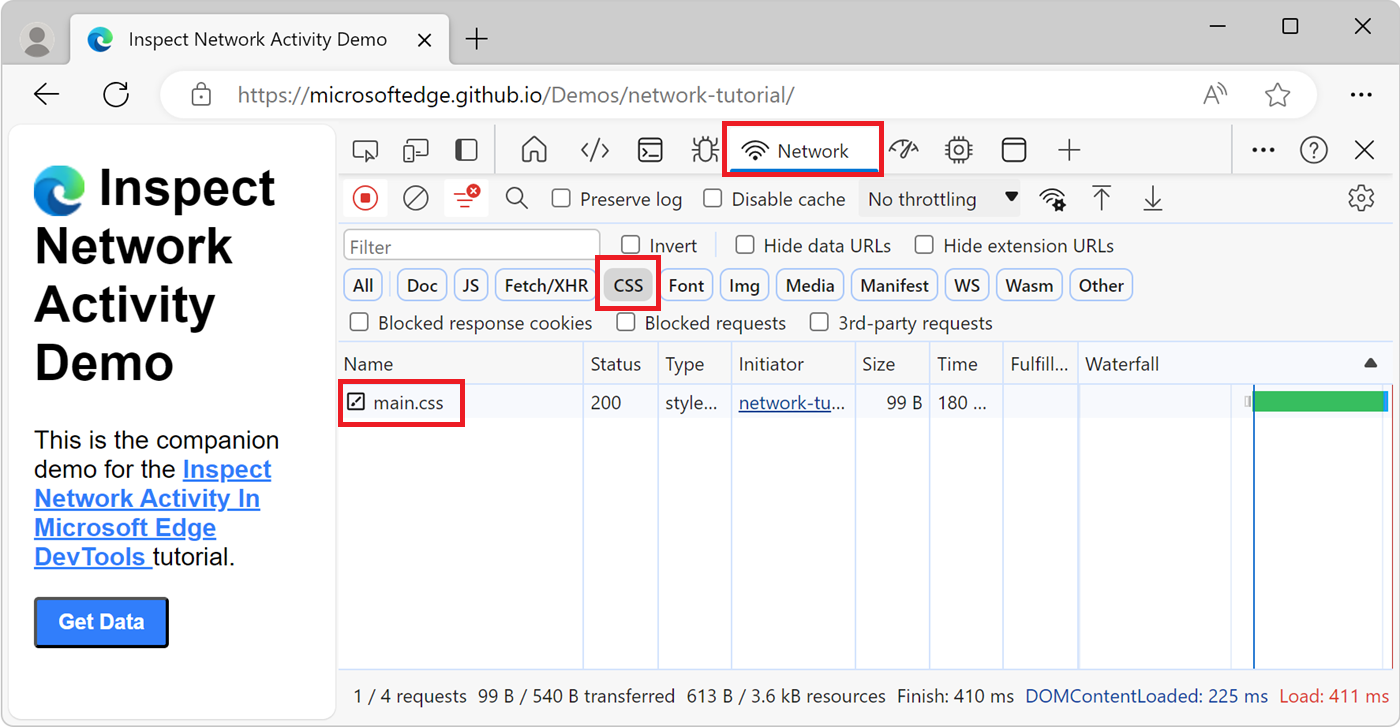
For more information, see Filter by resource type in Inspect network activity.
Show resource files in the Network tool from other tools
In various tools that list resource files for the webpage, to inspect a resource file in the Network tool, right-click the resource file and then select Reveal in Network panel. You may need to first refresh the webpage while the Network tool is open.
For example, to go from the Page tab's resource list in the Sources tool to the Network tool:
In a new window or tab, go to a webpage, such as the Inspect Network Activity Demo. (The source files for that webpage are at MicrosoftEdge / Demos > network-tutorial.)
To open DevTools, right-click the webpage, and then select Inspect. Or, press Ctrl+Shift+I (Windows, Linux) or Command+Option+I (macOS). DevTools opens.
In DevTools, on the Activity Bar, select the Network tab. If that tab isn't visible, click the More Tools (
) button.Press Ctrl+R to refresh the page. The received resource files that make up the webpage are now added as rows in the Network tab. The network-tutorial/ folder row represents the HTML page - in this case, index.html.
In DevTools, on the Activity Bar, click the Sources tab.
In the Page tab in the upper left, right-click a resource file, and then select Reveal in Network panel:
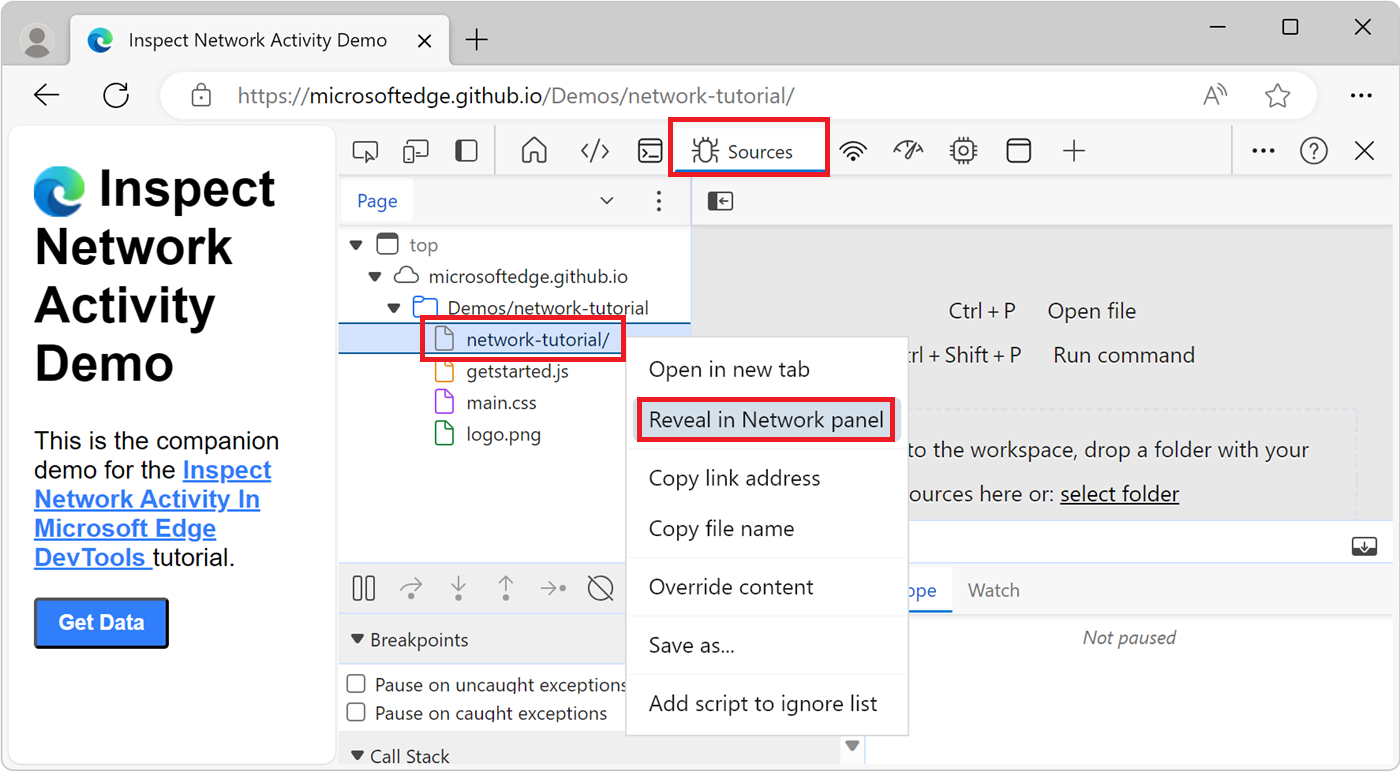
If the Reveal in Network panel menuitem isn't listed, go to the Network tool, make sure the Record network log button in the upper left is selected (red), and then refresh the page.
Browse resource files by folder in the Page tab of the Sources tool
You can use the Sources tool to view the webpage's resource files organized by directory, as follows:
To open DevTools, right-click the webpage, and then select Inspect. Or, press Ctrl+Shift+I (Windows, Linux) or Command+Option+I (macOS). DevTools opens.
In DevTools, on the Activity Bar, select the Sources tab. If that tab isn't visible, click the More tools (
) button.In the Navigator pane in the upper left, select the Page tab.
By default, resource files are grouped by folder. If the resources are all listed alphabetically by file name instead, click the More options (
 ) button to the right of the Page tab, and then select Group by folder:
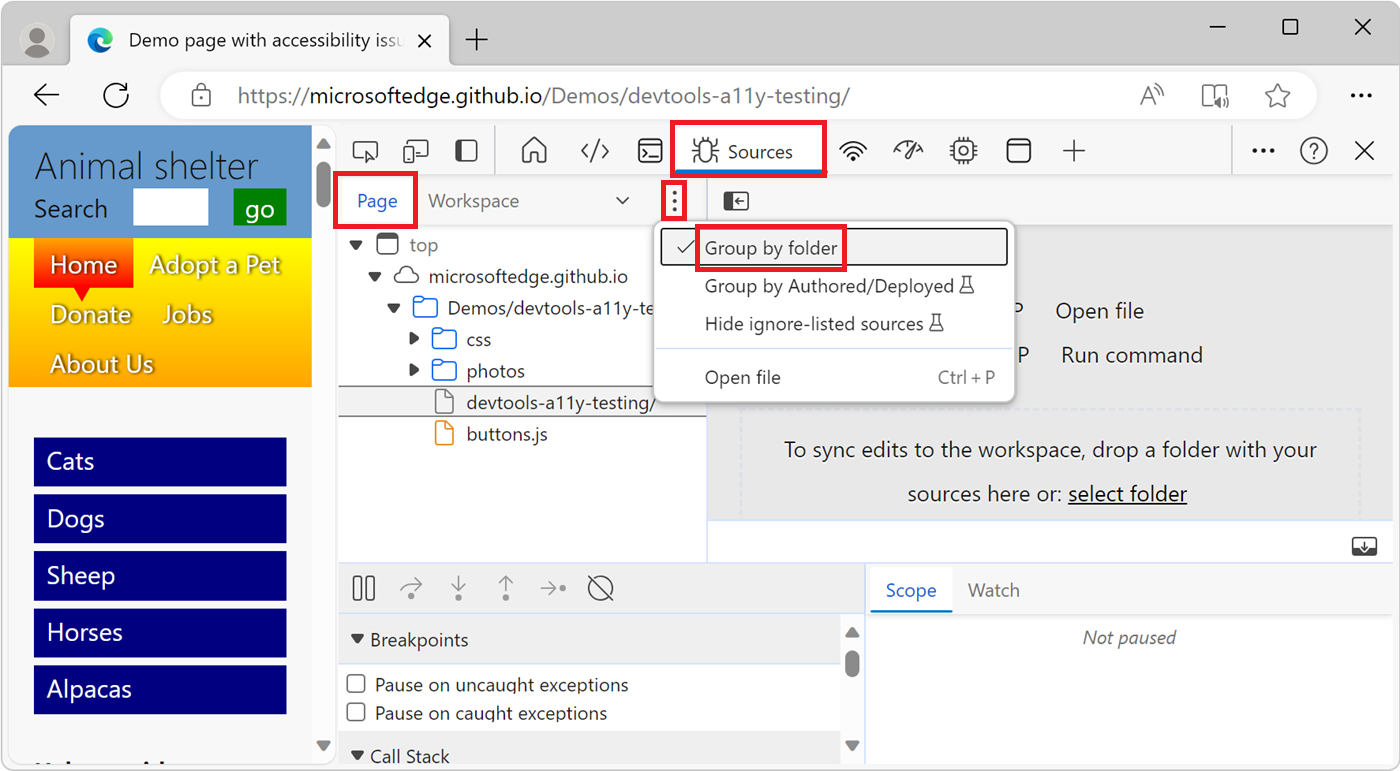
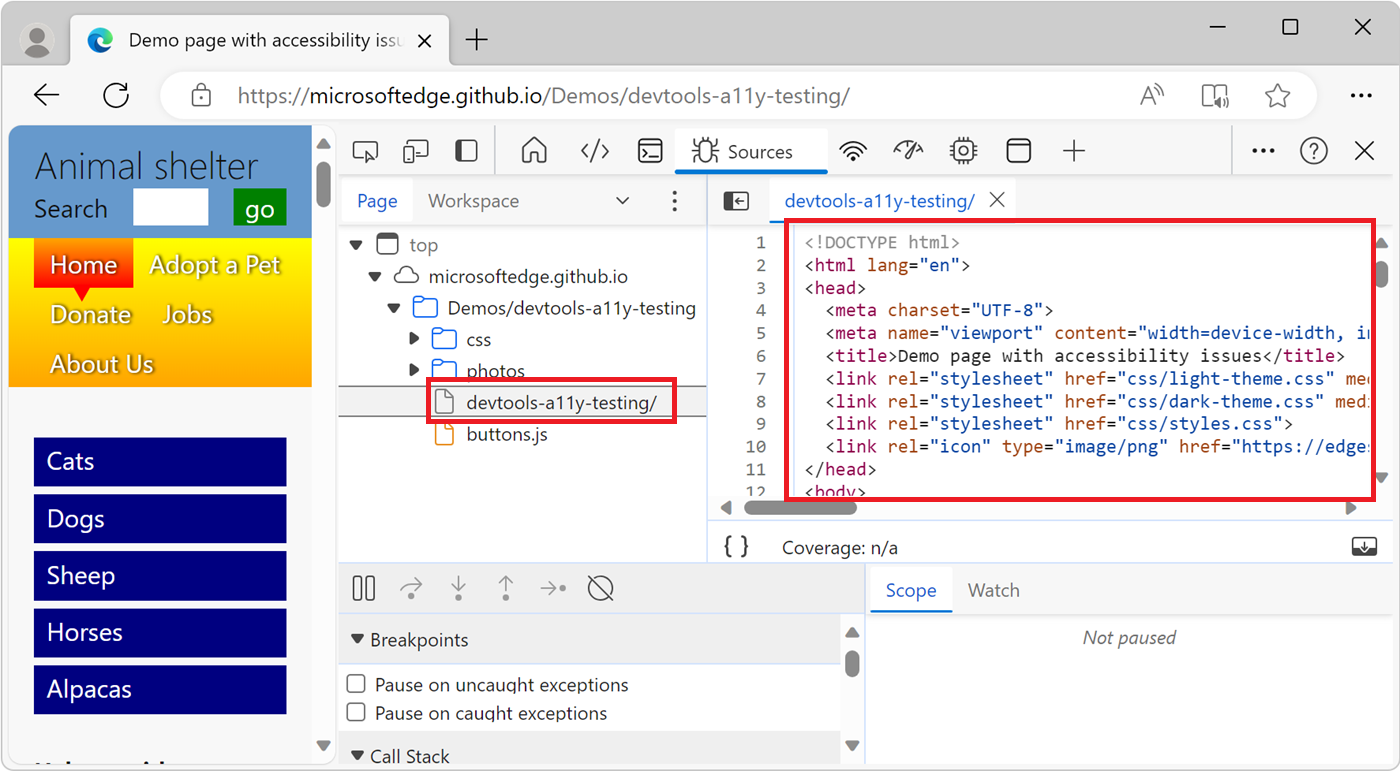
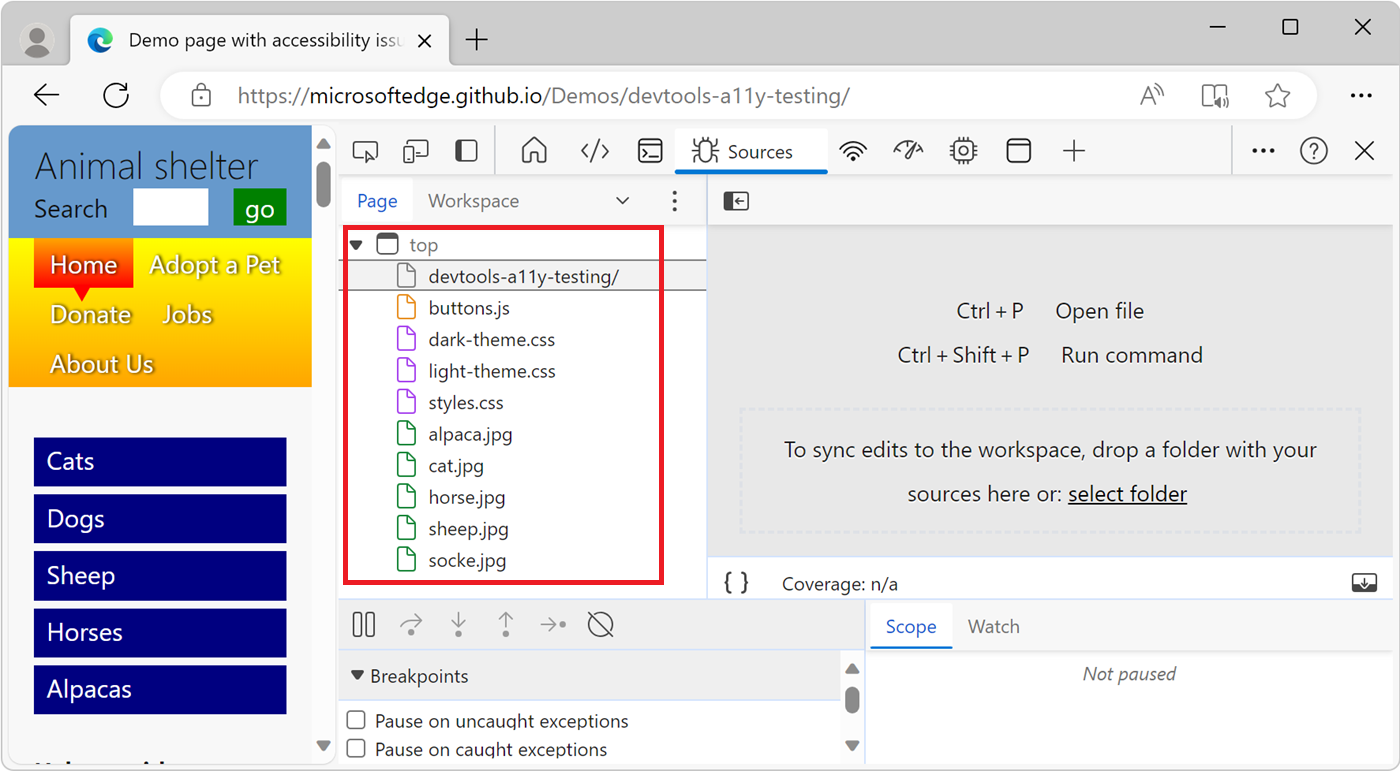
The Page tab contains various node types, including:
Page item Description topThe main document browsing context, such as a browser tab, a browser window, or a frame. See Browsing context or <iframe>: The Inline Frame element. microsoftedge.github.ioThe domain. All resources nested under it come from that domain. For example, the full URL of the buttons.jsfile is https://microsoftedge.github.io/Demos/devtools-a11y-testing/buttons.js.Demos/devtools-a11y-testing,css,photosDirectories. devtools-a11y-testing/The main HTML document. buttons.jsA script to handle button presses on the page. Select a resource file to view it in the Editor of the Sources tool:
Browse resource files sorted by file name in the Page tab of the Sources tool
By default, the Page tab in the Sources tool groups resource files by folder. To instead display all the resource files for each domain grouped together in a single alphabetized list:
In a new window or tab, go to a webpage, such as the Accessibility-testing features demo. (The source files for that webpage are at MicrosoftEdge / Demos > devtools-a11y-testing.)
To open DevTools, right-click the webpage, and then select Inspect. Or, press Ctrl+Shift+I (Windows, Linux) or Command+Option+I (macOS). DevTools opens.
In DevTools, on the Activity Bar, select the Sources tab. If that tab isn't visible, click the More tools (
) button.In the Navigator pane in the upper left, select the Page tab.
Click More options (
) and then clear the Group by folder option:
All the resource files for each domain (such as Top) are grouped together in a single alphabetized list:
Browse resource files by file type in the Frames tree in the Application tool
One way to view webpage resources grouped by file type is by using the Frames tree in the Application tool:
To open DevTools, right-click the webpage, and then select Inspect. Or, press Ctrl+Shift+I (Windows, Linux) or Command+Option+I (macOS). DevTools opens.
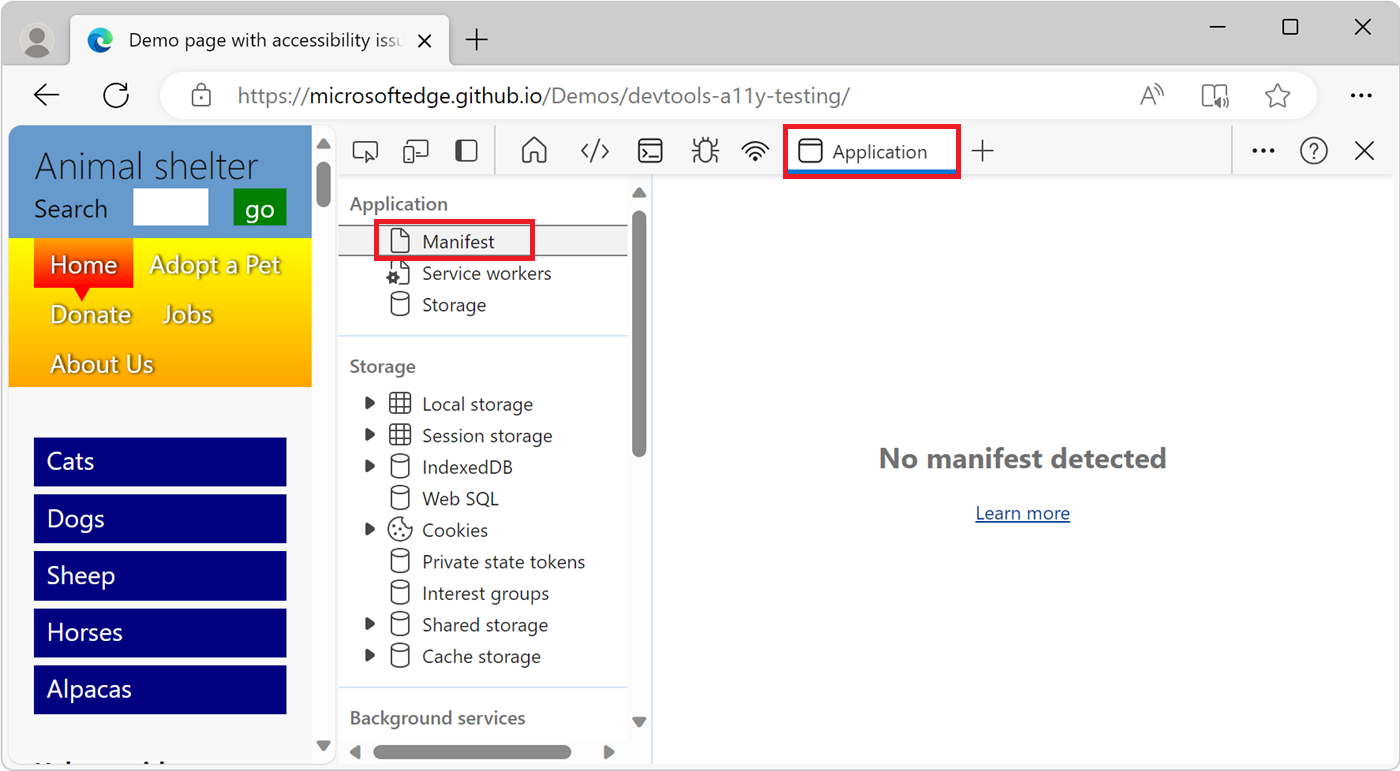
In DevTools, on the Activity Bar, select the Application tab. If that tab isn't visible, click the More Tools (
) button.The Application tool opens and by default shows the Manifest pane first:
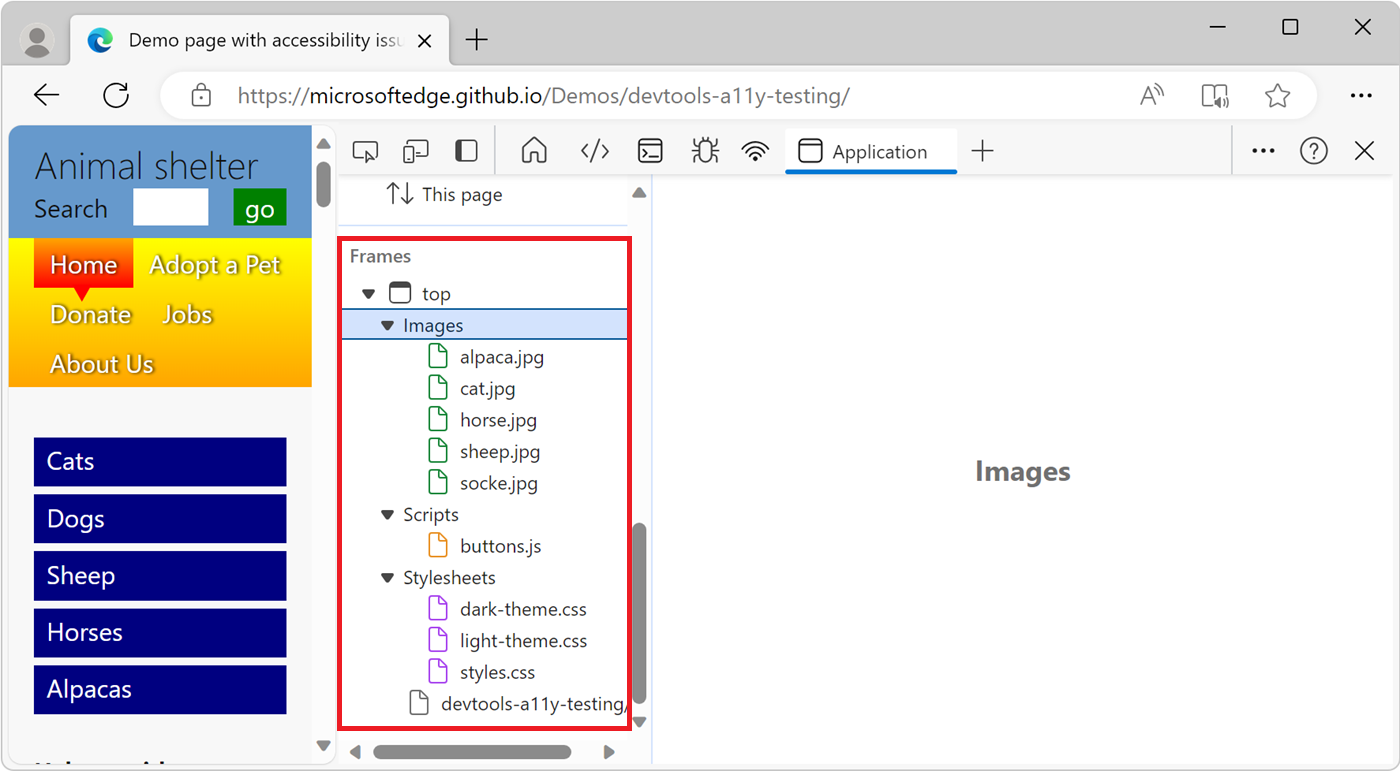
Scroll down to the Frames pane and then expand the folder that you're interested in:
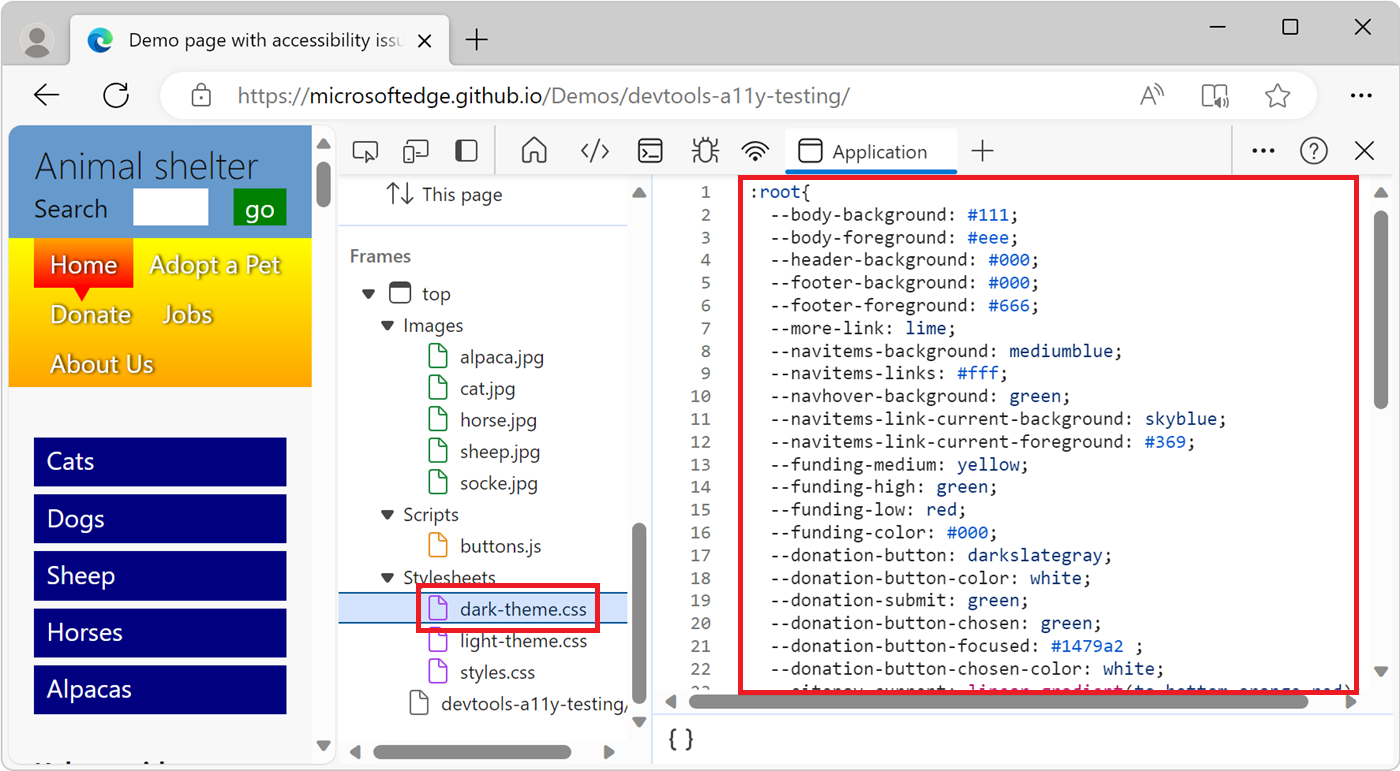
Select a resource to view it in the Application tool:
Note
Portions of this page are modifications based on work created and shared by Google and used according to terms described in the Creative Commons Attribution 4.0 International License. The original page is found here and is authored by Kayce Basques (Technical Writer, Chrome DevTools & Lighthouse).
![]() This work is licensed under a Creative Commons Attribution 4.0 International License.
This work is licensed under a Creative Commons Attribution 4.0 International License.
Feedback
Coming soon: Throughout 2024 we will be phasing out GitHub Issues as the feedback mechanism for content and replacing it with a new feedback system. For more information see: https://aka.ms/ContentUserFeedback.
Submit and view feedback for