What's New in DevTools (Microsoft Edge 98)
To check out the latest features of Microsoft Edge DevTools and the Microsoft Edge DevTools extension for Microsoft Visual Studio Code and Visual Studio, read these announcements.
To stay up to date and get the latest DevTools features, download an Insiders preview version of Microsoft Edge. Whether you're on Windows, Linux, or macOS, consider using Canary (or another preview channel) as your default development browser. The Beta, Dev, and Canary versions of Microsoft Edge run as separate apps, side-by-side with the stable, released version of Microsoft Edge. See Microsoft Edge Insider Channels.
For the latest announcements, follow the Microsoft Edge team on Twitter. To report a problem with DevTools or ask for a new feature, file an issue in the MicrosoftEdge/DevTools repo.
Catch up on the latest and greatest features in Microsoft Edge
In 2021, developer tooling for Microsoft Edge has taken a massive leap forward. Visual Studio Code, DevTools, and the browser now provide several integrated workflows for JavaScript debugging, mirroring CSS changes, and screencasting from the browser. Between Focus Mode, support for Visual Studio Code themes, and further customization options, the Microsoft Edge team is working to make the DevTools easier and simpler to use.
Catch up on all of this news and more in our year-in-review blog post, Looking back at Microsoft Edge for developers in 2021.
Automate IE mode with Internet Explorer Driver
Starting June 15, 2022, Internet Explorer 11 will no longer be supported on certain versions of Windows 10. IE mode is a feature of Microsoft Edge for organizations that still need Internet Explorer 11 for compatibility with legacy websites or apps. To support testing of those legacy websites and apps, you can now automate IE mode with Selenium 4 and Internet Explorer Driver.
See also:
Emulate forced-colors mode
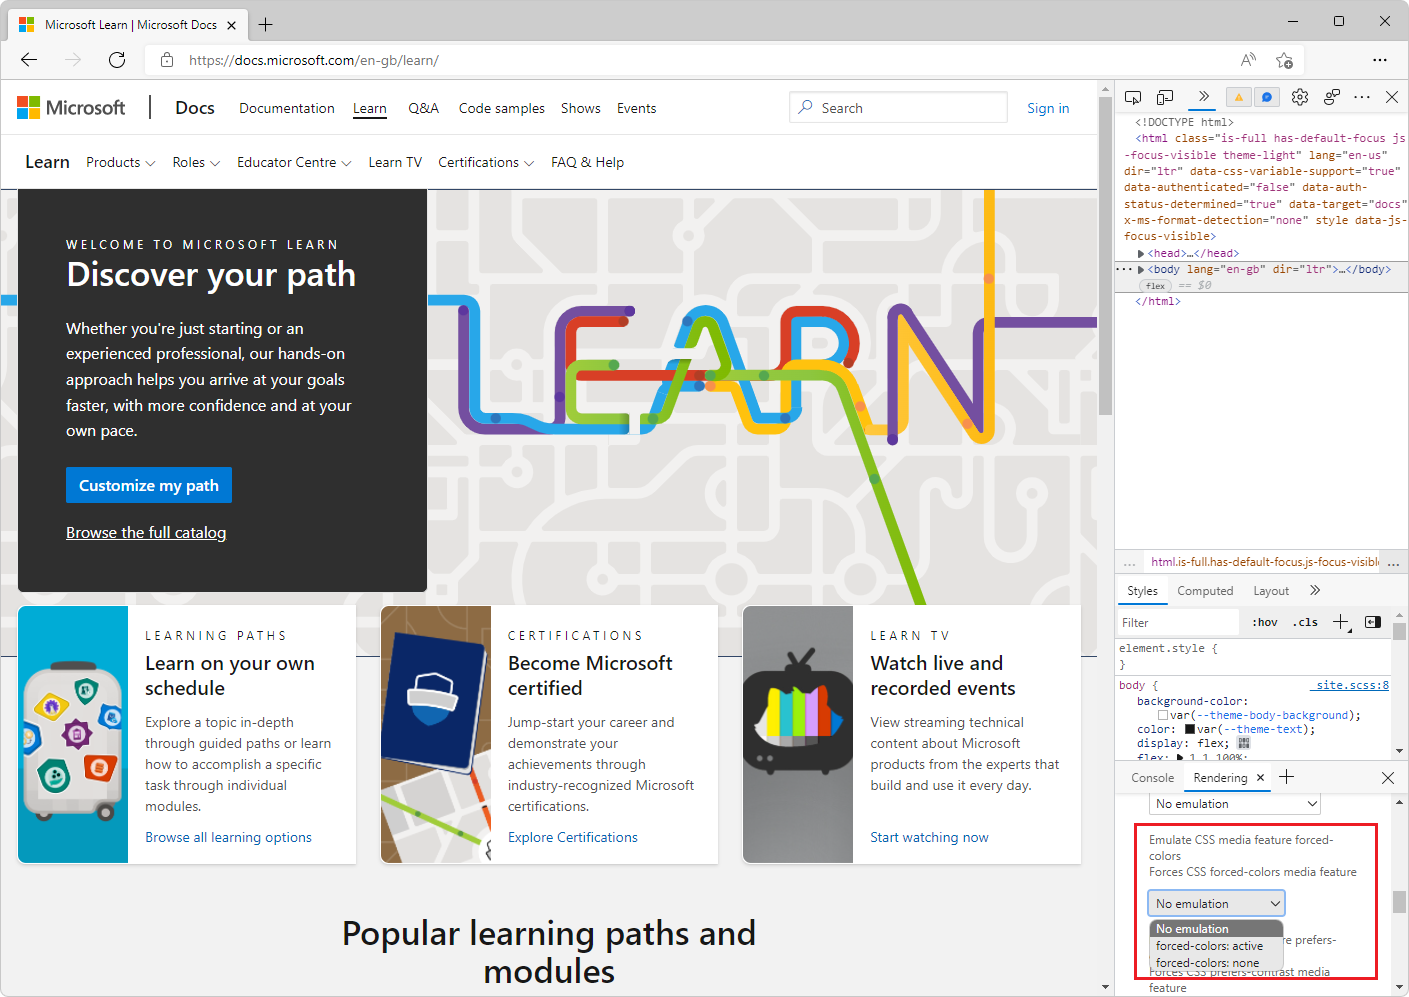
In addition to emulating dark, light, and print mode for the current webpage, now you can also see what your webpage looks like for users who have forced-colors mode enabled. Forced-colors mode is an accessibility feature of the operating system. It forces colors on the webpage to be reduced to a limited color palette, such as Windows High Contrast mode. Emulation of forced-colors mode allows you to do a spot check without having to change your own system's settings.
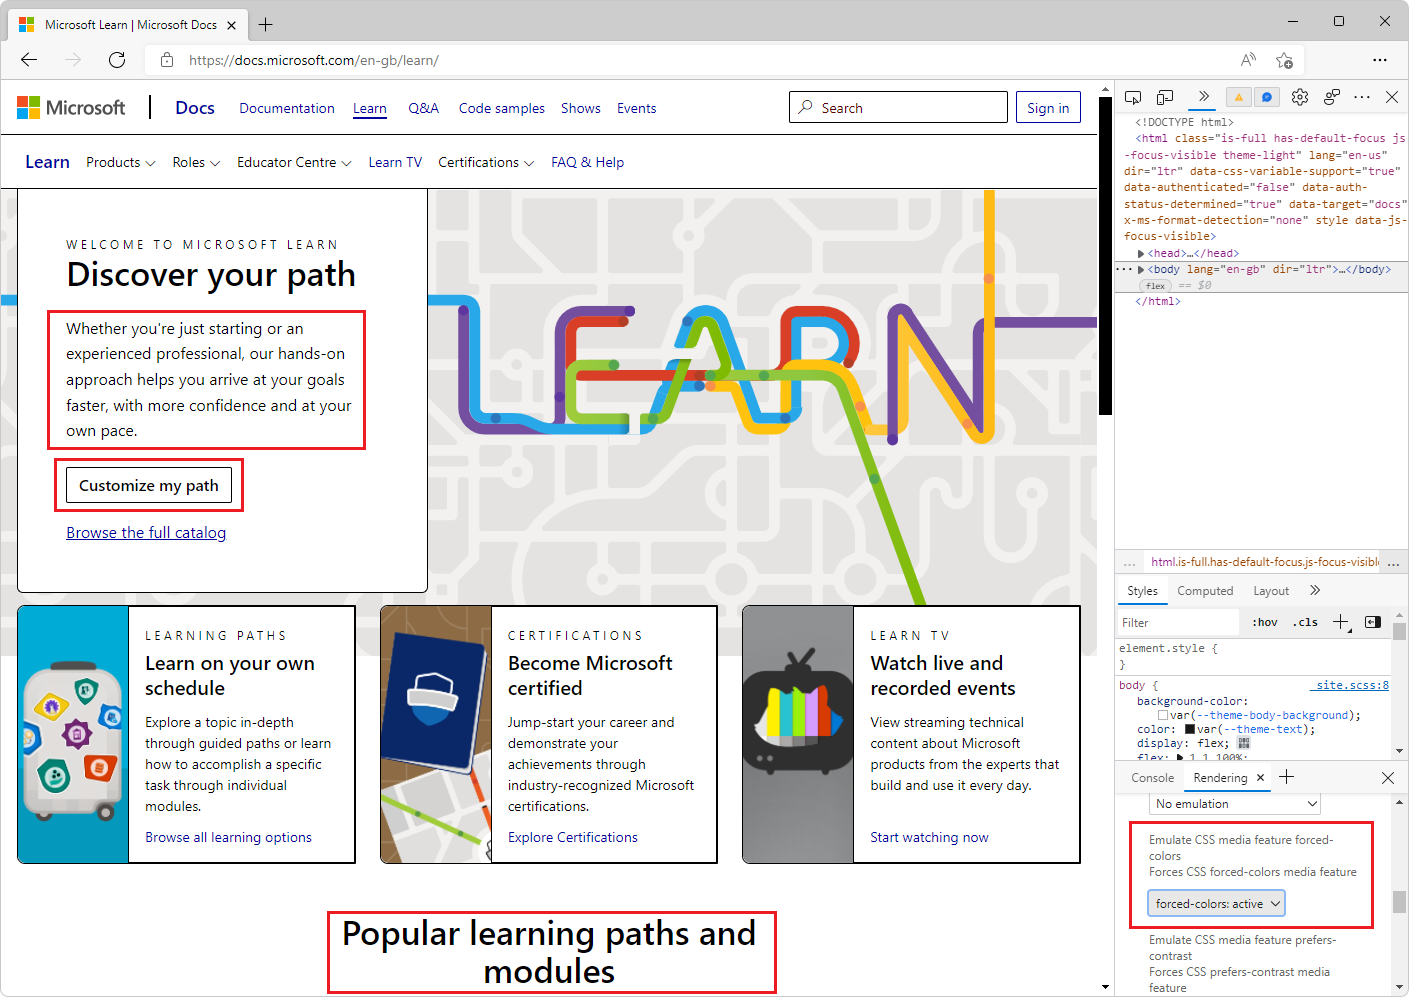
To turn on forced-colors emulation, in DevTools, open the Rendering tool, and then in the Emulate CSS media feature forced-colors dropdown list, select forced-colors: active.
Without forced-colors emulation turned on, the following webpage has several different colors of text against different background colors:
With forced-colors emulation turned on in the Rendering tool, the webpage changes to black text on a white background:
See also:
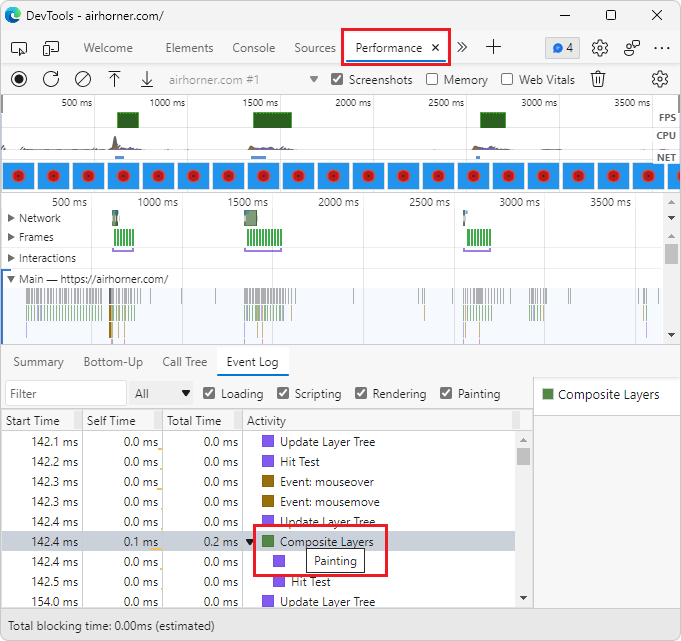
Activity icons in the Event Log of the Performance tool now have tooltips
In previous versions of Microsoft Edge, the Event Log tab in the Performance tool displays color-coded icons representing the type of activity for each event. However, the Event Log doesn't display information about what type of activity is represented by each color. In Microsoft Edge 98, tooltips have been added to the activity events in the Event Log tab, indicating Scripting, Rendering, Painting, System, and Idle time, for each event.
See also:
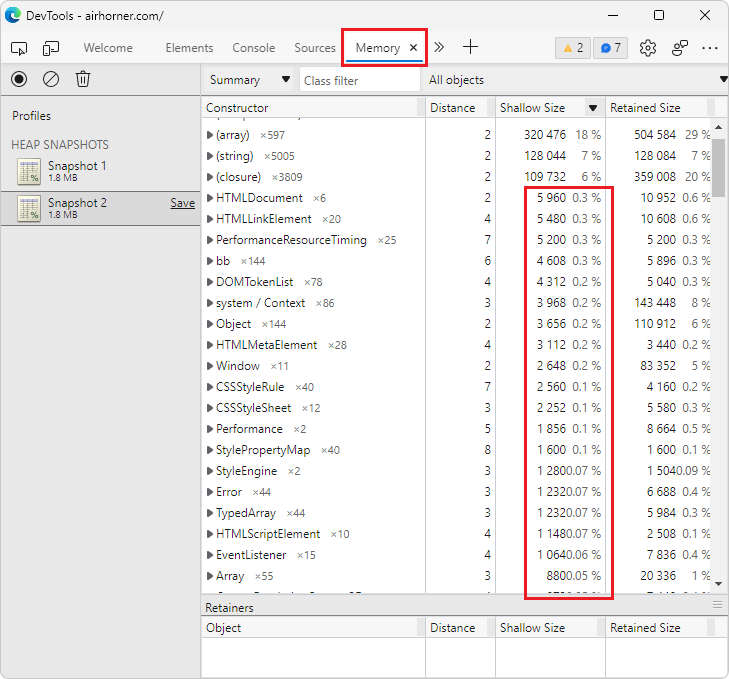
Shallow sizes in the Memory tool are now represented as decimal values
In previous versions of Microsoft Edge, the shallow size in a heap snapshot in the Memory tool is commonly reported as 0%, because the shallow size is so small, relative to the total size of the heap. In Microsoft Edge 98, shallow size is now reported as a decimal value, if the size is between 0% and 1% of the heap.
See also:
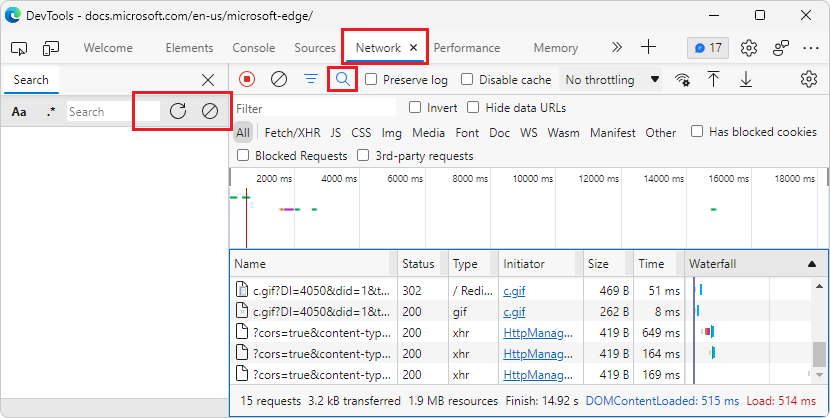
Fix: The Search text box in the Network tool can now be resized
In previous versions of Microsoft Edge, in the Network tool, the Search text box doesn't resize when you change the width of the pane. When the pane is narrow, the Refresh and Clear buttons aren't displayed. In Microsoft Edge 98, this issue has been fixed.
See also:
- Search network headers and responses in Inspect network activity.
Fix: Icons for service workers and script tags in the Elements tool are now aligned
In previous versions of Microsoft Edge, the Expand (![]() ) icons in the Service Workers section of the Application tool were not aligned. The version number in the Update Cycle table was cutting off the Expand icons. In Microsoft Edge 98, this issue has been fixed:
) icons in the Service Workers section of the Application tool were not aligned. The version number in the Update Cycle table was cutting off the Expand icons. In Microsoft Edge 98, this issue has been fixed:
![]()
Also, in the Elements tool, the Expand (![]() ) icon for
) icon for <script> tags was misaligned. In Microsoft Edge 98, this issue has been fixed:
![]()
See also:
- Service workers in Debug Progressive Web Apps (PWAs) - debugging service workers in DevTools.
Announcements from the Chromium project
Microsoft Edge version 98 also includes the following updates from the Chromium project:
Feedback
Coming soon: Throughout 2024 we will be phasing out GitHub Issues as the feedback mechanism for content and replacing it with a new feedback system. For more information see: https://aka.ms/ContentUserFeedback.
Submit and view feedback for