Pipeline visualization
A pipeline built with NimbusML can be visualized easily using the visualization method:
fig = img_export_pipeline(pipeline, stream)
It helps users to track the input/output of each step and can be used for sanity check of the features, especially for complicated pipelines with a large number of transforms. This notebook demonstrates how to visualize a pipeline.
Install Graphviz
graphviz is one tool often used to represent a graph described with the DOT language. In NimbusML, to use the img_export_pipeline function, we need to install graphviz. To use graphviz in this notebook, download the executables, add them to your system path, and then run "pip install graphviz".
import os
import sys


def install_and_import(package):
    import importlib
    try:
        importlib.import_module(package)
    except ImportError:
        import pip
        pip.main(
            ['install', package])
    finally:
        globals()[package] = importlib.import_module(package)


install_and_import('graphviz')
Data
We consider a very small dataset with tweets for demonstration.
import pandas
import pprint
from nimbusml.feature_extraction.text import NGramFeaturizer
from nimbusml.preprocessing.schema import ColumnConcatenator
from nimbusml.feature_extraction.categorical import OneHotVectorizer
from nimbusml.ensemble import FastTreesBinaryClassifier
from nimbusml import Pipeline, FileDataStream, Role
data = """
"ItemID","Sentiment","SentimentSource","SentimentText","RowNum","Positive","Train","Small"
1,0,"Sentiment140","is so sad for my APL friend.............",1,FALSE,TRUE,FALSE
2,0,"Sentiment140","I missed the New Moon trailer...",2,FALSE,TRUE,FALSE
3,1,"Sentiment140","omg its already 7:30 :O",3,TRUE,TRUE,FALSE
4,0,"Sentiment140",".. Omgaga. Im sooo  im gunna CRy. I've been at this dentist since 11.. I was suposed 2 just get a crown put on (30mins)...",4,FALSE,TRUE,FALSE
5,0,"Sentiment140","i think mi bf is cheating on me!!!       T_T",5,FALSE,TRUE,FALSE
6,0,"Sentiment140","or i just worry too much?",6,FALSE,TRUE,FALSE
7,1,"Sentiment140","Juuuuuuuuuuuuuuuuussssst Chillin!!",7,TRUE,TRUE,FALSE
8,0,"Sentiment140","Sunny Again        Work Tomorrow  :-|       TV Tonight",8,FALSE,TRUE,FALSE
9,1,"Sentiment140","handed in my uniform today . i miss you already",9,TRUE,TRUE,FALSE
"""
with open("data_train.csv", "w") as f:
    f.write(data.replace("\t", ","))
stream = FileDataStream.read_csv("data_train.csv")
stream.head()
| ItemID | Positive | RowNum | Sentiment | SentimentSource | SentimentText | Small | Train | |
|---|---|---|---|---|---|---|---|---|
| 0 | 1 | False | 1 | 0 | Sentiment140 | is so sad for my APL friend............. | False | True |
| 1 | 2 | False | 2 | 0 | Sentiment140 | I missed the New Moon trailer... | False | True |
| 2 | 3 | True | 3 | 1 | Sentiment140 | omg its already 7:30 :O | False | True |
| 3 | 4 | False | 4 | 0 | Sentiment140 | .. Omgaga. Im sooo im gunna CRy. I've been at... | False | True |
| 4 | 5 | False | 5 | 0 | Sentiment140 | i think mi bf is cheating on me!!! T_T | False | True |
A pipeline
The following pipeline includes a couple of transform to process and convert text into numerical features.
transform_1 = NGramFeaturizer() << {'transformed1':'SentimentText'}
transform_2 = OneHotVectorizer() << 'SentimentSource'
transform_3 = ColumnConcatenator() << {'finalfeatures': ['transformed1', 'SentimentSource']}
algo = FastTreesBinaryClassifier() << {Role.Feature:'finalfeatures', Role.Label: "Positive"}

pipeline = Pipeline([transform_1, transform_2, transform_3, algo])
Method get_fit_info gives information on input, output for each transfrom and learner of the pipeline. The output is a list of dictionaries, each of them describes one element of the pipeline.
pprint.pprint(pipeline.get_fit_info(stream)[0])
[{'name': None,
  'operator': None,
  'outputs': ['ItemID',
              'Sentiment',
              'SentimentSource',
              'SentimentText',
              'RowNum',
              'Positive',
              'Train',
              'Small'],
  'schema_after': ['ItemID',
                   'Sentiment',
                   'SentimentSource',
                   'SentimentText',
                   'RowNum',
                   'Positive',
                   'Train',
                   'Small'],
  'type': 'start'},
 {'inputs': ['SentimentText'],
  'name': 'NGramFeaturizer',
  'operator': NGramFeaturizer(char_feature_extractor=None,
        columns={'transformed1': 'SentimentText'}, dictionary=None,
        keep_diacritics=False, keep_numbers=True, keep_punctuations=True,
        language='English', output_tokens=False, stop_words_remover=None,
        text_case='Lower', vector_normalizer='L2',
        word_feature_extractor={'Name': 'NGram', 'Settings': {'NgramLength': 1, 'SkipLength': 0, 'AllLengths': True, 'MaxNumTerms': [10000000], 'Weighting': 'Tf'}}),
  'outputs': ['transformed1', 'transformed1_TransformedText'],
  'schema_after': ['ItemID',
                   'Sentiment',
                   'SentimentSource',
                   'SentimentText',
                   'RowNum',
                   'Positive',
                   'Train',
                   'Small',
                   'transformed1',
                   'transformed1_TransformedText'],
  'type': 'transform'},
 {'inputs': ['SentimentSource'],
  'name': 'OneHotVectorizer',
  'operator': OneHotVectorizer(columns='SentimentSource', max_num_terms=1000000,
         output_kind='Ind', sort='Occurrence', term=None,
         text_key_values=True),
  'outputs': ['SentimentSource'],
  'schema_after': ['ItemID',
                   'Sentiment',
                   'SentimentSource',
                   'SentimentText',
                   'RowNum',
                   'Positive',
                   'Train',
                   'Small',
                   'transformed1',
                   'transformed1_TransformedText'],
  'type': 'transform'},
 {'inputs': ['transformed1', 'SentimentSource'],
  'name': 'ColumnConcatenator',
  'operator': ColumnConcatenator(columns={'finalfeatures': ['transformed1', 'SentimentSource']}),
  'outputs': ['finalfeatures'],
  'schema_after': ['ItemID',
                   'Sentiment',
                   'SentimentSource',
                   'SentimentText',
                   'RowNum',
                   'Positive',
                   'Train',
                   'Small',
                   'transformed1',
                   'transformed1_TransformedText',
                   'finalfeatures'],
  'type': 'transform'},
 {'inputs': ['Feature:finalfeatures', 'Label:Positive'],
  'name': 'FastTreesBinaryClassifier',
  'operator': FastTreesBinaryClassifier(allow_empty_trees=True, bagging_size=0,
             baseline_alpha_risk=None, baseline_scores_formula=None,
             best_step_trees=False, bias=0.0, bundling='None',
             caching='Auto', categorical_split=False,
             compress_ensemble=False, disk_transpose=None,
             dropout_rate=0.0, early_stopping_metrics=0,
             early_stopping_rule=None, enable_pruning=False,
             entropy_coefficient=0.0, example_fraction=0.7,
             execution_times=False, feature='finalfeatures',
             feature_compression_level=1, feature_flocks=True,
             feature_fraction=1.0, feature_reuse_penalty=0.0,
             feature_select_seed=123, filter_zero_lambdas=False,
             first_use_penalty=0.0, gain_conf_level=0.0,
             get_derivatives_sample_rate=1, group_id=None,
             histogram_pool_size=-1, label='Positive', learning_rate=0.2,
             max_categorical_groups_per_node=64,
             max_categorical_split_points=64, max_tree_output=100.0,
             max_trees_after_compression=-1,
             min_docs_for_categorical_split=100,
             min_docs_percentage_split=0.001, min_split=10,
             min_step_size=0.0, normalize='Auto', num_bins=255,
             num_leaves=20, num_post_bracket_steps=0, num_trees=100,
             optimizer='GradientDescent', parallel_trainer=None,
             position_discount_freeform=None, pruning_threshold=0.004,
             pruning_window_size=5, random_start=False, random_state=123,
             shrinkage=1.0, smoothing=0.0, softmax_temperature=0.0,
             sparsify_threshold=0.7, split_fraction=1.0,
             test_frequency=2147483647, train_threads=None,
             unbalanced_sets=False, use_line_search=False,
             use_tolerant_pruning=False, weight=None,
             write_last_ensemble=False),
  'outputs': ['PredictedLabel', 'PredictedProba', 'Score'],
  'schema_after': ['PredictedLabel', 'PredictedProba', 'Score'],
  'type': 'classifier'}]
Graph representation
Previous information can be summarized in a nice graph much easier to read. The graph is described with the DOT language. That's what the function dot_export_pipeline does. For raw text of the graph, users can use the dot_export_pipeline function:
from nimbusml.utils.exports import dot_export_pipeline
dot_vis = dot_export_pipeline(pipeline, stream)
print(dot_vis)
digraph{
  orientation=portrait;
  sch0[label="<f0> ItemID|<f1> Sentiment|<f2> SentimentSource|<f3> SentimentText|<f4> RowNum|<f5> Positive|<f6> Train|<f7> Small",shape=record,fontsize=8];

  node1[label="NGramFeaturizer",shape=box,style="filled,rounded",color=cyan,fontsize=12];
  sch0:f3 -> node1;
  sch1[label="<f0> transformed1|<f1> transformed1_TransformedText",shape=record,fontsize=8];
  node1 -> sch1:f0;
  node1 -> sch1:f1;

  node2[label="OneHotVectorizer",shape=box,style="filled,rounded",color=cyan,fontsize=12];
  sch0:f2 -> node2;
  sch2[label="<f0> SentimentSource",shape=record,fontsize=8];
  node2 -> sch2:f0;

  node3[label="ColumnConcatenator",shape=box,style="filled,rounded",color=cyan,fontsize=12];
  sch1:f0 -> node3;
  sch2:f0 -> node3;
  sch3[label="<f0> finalfeatures",shape=record,fontsize=8];
  node3 -> sch3:f0;

  node4[label="FastTreesBinaryClassifier",shape=box,style="filled,rounded",color=yellow,fontsize=12];
  sch3:f0 -> node4 [label="Feature",fontsize=8];
  sch0:f5 -> node4 [label="Label",fontsize=8];
  sch4[label="<f0> PredictedLabel|<f1> PredictedProba|<f2> Score",shape=record,fontsize=8];
  node4 -> sch4:f0;
  node4 -> sch4:f1;
  node4 -> sch4:f2;
}
Visualize with graphviz
from nimbusml.utils.exports import img_export_pipeline
fig = img_export_pipeline(pipeline, stream)
fig
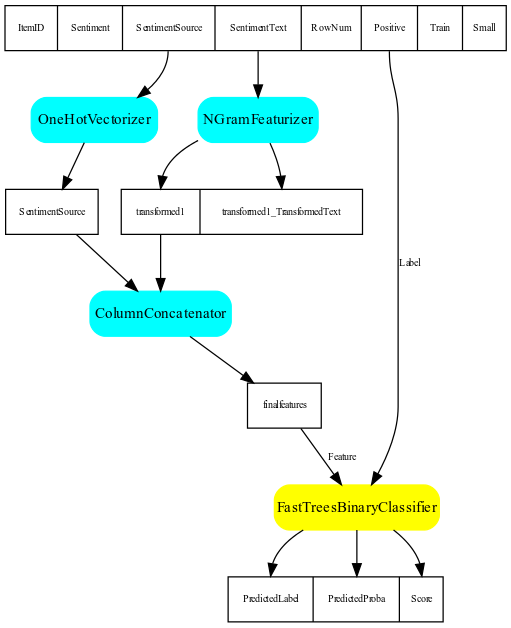
Let's give some insights on what it represents.

Visualize with viz.js
There exists a javascript alternative to graphivz which does not requiree installation but only works in a notebook: viz.js.
%%html

<div id="dotgraph" style="width:100%;height:100%;"></div></div>
<script>

require(['http://viz-js.com/bower_components/viz.js/viz.js'], function() {
    var svgGraph = Viz("digraph{\n  orientation=portrait;\n  sch0[label=\"<f0> ItemID|<f1> Sentiment|<f2> SentimentSource|<f3> SentimentText|<f4> RowNum|<f5> Positive|<f6> Train|<f7> Small\",shape=record,fontsize=8];\n\n  node1[label=\"NGramFeaturizer\",shape=box,style=\"filled,rounded\",color=cyan,fontsize=12];\n  sch0:f3 -> node1;\n  sch1[label=\"<f0> transformed1\",shape=record,fontsize=8];\n  node1 -> sch1:f0;\n\n  node2[label=\"OneHotVectorizer\",shape=box,style=\"filled,rounded\",color=cyan,fontsize=12];\n  sch0:f2 -> node2;\n  sch2[label=\"<f0> SentimentSource\",shape=record,fontsize=8];\n  node2 -> sch2:f0;\n\n  node3[label=\"ColumnConcatenator\",shape=box,style=\"filled,rounded\",color=cyan,fontsize=12];\n  sch1:f0 -> node3;\n  sch2:f0 -> node3;\n  sch3[label=\"<f0> finalfeatures\",shape=record,fontsize=8];\n  node3 -> sch3:f0;\n\n  node4[label=\"FastTreesBinaryClassifier\",shape=box,style=\"filled,rounded\",color=yellow,fontsize=12];\n  sch3:f0 -> node4 [label=\"Feature\",fontsize=8];\n  sch0:f5 -> node4 [label=\"Label\",fontsize=8];\n  sch4[label=\"<f0> PredictedLabel|<f1> PredictedProba|<f2> Score\",shape=record,fontsize=8];\n  node4 -> sch4:f0;\n  node4 -> sch4:f1;\n  node4 -> sch4:f2;\n}");
    document.getElementById('dotgraph').innerHTML = svgGraph;
});

</script>
In a function
If you have many pipeline to draw.
from nimbusml.utils.exports import dot_export_pipeline
from jinja2 import Template
import uuid
from IPython.display import HTML


template = Template("""
<div id="{{divid}}" style="width:{{width}};height:{{height}};"></div></div>
<script>

require(['http://viz-js.com/bower_components/viz.js/viz.js'], function() {
    var dot = '{{dot}}';
    var svgGraph = Viz(dot);
    document.getElementById('{{divid}}').innerHTML = svgGraph;
});

</script>
""")


def display_pipeline(pipeline, stream, divid=None, width="100%", height="100%"):
    global template
    if divid is None:
        divid = uuid.uuid4()
    dot = dot_export_pipeline(pipeline, stream)
    html = template.render(dot=dot.replace("\n", "\\n"), divid=divid,
                           width=width, height=height)
    return HTML(html)

display_pipeline(pipeline, stream)
<div id="ce614e3d-ebed-4cc9-b3c4-d57408606615" style="width:100%;height:100%;"></div></div>
<script>

require(['http://viz-js.com/bower_components/viz.js/viz.js'], function() {
    var dot = 'digraph{\n  orientation=portrait;\n  sch0[label="<f0> ItemID|<f1> Sentiment|<f2> SentimentSource|<f3> SentimentText|<f4> RowNum|<f5> Positive|<f6> Train|<f7> Small",shape=record,fontsize=8];\n\n  node1[label="NGramFeaturizer",shape=box,style="filled,rounded",color=cyan,fontsize=12];\n  sch0:f3 -> node1;\n  sch1[label="<f0> transformed1|<f1> transformed1_TransformedText",shape=record,fontsize=8];\n  node1 -> sch1:f0;\n  node1 -> sch1:f1;\n\n  node2[label="OneHotVectorizer",shape=box,style="filled,rounded",color=cyan,fontsize=12];\n  sch0:f2 -> node2;\n  sch2[label="<f0> SentimentSource",shape=record,fontsize=8];\n  node2 -> sch2:f0;\n\n  node3[label="ColumnConcatenator",shape=box,style="filled,rounded",color=cyan,fontsize=12];\n  sch1:f0 -> node3;\n  sch2:f0 -> node3;\n  sch3[label="<f0> finalfeatures",shape=record,fontsize=8];\n  node3 -> sch3:f0;\n\n  node4[label="FastTreesBinaryClassifier",shape=box,style="filled,rounded",color=yellow,fontsize=12];\n  sch3:f0 -> node4 [label="Feature",fontsize=8];\n  sch0:f5 -> node4 [label="Label",fontsize=8];\n  sch4[label="<f0> PredictedLabel|<f1> PredictedProba|<f2> Score",shape=record,fontsize=8];\n  node4 -> sch4:f0;\n  node4 -> sch4:f1;\n  node4 -> sch4:f2;\n}';
    var svgGraph = Viz(dot);
    document.getElementById('ce614e3d-ebed-4cc9-b3c4-d57408606615').innerHTML = svgGraph;
});

</script>