Office Scripts sample scenario: Fetch and graph water-level data from NOAA
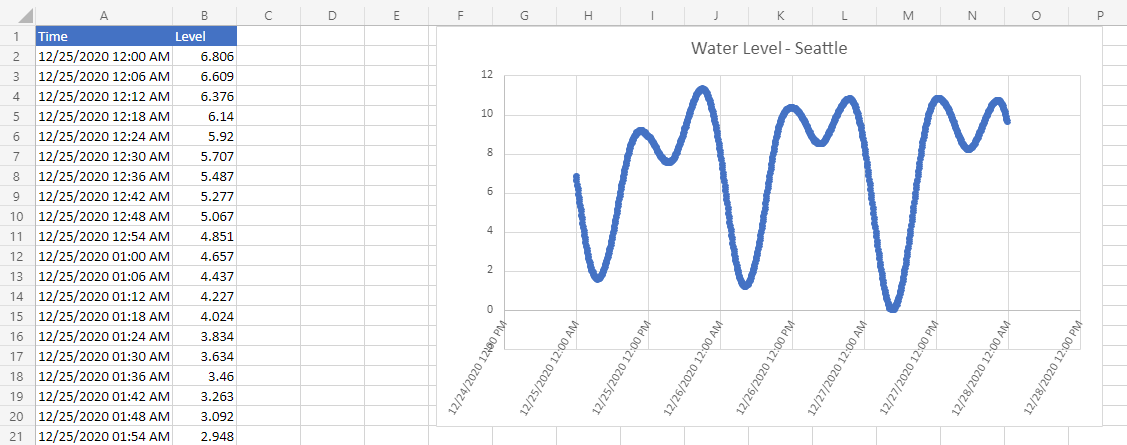
In this scenario, you need to plot the water level at the National Oceanic and Atmospheric Administration's Seattle station. You'll use external data to populate a spreadsheet and create a chart.
You'll develop a script that uses the fetch command to query the NOAA Tides and Currents database. That will get the water level recorded across a given time span. The information will be returned as JSON, so part of the script will translate that into range values. Once the data is in the spreadsheet, it will be used to make a chart.
For more information about working with JSON, read Use JSON to pass data to and from Office Scripts.
Scripting skills covered
- External API calls (
fetch) - JSON parsing
- Charts
Setup instructions
Open the workbook in Excel.
Under the Automate tab, select New Script and paste the following script into the editor.
/**
 * Gets data from the National Oceanic and Atmospheric Administration's Tides and Currents database.
 * That data is used to make a chart.
 */
async function main(workbook: ExcelScript.Workbook) {
  // Get the current sheet.
  let currentSheet = workbook.getActiveWorksheet();

  // Create selection of parameters for the fetch URL.
  // More information on the NOAA APIs is found here:
  // https://api.tidesandcurrents.noaa.gov/api/prod/
  const option = "water_level";
  const startDate = "20201225"; /* yyyymmdd date format */
  const endDate = "20201227";
  const station = "9447130"; /* Seattle */

  // Construct the URL for the fetch call.
  const strQuery = `https://api.tidesandcurrents.noaa.gov/api/prod/datagetter?product=${option}&begin_date=${startDate}&end_date=${endDate}&datum=MLLW&station=${station}&units=english&time_zone=gmt&application=NOS.COOPS.TAC.WL&format=json`;

  console.log(strQuery);

  // Resolve the Promises returned by the fetch operation.
  const response = await fetch(strQuery);
  const rawJson: string = await response.json();

  // Translate the raw JSON into a usable state.
  const stringifiedJson = JSON.stringify(rawJson);

  // Note that we're only taking the data part of the JSON and excluding the metadata.
  const noaaData: NOAAData[] = JSON.parse(stringifiedJson).data;

  // Create table headers and format them to stand out.
  let headers = [["Time", "Level"]];
  let headerRange = currentSheet.getRange("A1:B1");
  headerRange.setValues(headers);
  headerRange.getFormat().getFill().setColor("#4472C4");
  headerRange.getFormat().getFont().setColor("white");

  // Insert all the data in rows from JSON.
  let noaaDataCount = noaaData.length;
  let dataToEnter = [[], []]
  for (let i = 0; i < noaaDataCount; i++) {
    let currentDataPiece = noaaData[i];
    dataToEnter[i] = [currentDataPiece.t, currentDataPiece.v];
  }

  let dataRange = currentSheet.getRange("A2:B" + String(noaaDataCount + 1)); /* +1 to account for the title row */
  dataRange.setValues(dataToEnter);

  // Format the "Time" column for timestamps.
  dataRange.getColumn(0).setNumberFormatLocal("[$-en-US]mm/dd/yyyy hh:mm AM/PM;@");

  // Create and format a chart with the level data.
  let chart = currentSheet.addChart(ExcelScript.ChartType.xyscatterSmooth, dataRange);
  chart.getTitle().setText("Water Level - Seattle");
  chart.setTop(0);
  chart.setLeft(300);
  chart.setWidth(500);
  chart.setHeight(300);
  chart.getAxes().getValueAxis().setShowDisplayUnitLabel(false);
  chart.getAxes().getCategoryAxis().setTextOrientation(60);
  chart.getLegend().setVisible(false);

  // Add a comment with the data attribution.
  currentSheet.addComment(
    "A1",
    `This data was taken from the National Oceanic and Atmospheric Administration's Tides and Currents database on ${new Date(Date.now())}.`
  );

  /**
   * An interface to wrap the parts of the JSON we need.
   * These properties must match the names used in the JSON.
   */
  interface NOAAData {
    t: string; // Time
    v: number; // Level
  }
}
Rename the script to NOAA Water Level Chart and save it.
Running the script
On any worksheet, run the NOAA Water Level Chart script. The script fetches the water level data from December 25, 2020 to December 27, 2020. The const variables at the beginning of the script can be changed to use different dates or get different station information. The CO-OPS API For Data Retrieval describes how to get all this data.
After running the script
Office Scripts
Feedback
Coming soon: Throughout 2024 we will be phasing out GitHub Issues as the feedback mechanism for content and replacing it with a new feedback system. For more information see: https://aka.ms/ContentUserFeedback.
Submit and view feedback for