Tutorial: Create and format an Excel table
This tutorial teaches you the basics of recording, editing, and writing an Office Script for Excel. You'll record a script that applies some formatting to a sales record worksheet. You'll then edit the recorded script to apply more formatting, create a table, and sort that table. This record-then-edit pattern is an important tool to see what your Excel actions look like as code.
Prerequisites
You'll need access to Office Scripts for this tutorial. Please review the Platform support if the Automate tab doesn't appear.
Important
This tutorial is intended for people with beginner to intermediate-level knowledge of JavaScript or TypeScript. If you're new to JavaScript, we recommend starting with the Mozilla JavaScript tutorial. Visit Office Scripts Code Editor environment to learn more about the script environment.
Add data and record a basic script
First, you'll need some data and a small starting script.
Create a new Excel workbook.
Copy the following fruit sales data and paste it into the worksheet, starting at cell A1.
Fruit 2018 2019 Oranges 1000 1200 Lemons 800 900 Limes 600 500 Grapefruits 900 700 Open the Automate tab. If you don't see the Automate tab, check the ribbon overflow by selecting the drop-down arrow. If it's still not there, follow the advice in the article Troubleshoot Office Scripts.
Select the Record Actions button.
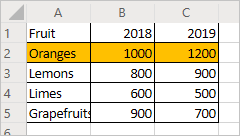
Select cells A2:C2 (the "Oranges" row) and set the fill color to orange.
Stop the recording by selecting the Stop button.
Your worksheet should look like this (don't worry if the color is different):
Edit an existing script
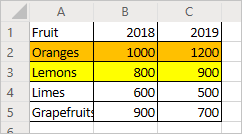
The previous script colored the "Oranges" row to be orange. Add a yellow row for the "Lemons".
From the now-open Details pane, select the Edit button.
You should see something similar to this code:
function main(workbook: ExcelScript.Workbook) {
  // Set fill color to FFC000 for range Sheet1!A2:C2
  let selectedSheet = workbook.getActiveWorksheet();
  selectedSheet.getRange("A2:C2").getFormat().getFill().setColor("FFC000");
}
This code gets the current worksheet from the workbook. Then, it sets the fill color of the range A2:C2.
Ranges are a fundamental part of Office Scripts in Excel. A range is a contiguous, rectangular block of cells that contains values, formula, and formatting. They are the basic structure of cells through which you'll perform most of your scripting tasks.
Add the following line to the end of the script (between where the
coloris set and the closing}):selectedSheet.getRange("A3:C3").getFormat().getFill().setColor("yellow");Test the script by selecting Run. Your workbook should now look like this:
Create a table
Next, convert this fruit sales data into a table. You'll keep modifying the first script for the entire tutorial.
Add the following line to the end of the script (before the closing
}):let table = selectedSheet.addTable("A1:C5", true);That call returns a
Tableobject. Use that table to sort the data.Sort the data in ascending order based on the values in the "Fruit" column. Add the following line after the table creation:table.getSort().apply([{ key: 0, ascending: true }]);Your script should look like this:
function main(workbook: ExcelScript.Workbook) {
    // Set fill color to FFC000 for range Sheet1!A2:C2
    let selectedSheet = workbook.getActiveWorksheet();
    selectedSheet.getRange("A2:C2").getFormat().getFill().setColor("FFC000");
    selectedSheet.getRange("A3:C3").getFormat().getFill().setColor("yellow");
    let table = selectedSheet.addTable("A1:C5", true);
    table.getSort().apply([{ key: 0, ascending: true }]);
}
Tables have a
TableSortobject, accessed through theTable.getSortmethod. You can apply sorting criteria to that object. Theapplymethod takes in an array ofSortFieldobjects. In this case, you only have one sorting criteria, so you only use oneSortField.key: 0sets the column with the sort-defining values to "0" (which is the first column on the table, A in this case).ascending: truesorts the data in ascending order (instead of descending order).Run the script. You should see a table like this:

Note
If you re-run the script, you'll get an error. This is because you cannot create a table on top of another table. However, you can run the script on a different worksheet or workbook.
Re-run the script
- Create a new worksheet in the current workbook.
- Copy the fruit data from the beginning of the tutorial and paste it into the new worksheet, starting at cell A1.
- Run the script.
Next steps
Complete Tutorial: Clean and normalize Excel workbook data. It teaches you how to read data from a workbook with an Office Script.
Office Scripts
Feedback
Coming soon: Throughout 2024 we will be phasing out GitHub Issues as the feedback mechanism for content and replacing it with a new feedback system. For more information see: https://aka.ms/ContentUserFeedback.
Submit and view feedback for