Monitor run details
From this page you can view all the details of one of your desktop flow runs for the current environment. The information provided in this page can help you to understand better how your flows are running, what went good or bad, and all the useful related metadata (owner, inputs, and others).
You can access this page:
- from the monitor section in the left nav of Power Automate
- from Desktop flow activity: in last runs pivot by selecting one run from the desktop flows runs card.
- from Desktop flow runs
Run details
The run details card displays all the parameters related to your run.
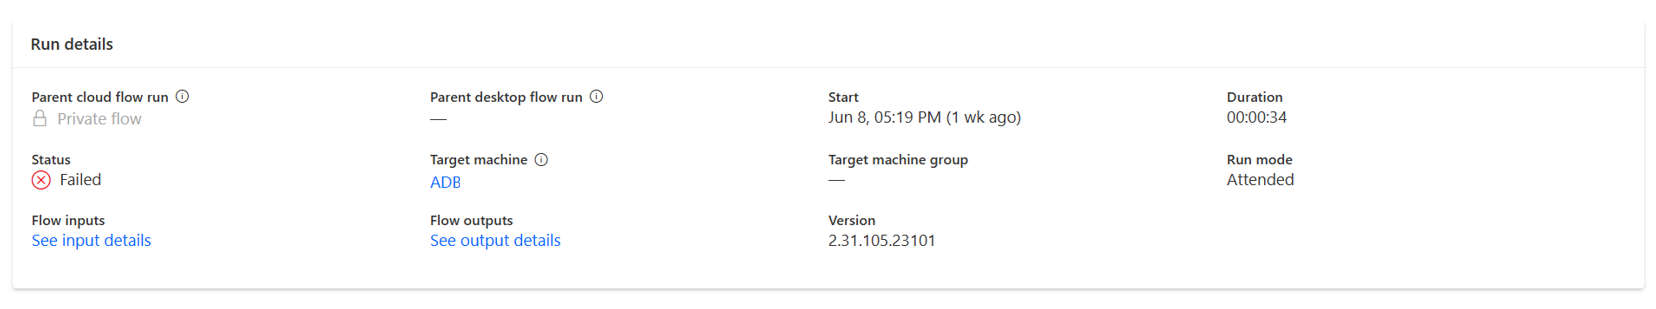
- Parent cloud flow run: the name of the cloud flow that contains the executed desktop flow. The link redirects to the run details page of the parent cloud flow (for attended and unattended runs). If the run mode is local attended (flow triggered from Power Automate for desktop), the field remains empty.
- Parent desktop flow run: if there's no parent desktop flow, the field remains empty. The link redirects to the run details page of the parent desktop flow.
- Start: when the desktop flow action is requested.
- Duration: the duration of the desktop flow runs includes steps where Power Automate is trying to find the machine to target (it also includes the period in queue when all the machines are already busy)
- Status: will display the result of the desktop flow runs. Result can be succeeded, failed, canceled, skipped.
- Target machine: this provides you with the information about the registered machine that is selected to run the desktop flow in attended or unattended mode. If you're running with local attended mode, you won’t see machine information.
- Target machine group: when a machine is part of a group or the flow is run on a hosted group, you'll see the name of group displayed in this section. Link redirects you to the details page of the group.
- Run mode: can be attended or unattended when the flow is triggered from the cloud, local attended when the flow is triggered manually from Power Automate for desktop.
- Flow inputs and outputs: when a desktop flow is using inputs or provides outputs, you can see the details of both inputs and outputs by clicking on See {inputs/outputs} details.
Note
When inputs / outputs are secure inputs / outputs, you won't see the value in the details but only {}. o When inputs or outputs contain sensitive variables, the details value will always be null. Inputs and outputs are also viewable from the Dataverse flow session entity.
- Version: the version of Power Automate for desktop agent used to execute the flow.
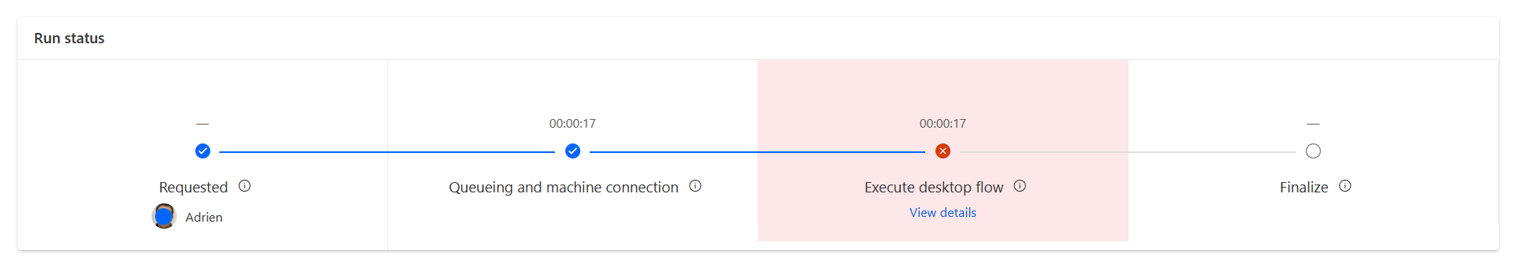
Run status
The run status is a timeline that allows to understand how works a desktop flow run from request to finalization. Running a desktop flow from a cloud flow (attended or unattended) has previous steps before being executed on your machine, the timeline describes these different steps.
It might be critical for your orchestration to identify if a step took too much time or if a desktop flow always fails during the same step.
Actions details
This card allows you to see information and status for each action of your desktop flow:
- Start: timestamp when the action has started.
- Subflow: your flow can be composed of one or several subflows. By default, your actions are in the main subflow. This information helps you to quickly identify in which subflows the action is to fix potential errors.
- Action index: in the desktop flow script, each action is linked to an action index (this corresponds to the number of the line).
- Action name
- Duration
- Log level: indicates the severity level (Info/Warning/Error) of the logged action. The only action that is associated with a log level is the Log message action. For any other logged action, the column remains empty.
- Status: this column gives you for each action the result of its run.
By default, the actions are sorted from the latest to the earliest. If you don’t see all the action in the card, select see all to view the full list of action details.
Feedback
Coming soon: Throughout 2024 we will be phasing out GitHub Issues as the feedback mechanism for content and replacing it with a new feedback system. For more information see: https://aka.ms/ContentUserFeedback.
Submit and view feedback for