Dashboard tiles in Power BI
APPLIES TO: ![]() Power BI service for business users
Power BI service for business users ![]() Power BI service for designers & developers
Power BI service for designers & developers ![]() Power BI Desktop
Power BI Desktop ![]() Requires Pro or Premium license
Requires Pro or Premium license
A tile is a snapshot of your data, pinned to a dashboard by a designer. Designers can create tiles from a report, semantic model, dashboard, the Power BI Q&A question box, Excel, SQL Server Reporting Services (SSRS), and more. This screenshot shows many different tiles pinned to a dashboard.
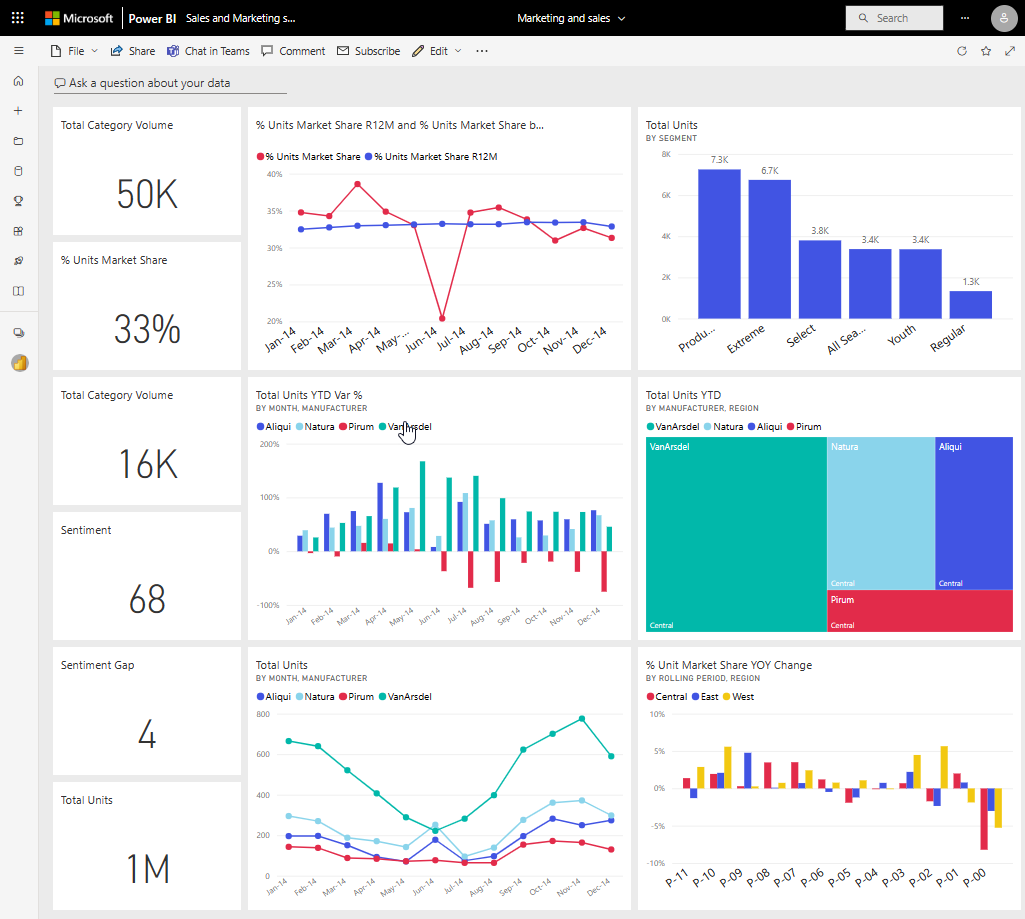
Besides tiles pinned from reports, designers can add standalone tiles directly on the dashboard using Add tile. Standalone tiles include: text boxes, images, videos, streaming data, and web content.
Need help with understanding the building blocks that make up Power BI? See Basic concepts for the Power BI service business user.
Interacting with tiles on a dashboard
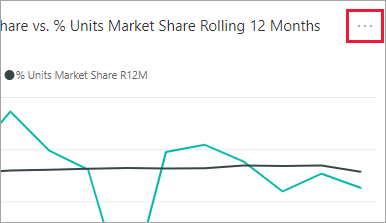
To display the ellipsis, hover over the tile.
Select the ellipses to open the tile action menu. The options available vary by your permissions, the visual type, and the method used to create the tile.
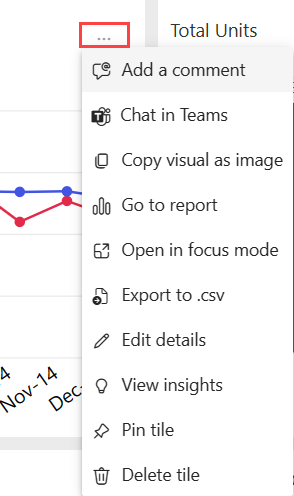
Some of the actions available from these menus are:
To close the action menu, select a blank area in the canvas.
Select a tile
When you select a tile, what happens next depends on how the tile was created and if it has a custom link. If it has a custom link, selecting the tile takes you to that link. Otherwise, selecting the tile takes you to the report, Excel Online workbook, SSRS report that is on-premises, or Q&A question that was used to create the tile.
Note
The exception to this is video tiles added to dashboards by designers. Selecting a video tile (that was created this way) causes the video to play right there on the dashboard.
Considerations and troubleshooting
- If nothing happens when you select a tile, or you receive an error message, here are some possible reasons:
- The report that was used to create the visualization wasn't saved, or has been deleted.
- The tile was created from a workbook in Excel Online, and you don't have at least Read permissions for that workbook.
- If the tile is created from SSRS, and you don't have permission to access the SSRS report. Or, if you don't have access to the network where the SSRS server is located.
- For tiles created directly on the dashboard using Add tile, if a custom hyperlink has been set, selecting the title, subtitle, or tile opens that URL. Otherwise, by default, selecting one of these tiles created directly on the dashboard for an image, web code, or text box produces no action.
- If the original visualization used to create the tile changes, the tile doesn't change. For example, if the designer pinned a line chart from a report and then changed the line chart to a bar chart, the dashboard tile continues to show a line chart. The data refreshes, but the visualization type doesn't.
- If a workspace is moved to Premium capacity, the existing dashboard refresh cache doesn't move with the workspace. The new cache is created the first time a user visits the dashboard in the new Premium capacity. After that, every data refresh will refresh the cache and update the data.
- If a tile is pinned from a workbook, you can't turn off the display of the title and subtitle. The option to Edit details > Display title and subtitle is greyed out.
Related content
Feedback
Coming soon: Throughout 2024 we will be phasing out GitHub Issues as the feedback mechanism for content and replacing it with a new feedback system. For more information see: https://aka.ms/ContentUserFeedback.
Submit and view feedback for