Create and manage relationships in Power BI Desktop
When you have multiple tables, chances are you'll do some analysis using data from all those tables. Relationships between those tables are necessary to accurately calculate results and display the correct information in your reports. In most cases you won’t have to do anything. The autodetect feature does it for you. However, sometimes you might have to create relationships yourself, or need to make changes to a relationship. Either way, it’s important to understand relationships in Power BI Desktop and how to create and edit them.
Autodetect during load
If you query two or more tables at the same time, when the data is loaded, Power BI Desktop attempts to find and create relationships for you. The relationship options Cardinality, Cross filter direction, and Make this relationship active are automatically set. Power BI Desktop looks at column names in the tables you're querying to determine if there are any potential relationships. If there are, those relationships are created automatically. If Power BI Desktop can't determine with a high level of confidence there's a match, it doesn't create the relationship. However, you can still use the Manage relationships dialog box to manually create or edit relationships.
Create a relationship with autodetect
On the Modeling tab, select Manage relationships > Autodetect.
Create a relationship manually
On the Modeling tab, select Manage relationships > New.
In the Create relationship dialog box, in the first table drop-down list, select a table. Select the column you want to use in the relationship.
In the second table drop-down list, select the other table you want in the relationship. Select the other column you want to use, and then select OK.
By default, Power BI Desktop automatically configures the options Cardinality (direction), Cross filter direction, and Make this relationship active for your new relationship. However, you can change these settings if necessary. For more information, see Understanding additional options.
If none of the tables selected for the relationship has unique values, you'll see the following error: One of the columns must have unique values. At least one table in a relationship must have a distinct, unique list of key values, which is a common requirement for all relational database technologies.
If you encounter that error, there are a couple ways to fix the issue:
- Use Remove Duplicates to create a column with unique values. The drawback to this approach is that you might lose information when duplicate rows are removed. Often a key (row) is duplicated for good reason.
- Add an intermediary table made of the list of distinct key values to the model, which will then be linked to both original columns in the relationship.
For more information, see this blog post.
Alternatively, in the Model view diagram layouts, you can drag and drop a column from one table to a column in another table to create a relationship.
Edit a relationship
There are two ways to edit a relationship in Power BI.
The first method to edit a relationship is using the Editing relationships in the Properties pane in Model view, where you can select any line between two tables to see the relationship options in the Properties pane. Be sure to expand the Properties pane to see the relationship options.

You can also see a video demonstration of editing relationships in the Properties pane.
The other method of editing a relationship is using the Relationship editor dialog, which you can open many ways from within Power BI Desktop. The following list shows different ways you can open the Relationship editor dialog:
From Report view do any of the following:
- Select the Modeling ribbon > Manage relationships, then select the relationship and select Edit.
- Select a table in the Fields list then select the Table tools ribbon > Manage relationships, then select the relationship and then select Edit.
From the Data view, select the Table tools ribbon > Manage relationships, then select the relationship and then choose Edit.
From the Model view do any of the following:
- Select the Home ribbon > Manage relationships, then choose the relationship and then select Edit.
- Double-click any line between two tables.
- Right-click any line between two tables and then choose Properties.
- Select any line between two tables, then choose Open relationship editor in the Properties pane.
Finally, you can also edit a relationship from any view, right-click or select the ellipsis to get to the context menu of any table, then select Manage relationships, select the relationship and then select Edit
The following image shows a screenshot of the Edit relationship window.

Editing relationships using different methods
Using the Edit relationships dialog is a more guided experience for editing relationships in Power BI, and is currently in preview. You can see a preview of the data in each table. As you select different columns, the window automatically validates the relationship and offers appropriate cardinality and cross filter selections.
Editing relationships in the Properties pane is a streamlined approach to editing relationships in Power BI. You only see the table names and columns from which you can choose, you aren't presented with a data preview, and the relationship choices you make are only validated when you select Apply changes. Using the Properties pane and its streamlined approach reduces the number of queries generated when editing a relationship, which might be important for big data scenarios, especially when using DirectQuery connections. Relationships created using the Properties pane can also be more advanced than the relationships allowed to be created in the Edit relationships dialog.
You can also multi-select relationships in the Model view diagram layouts by pressing the Ctrl key and selecting more than one line to choose multiple relationships. Common properties can be edited in the Properties pane and Apply changes will process the changes in one transaction.
Single or multi-selected relationships can also be deleted by pressing Delete on your keyboard. You can't undo the delete action, so a dialog prompts you to confirm deleting the relationships.
Important
Editing relationships in the properties pane feature is currently in preview. While in preview, functionality and documentation are likely to change. You must enable this feature in Power BI Desktop by going to File > Options and settings > Options > Preview features and then in the GLOBAL section, select the checkbox next to Relationship pane.
Configure more options
When you create or edit a relationship, you can configure more options. By default, Power BI Desktop automatically configures more options based on its best guess, which can be different for each relationship based on the data in the columns.
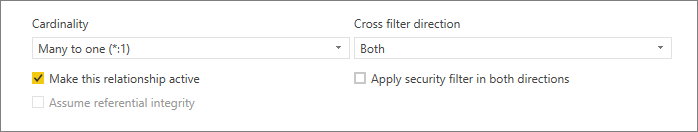
Cardinality
The Cardinality option can have one of the following settings:
Many to one (*:1): A many-to-one relationship is the most common, default type of relationship. It means the column in a given table can have more than one instance of a value, and the other related table, often know as the lookup table, has only one instance of a value.
One to one (1:1): In a one-to-one relationship, the column in one table has only one instance of a particular value, and the other related table has only one instance of a particular value.
One to many (1:*): In a one-to-many relationship, the column in one table has only one instance of a particular value, and the other related table can have more than one instance of a value.
Many to many (*:*): With composite models, you can establish a many-to-many relationship between tables, which removes requirements for unique values in tables. It also removes previous workarounds, such as introducing new tables only to establish relationships. For more information, see Relationships with a many-many cardinality.
For more information about when to change cardinality, see Understanding additional options.
Cross filter direction
The Cross filter direction option can have one the following settings:
Both: For filtering purposes, both tables are treated as if they're a single table. The Both setting works well with a single table that has many lookup tables that surround it. An example is a sales actuals table with a lookup table for its department. This configuration is often called a star schema configuration (a central table with several lookup tables). However, if you have two or more tables that also have lookup tables (with some in common) then you wouldn't want to use the Both setting. To continue the previous example, in this case, you also have a budget sales table that records target budget for each department. And, the department table is connected to both the sales and the budget table. Avoid the Both setting for this kind of configuration.
Single: The most common, default direction, which means filtering choices in connected tables work on the table where values are being aggregated. If you import a Power Pivot in Excel 2013 or earlier data model, all relationships will have a single direction.
For more information about when to change cross filter direction, see Understanding additional options.
Make this relationship active
When checked, the relationship serves as the active, default relationship. In cases where there's more than one relationship between two tables, the active relationship provides a way for Power BI Desktop to automatically create visualizations that include both tables.
For more information about when to make a particular relationship active, see Understanding additional options.
Understanding relationships
Once you've connected two tables together with a relationship, you can work with the data in both tables as if they were a single table. You're then free from having to worry about relationship details or flattening those tables into a single table before importing them. In many situations, Power BI Desktop can automatically create relationships for you. However, if Power BI Desktop can’t determine with a high-degree of certainty that a relationship between two tables should exist, it doesn't automatically create the relationship. In that case, you must do so.
Let’s go through a quick tutorial, to better show you how relationships work in Power BI Desktop.
Tip
You can complete this lesson yourself:
- Copy the following ProjectHours table into an Excel worksheet (excluding the title), select all of the cells, and then select Insert > Table.
- In the Create Table dialog box, select OK.
- Select any table cell, select Table Design > Table Name, and then enter ProjectHours.
- Do the same for the CompanyProject table.
- Import the data by using Get Data in Power BI Desktop. Select the two tables as a data source, and then select Load.
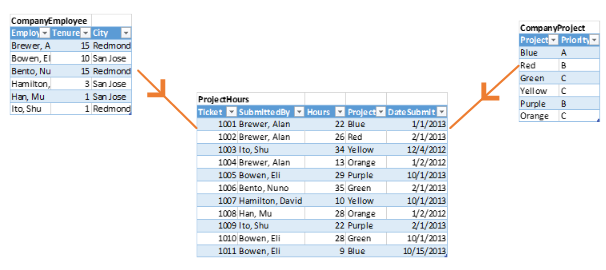
The first table, ProjectHours, is a record of work tickets that record the number of hours a person has worked on a particular project.
ProjectHours
| Ticket | SubmittedBy | Hours | Project | DateSubmit |
|---|---|---|---|---|
| 1001 | Brewer, Alan | 22 | Blue | 1/1/2013 |
| 1002 | Brewer, Alan | 26 | Red | 2/1/2013 |
| 1003 | Ito, Shu | 34 | Yellow | 12/4/2012 |
| 1004 | Brewer, Alan | 13 | Orange | 1/2/2012 |
| 1005 | Bowen, Eli | 29 | Purple | 10/1/2013 |
| 1006 | Bento, Nuno | 35 | Green | 2/1/2013 |
| 1007 | Hamilton, David | 10 | Yellow | 10/1/2013 |
| 1008 | Han, Mu | 28 | Orange | 1/2/2012 |
| 1009 | Ito, Shu | 22 | Purple | 2/1/2013 |
| 1010 | Bowen, Eli | 28 | Green | 10/1/2013 |
| 1011 | Bowen, Eli | 9 | Blue | 10/15/2013 |
This second table, CompanyProject, is a list of projects with an assigned priority: A, B, or C.
CompanyProject
| ProjName | Priority |
|---|---|
| Blue | A |
| Red | B |
| Green | C |
| Yellow | C |
| Purple | B |
| Orange | C |
Notice that each table has a project column. Each is named slightly different, but the values look like they’re the same. That difference is important, and we’ll get back to it in soon.
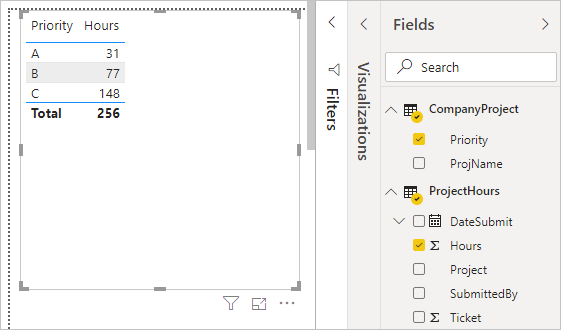
Now that we have our two tables imported into a model, let’s create a report. The first thing we want to get is the number of hours submitted by project priority, so we select Priority and Hours from the Fields pane.

If we look at our table in the report canvas, you’ll see the number of hours is 256 for each project, which is also the total. Clearly this number isn’t correct. Why? It’s because we can’t calculate a sum total of values from one table (Hours in the Project table), sliced by values in another table (Priority in the CompanyProject table) without a relationship between these two tables.
So, let’s create a relationship between these two tables.
Remember those columns we saw in both tables with a project name, but with values that look alike? We'll use these two columns to create a relationship between our tables.
Why these columns? Well, if we look at the Project column in the ProjectHours table, we see values like Blue, Red, Yellow, Orange, and so on. In fact, we see several rows that have the same value. In effect, we have many color values for Project.
If we look at the ProjName column in the CompanyProject table, we see there’s only one of each of the color values for the project name. Each color value in this table is unique, and that’s important, because we can create a relationship between these two tables. In this case, a many-to-one relationship. In a many-to-one relationship, at least one column in one of the tables must contain unique values. There are some more options for some relationships, which we'll look at later. For now, let’s create a relationship between the project columns in each of our two tables.
To create the new relationship
Select Manage relationships from the Modeling tab.
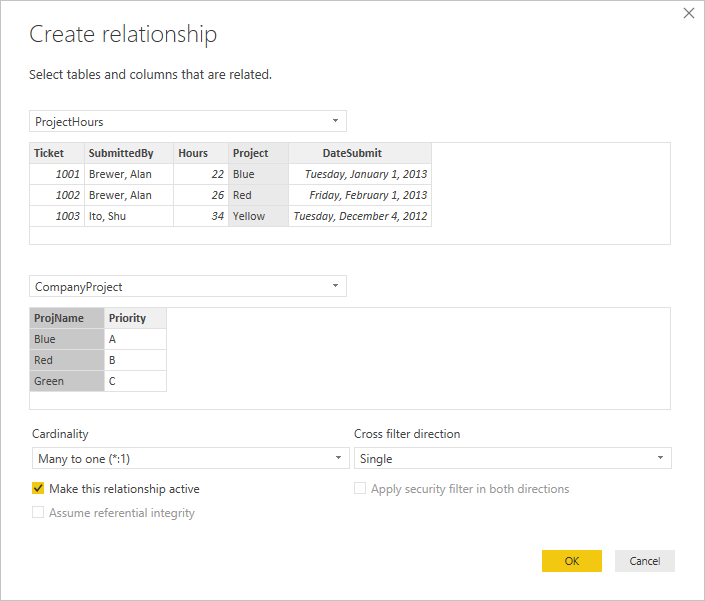
In Manage relationships, select New to open the Create relationship dialog box, where we can select the tables, columns, and any other settings we want for our relationship.
In the first drop-down list, select ProjectHours as the first table, then select the Project column. This side is the many side of our relationship.
In the second drop-down list, CompanyProject is preselected as the second table. Select the ProjName column. This side is the one side of our relationship.
Accept the defaults for the relationship options, and then select OK.
In the Manage relationships dialog box, select Close.
In the interest of full disclosure, you just created this relationship the hard way. You could have selected Autodetect in the Manage relationships dialog box. In fact, autodetect would have automatically created the relationship for you when you loaded the data if both columns had the same name.
Now, let’s look at the table in our report canvas again.
That looks a whole lot better, doesn’t it?
When we sum up hours by Priority, Power BI Desktop looks for every instance of the unique color values in the CompanyProject lookup table, looks for every instance of each of those values in the ProjectHours table, and then calculates a sum total for each unique value.
With autodetect, you might not even have to do that much.
Understanding additional options
When a relationship is created, either with autodetect or one you create manually, Power BI Desktop automatically configures additional options based on the data in your tables. These additional relationship options are located in the lower portion of the Create relationship and Edit relationship dialog boxes.
Power BI typically sets these options automatically and you won’t need to adjust them. But there are several situations where you might want to configure these options yourself.
Automatic relationship updates
You can manage how Power BI treats and automatically adjusts relationships in your reports and models. To specify how Power BI handles relationships options, select File > Options and settings > Options from Power BI Desktop, and then select Data Load in the left pane. The options for Relationships appear.
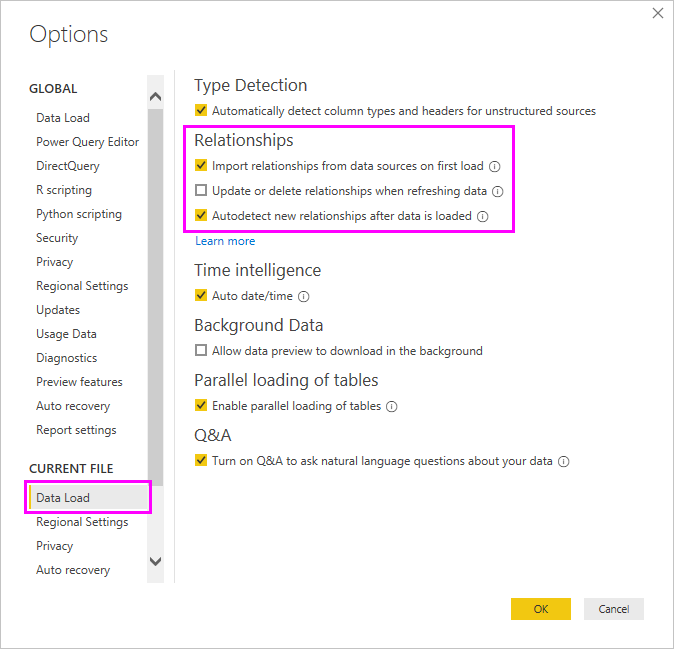
There are three options that can be selected and enabled:
Import relationships from data sources on first load: This option is selected by default. When it's selected, Power BI checks for relationships defined in your data source, such as foreign key/primary key relationships in your data warehouse. If such relationships exist, they're mirrored into the Power BI data model when you initially load data. This option enables you to quickly begin working with your model, rather than requiring you find or define those relationships yourself.
Update or delete relationships when refreshing data: This option is unselected by default. If you select it, Power BI checks for changes in data source relationships when your semantic model is refreshed. If those relationships changed or are removed, Power BI mirrors those changes in its own data model, updating or deleting them to match.
Warning
If you're using row-level security that relies on the defined relationships, we don't recommend selecting this option. If you remove a relationship that your RLS settings rely on, your model might become less secure.
Autodetect new relationships after data is loaded: This option is described in Autodetect during load.
Future updates to the data require a different cardinality
Normally, Power BI Desktop can automatically determine the best cardinality for the relationship. If you do need to override the automatic setting, because you know the data will change in the future, you can change it with the Cardinality control. Let’s look at an example where we need to select a different cardinality.
The CompanyProjectPriority table is a list of all company projects and their priority. The ProjectBudget table is the set of projects for which a budget has been approved.
CompanyProjectPriority
| ProjName | Priority |
|---|---|
| Blue | A |
| Red | B |
| Green | C |
| Yellow | C |
| Purple | B |
| Orange | C |
ProjectBudget
| Approved Projects | BudgetAllocation | AllocationDate |
|---|---|---|
| Blue | 40,000 | 12/1/2012 |
| Red | 100,000 | 12/1/2012 |
| Green | 50,000 | 12/1/2012 |
If we create a relationship between the Approved Projects column in the ProjectBudget table and the ProjectName column in the CompanyProjectPriority table, Power BI automatically sets Cardinality to One to one (1:1) and Cross filter direction to Both.

The reason Power BI makes these settings is because, to Power BI Desktop, the best combination of the two tables is as follows:
| ProjName | Priority | BudgetAllocation | AllocationDate |
|---|---|---|---|
| Blue | A | 40,000 | 12/1/2012 |
| Red | B | 100,000 | 12/1/2012 |
| Green | C | 50,000 | 12/1/2012 |
| Yellow | C | ||
| Purple | B | ||
| Orange | C |
There's a one-to-one relationship between our two tables because there are no repeating values in the combined table’s ProjName column. The ProjName column is unique, because each value occurs only once; therefore, the rows from the two tables can be combined directly without any duplication.
But, let’s say you know the data will change the next time you refresh it. A refreshed version of the ProjectBudget table now has additional rows for the Blue and Red projects:
ProjectBudget
| Approved Projects | BudgetAllocation | AllocationDate |
|---|---|---|
| Blue | 40,000 | 12/1/2012 |
| Red | 100,000 | 12/1/2012 |
| Green | 50,000 | 12/1/2012 |
| Blue | 80,000 | 6/1/2013 |
| Red | 90,000 | 6/1/2013 |
These additional rows mean the best combination of the two tables now looks like this:
| ProjName | Priority | BudgetAllocation | AllocationDate |
|---|---|---|---|
| Blue | A | 40,000 | 12/1/2012 |
| Red | B | 100,000 | 12/1/2012 |
| Green | C | 50,000 | 12/1/2012 |
| Yellow | C | ||
| Purple | B | ||
| Orange | C | ||
| Blue | A | 80000 | 6/1/2013 |
| Red | B | 90000 | 6/1/2013 |
In this new combined table, the ProjName column has repeating values. The two original tables won’t have a one-to-one relationship once the table is refreshed. In this case, because we know those future updates will cause the ProjName column to have duplicates, we want to set the Cardinality to be Many to one (*:1), with the many side on ProjectBudget and the one side on CompanyProjectPriority.
Adjusting Cross filter direction for a complex set of tables and relationships
For most relationships, the cross filter direction is set to Both. There are, however, some more uncommon circumstances where you might need to set this option differently from the default. One example is if you’re importing a model from an older version of Power Pivot, where every relationship is set to a single direction.
The Both setting enables Power BI Desktop to treat all aspects of connected tables as if they're a single table. There are some situations, however, where Power BI Desktop can't set a relationship’s cross filter direction to Both and also keep an unambiguous set of defaults available for reporting purposes. If a relationship cross filter direction isn't set to Both, then it’s usually because it would create ambiguity. If the default cross filter setting isn’t working for you, try setting it to a particular table or to Both.
Single direction cross filtering works for many situations. In fact, if you’ve imported a model from Power Pivot in Excel 2013 or earlier, all of the relationships will be set to single direction. Single direction means that filtering choices in connected tables work on the table where aggregation work is happening. Sometimes, understanding cross filtering can be a little difficult, so let’s look at an example.
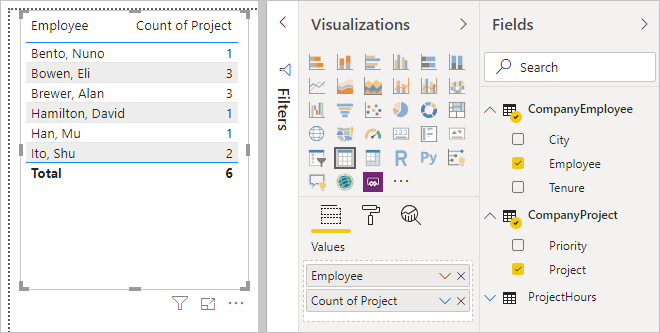
With single direction cross filtering, if you create a report that summarizes the project hours, you can then choose to summarize (or filter) by the CompanyProject table and its Priority column or the CompanyEmployee table and its City column. If however, you want to count the number of employees per projects (a less common question), it won’t work. You’ll get a column of values that are all the same. In the following example, both relationship's cross filtering direction is set to a single direction: towards the ProjectHours table. In the Values well, the Project field is set to Count:

Filter specification will flow from CompanyProject to ProjectHours (as shown in the following image), but it won’t flow up to CompanyEmployee.
However, if you set the cross filtering direction to Both, it will work. The Both setting allows the filter specification to flow up to CompanyEmployee.

With the cross filtering direction set to Both, our report now appears correct:
Cross filtering both directions works well for a pattern of table relationships such as the pattern shown previously. This schema is most commonly called a star schema, like this:
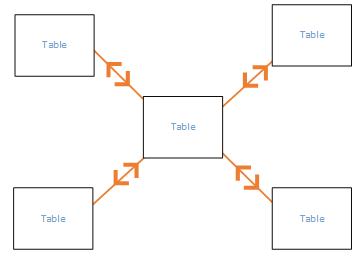
Cross filtering direction doesn't work well with a more general pattern often found in databases, like in this diagram:
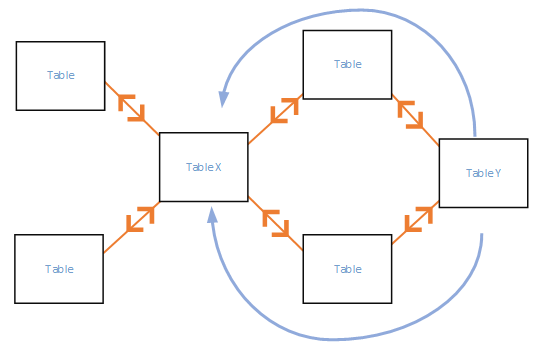
If you have a table pattern like this, with loops, then cross filtering can create an ambiguous set of relationships. For instance, if you sum up a field from TableX and then choose to filter by a field on TableY, then it’s not clear how the filter should travel, through the top table or the bottom table. A common example of this kind of pattern is with TableX as a sales table with actuals data and for TableY to be budget data. Then, the tables in the middle are lookup tables that both tables use, such as division or region.
As with active/inactive relationships, Power BI Desktop won’t allow a relationship to be set to Both if it will create ambiguity in reports. There are several different ways you can handle this situation. Here are the two most common:
- Delete or mark relationships as inactive to reduce ambiguity. Then, you might be able to set a relationship cross filtering as Both.
- Bring in a table twice (with a different name the second time) to eliminate loops. Doing so makes the pattern of relationships like a star schema. With a star schema, all of the relationships can be set to Both.
Wrong active relationship
When Power BI Desktop automatically creates relationships, it sometimes encounters more than one relationship between two tables. When this situation happens, only one of the relationships is set to be active. The active relationship serves as the default relationship, so that when you choose fields from two different tables, Power BI Desktop can automatically create a visualization for you. However, in some cases the automatically selected relationship can be wrong. Use the Manage relationships dialog box to set a relationship as active or inactive, or set the active relationship in the Edit relationship dialog box.
To ensure there’s a default relationship, Power BI Desktop allows only a single active relationship between two tables at a given time. Therefore, you must first set the current relationship as inactive and then set the relationship you want to be active.
Let’s look at an example. The first table is ProjectTickets, and the second table is EmployeeRole.
ProjectTickets
| Ticket | OpenedBy | SubmittedBy | Hours | Project | DateSubmit |
|---|---|---|---|---|---|
| 1001 | Perham, Tom | Brewer, Alan | 22 | Blue | 1/1/2013 |
| 1002 | Roman, Daniel | Brewer, Alan | 26 | Red | 2/1/2013 |
| 1003 | Roth, Daniel | Ito, Shu | 34 | Yellow | 12/4/2012 |
| 1004 | Perham, Tom | Brewer, Alan | 13 | Orange | 1/2/2012 |
| 1005 | Roman, Daniel | Bowen, Eli | 29 | Purple | 10/1/2013 |
| 1006 | Roth, Daniel | Bento, Nuno | 35 | Green | 2/1/2013 |
| 1007 | Roth, Daniel | Hamilton, David | 10 | Yellow | 10/1/2013 |
| 1008 | Perham, Tom | Han, Mu | 28 | Orange | 1/2/2012 |
| 1009 | Roman, Daniel | Ito, Shu | 22 | Purple | 2/1/2013 |
| 1010 | Roth, Daniel | Bowen, Eli | 28 | Green | 10/1/2013 |
| 1011 | Perham, Tom | Bowen, Eli | 9 | Blue | 10/15/2013 |
EmployeeRole
| Employee | Role |
|---|---|
| Bento, Nuno | Project Manager |
| Bowen, Eli | Project Lead |
| Brewer, Alan | Project Manager |
| Hamilton, David | Project Lead |
| Han, Mu | Project Lead |
| Ito, Shu | Project Lead |
| Perham, Tom | Project Sponsor |
| Roman, Daniel | Project Sponsor |
| Roth, Daniel | Project Sponsor |
There are actually two relationships here:
- Between Employee in the EmployeeRole table and SubmittedBy in the ProjectTickets table.
- Between OpenedBy in the ProjectTickets table and Employee in the EmployeeRole table.

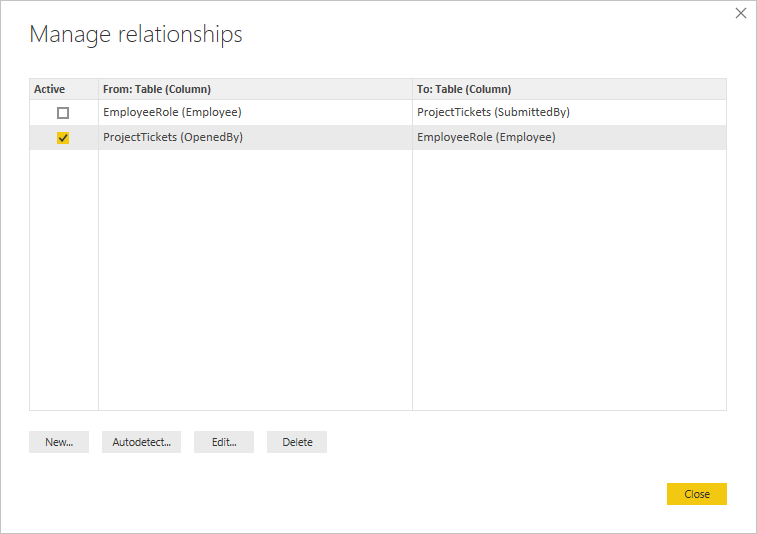
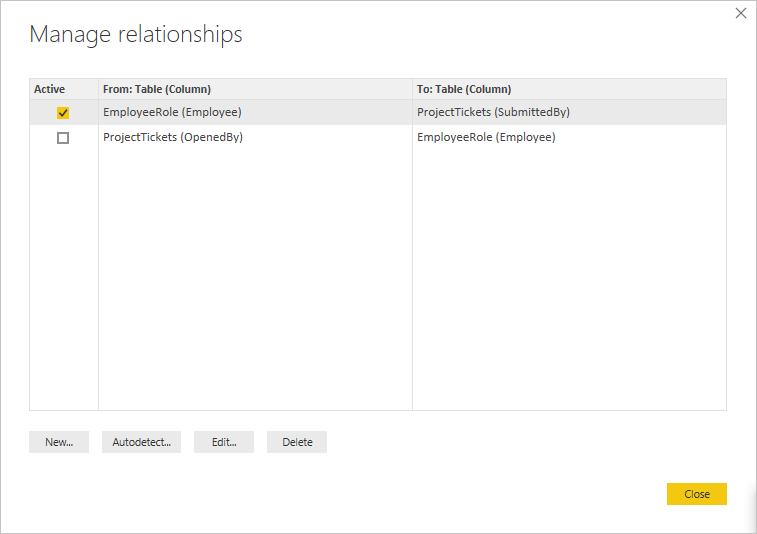
If we add both relationships to the model (OpenedBy first), then the Manage relationships dialog box shows that OpenedBy is active:
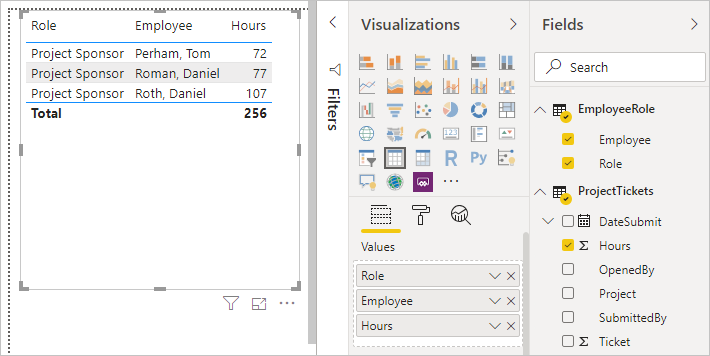
Now, if we create a report that uses Role and Employee fields from EmployeeRole, and the Hours field from ProjectTickets in a table visualization in the report canvas, we see only project sponsors because they’re the only ones that opened a project ticket.
We can change the active relationship and get SubmittedBy instead of OpenedBy. In Manage relationships, uncheck the ProjectTickets(OpenedBy) to EmployeeRole(Employee) relationship, and then check the EmployeeRole(Employee) to Project Tickets(SubmittedBy) relationship.
See all of your relationships in Relationship view
Sometimes your model has multiple tables and complex relationships between them. Relationship view in Power BI Desktop shows all of the relationships in your model, their direction, and cardinality in an easy to understand and customizable diagram.
To learn more, see Work with Relationship view in Power BI Desktop.
Troubleshooting
This section provides guidance and troubleshooting information when working with relationships in Power BI.
Relationships between fields can't be determined
Power BI attempts to show relevant data in visuals by inferring the relationships from the model being used. Sometimes such inferences aren't obvious, and you might be surprised to see an error in your visual, indicating there's no relationship between certain columns.
To explain how Power BI determines whether fields are related, let's use an example model to illustrate a few scenarios in the following sections. The following image shows the sample model we'll use in the example scenarios.

Scenario 1: Traditional star schema and no measure constraint provided. Referring to the sample model in the previous image, let's look first at the right half of the images with the Vendor - Purchases - Product tables. This example is a traditional star schema with the Fact table (Purchases) and two Dimension tables (Product and Vendor). The relationship between the dimension tables and the fact table is 1 to Many (one product corresponds to many purchases, one vendor corresponds to many purchases). In this type of schema, we can answer questions like What sales do we have for product X? and What sales do we have for Vendor Y? and What products does Vendor Y sell?
If we want to correlate Products and Vendors, we can do so by looking at the Purchases table to see if there's an entry with the same product and vendor. A sample query might look like the following example:
Correlate Product[Color] with Vendor[Name] where CountRows(Purchases)>0
The where CountRows(Purchases)>0 is an implicit constraint that Power BI would add to ensure relevant data is returned.
By doing this correlation through the Purchases table, we can return pairings of Product-Vendor that have at least one entry in a fact table, pairings that make sense from the data perspective. You can expect any nonsensical combinations of Product-Vendor for which there has never been a sale (which would be useless for analysis) won't be displayed.
Scenario 2: Traditional star schema and measure constraint provided. In the previous example in Scenario 1, if the user provides a constraint in the form of summarized column (Sum/Average/Count of Purchase Qty, for example) or a model measure (Distinct Count of VendID), Power BI can generate a query in the form of the following example:
Correlate Product[Color] with Vendor[Name] where MeasureConstraint is not blank
In such a case, Power BI attempts to return combinations that have meaningful values for the constraint provided by the user (non-blank). Power BI doesn't need to also add its own implicit constraint of CountRows(Purchases)>0, such as what was done like in the previous Scenario 1, because the constraint provided by the user is sufficient.
Scenario 3: Non-star schema and no measure constraint provided. In this scenario, we focus our attention to the center of the model, where we have the Sales - Product - Purchases tables, where we have one dimension table (Product) and two Fact Tables (Sales, Purchases). Since this example isn't a star schema, we can't answer the same kind of questions as we had in Scenario 1. Let's say we try to correlate Purchases and Sales, since Purchases has a Many to 1 relationship with Product, and Product has a 1 to Many relationship with Sales. Sales and Purchases are indirectly Many to Many. We can link one Product to many Purchases and one Product to many sales, but we can't link one Sale to many Purchases or vice versa. We can only link many Purchases to many Sales.
In this situation, if we try to combine Purchase[VenID] and Sales[CustID] in a visual, Power BI doesn't have a concrete constraint it can apply, due to the Many to Many relationship between those tables. Though there might be custom constraints (not necessarily stemming from the relationships established in the model) that can be applied for various scenarios, Power BI can't infer a default constraint solely based on the relationships. If Power BI attempted to return all combinations of the two tables, it would create a large cross join and return non-relevant data. Instead of this, Power BI raises an error in the visual, such as the following.

Scenario 4: Non-star schema and measure constraint provided. If we take the example from Scenario 3, and add a user provided constraint in the form of a summarized column (Count of Product[ProdID] for example) or a model measure (Sales[Total Qty]), Power BI can generate a query in the form of Correlate Purchase[VenID] and Sales[CustID] where MeasureConstraint isn't blank.
In this case, Power BI respects the user's constraint as being the sole constraint Power BI needs to apply, and return the combinations that produce non-blank values for it. The user has guided Power BI to the scenario it wants, and Power BI applies the guidance.
Scenario 5: When a measure constraint is provided but it is partially related to the columns. There are cases where the measure constraint provided by the user isn't entirely related to all the columns in the visual. A model measure always relates everything. Power BI treats this scenario as a black box when attempting to find relationships between columns in the visual, and it assumes the user knows what they're doing by using it. However, summarized columns in the form of Sum, Average, and similar summaries chosen from the user interface can be related to only a subset of the columns/tables used in the visual based on the relationships of the table to which that column belongs. As such, the constraint applies to some pairings of columns, but not to all. In that case Power BI attempts to find default constraints it can apply for the columns that aren't related by the user provided constraint (such as in Scenario 1). If Power BI can't find any, the following error is returned.
Resolving relationship errors
When you see the Can't determine relationships between the fields error, you can take the following steps to attempt to resolve the error:
Check your model. Is it set up appropriately for the types of questions you want answered from your analysis? Can you change some of the relationships between tables? Can you avoid creating an indirect Many to Many?
Consider converting your reversed V shape schema to two tables, and use a direct Many to Many relationship between them as described in apply many-many relationships in Power BI Desktop.
Add a constraint to the visual in the form of a summarized column or a model measure.
If a summarized column is added and there still is an error, consider using a model measure.
Related content
For more information about models and relationships, see the following articles:
Feedback
Coming soon: Throughout 2024 we will be phasing out GitHub Issues as the feedback mechanism for content and replacing it with a new feedback system. For more information see: https://aka.ms/ContentUserFeedback.
Submit and view feedback for