Work with multidimensional models in Power BI
You can connect to multidimensional models in Power BI, and create reports that visualize all sorts of data within the model. With multidimensional models, Power BI applies rules to how it processes data, based on which column is defined as the default member.
With multidimensional models, Power BI handles data from the model based on where the column that contains the Default Member is used. The DefaultMember property value for an attribute hierarchy is set in CSDL (Conceptual Schema Definition Language) for a particular column in a multidimensional model. For more information about the default member, see Attribute properties - Define a default member. When a data analysis expression (DAX) query is executed, the default member specified in the model is applied automatically.
This article describes how Power BI behaves under various circumstances when working with multidimensional models, based on where the default member is found.
Work with filter cards
When you create a filter card on a field with a default member, the default member field value is selected automatically in the filter card. The result is that all visuals affected by the filter card retain their default models in the database. The values in such filter cards reflect that default member.
If the default member is removed, deselecting the value clears it for all visuals to which the filter card applies, and the values displayed don't reflect the default member.
For example, imagine we have a Currency column and a default member set to USD:
- In this example case, if we have a card that shows Total Sales, the value will have the default member applied and the sales that correspond to USD.
- If we drag Currency to the filter card pane, we see USD as the default value selected. The value of Total Sales remains the same, since the default member is applied.
- However, if we deselect the USD value from the filter card, the default member for Currency is cleared, and now Total Sales reflects all currencies.
- When we select another value in the filter card (let's say we select EURO), along the default member, the Total Sales reflects the filter Currency IN {USD, EURO}.
Group visuals
In Power BI, whenever you group a visual on a column that has a default member, Power BI clears the default member for that column and its attribute relationship path. This behavior ensures the visual displays all values, instead of just the default values.
Attribute relationship paths (ARPs)
Attribute relationship paths (ARPs) provide default members with powerful capabilities, but also introduce a certain amount of complexity. When ARPs are encountered, Power BI follows the path of ARPs to clear other default members for other columns to provide consistent, and precise handling of data for visuals.
Let's look at an example to clarify the behavior. Consider the following configuration of ARPs:
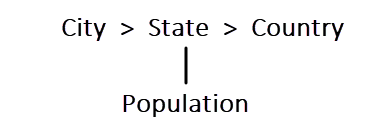
Now let's imagine that the following default members are set for these columns:
- City > Seattle
- State > WA
- Country/Region > US
- Population > Large
Now let's examine what happens when each column is used in Power BI. When visuals group on the following columns, here are the results:
- City - Power BI displays all the cities by clearing all the default members for City, State, Country/Region but preserves the default member for Population; Power BI cleared the entire ARP for City.
Note
Population isn't in the ARP path of City, it's solely related to State and thus Power BI doesn't clear it.
- State - Power BI displays all the States by clearing all default members for City, State, Country/Region and Population.
- Country/Region - Power BI displays all the countries/regions by clearing all default members for City, State and Country/Region, but preserves the default member for Population.
- City and State - Power BI clears all default members for all columns.
Groups displayed in the visual have their entire ARP path cleared.
If a group isn't displayed in the visual, but is part of the ARP path of another grouped-on column, the following applies:
- Not all branches of the ARP path are cleared automatically.
- That group is still filtered by that uncleared default member.
Slicers and filter cards
When you work with slicers or filter cards, the following behavior occurs:
- When a slicer or filter card is loaded with data, Power BI groups on the column in the visual, so the display behavior is the same as described in the previous section.
Since slicers and filter cards are often used to interact with other visuals, the logic of clearing default members for the affected visuals occurs as explained in the following table.
For this table, we use the same example data from earlier in this article:
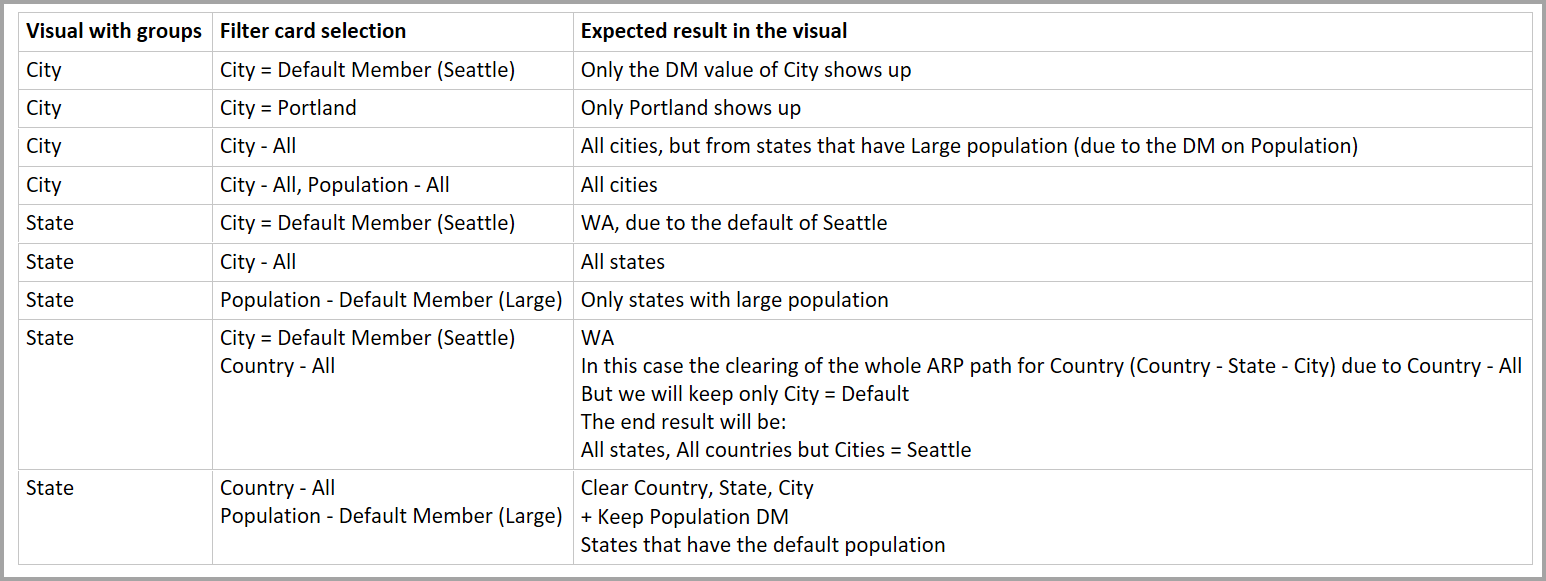
The following rules apply to the way Power BI behaves in these circumstances.
Power BI clears a default member for a specified column, if:
- Power BI groups on that column.
- Power BI groups on a column related to that column (anywhere in the ARP, up or down).
- Power BI filters on a column that's in the ARP (up or down).
- The column has a filter card with ALL stated.
- The column has a filter card with any value selected (Power BI receives a filter for the column).
Power BI doesn't clear a default member for a specified column, if:
- The column has a filter card with default stated, and Power BI is grouping on a column in its ARP.
- The column is above another column in the ARP, and Power BI has a filter card for that other column in default state.
Related content
This article described the behavior of Power BI when working with default members in multidimensional models. You might also be interested in the following articles:
Feedback
Coming soon: Throughout 2024 we will be phasing out GitHub Issues as the feedback mechanism for content and replacing it with a new feedback system. For more information see: https://aka.ms/ContentUserFeedback.
Submit and view feedback for