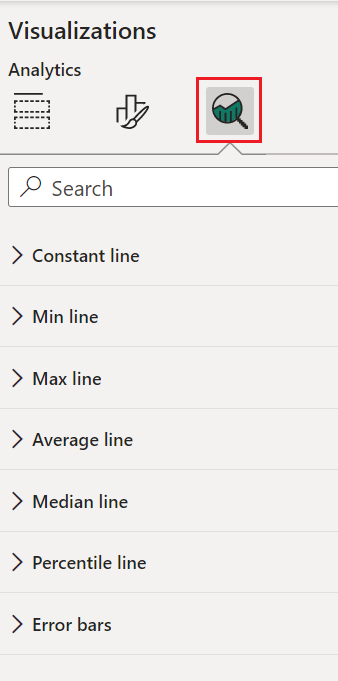
The Analytics pane in Power BI visuals
The Analytics pane allows you to add dynamic reference lines, like min, max, or average, to your visuals. These lines can help you zoom in on important trends or insights. This article discusses how to create Power BI visuals that can present and manage dynamic reference lines in the Analytics pane.
Note
The Analytics pane is available in API version 2.5.0. To find out which version you’re using, check the apiVersion in the pbiviz.json file.
Manage the Analytics pane
Managing properties in the Analytics pane is similar to the managing properties in the Format pane. You define an object in the visual's capabilities.json file.
For the Analytics pane, the object is defined as follows:
Under the object's definition, add only the object name, property name and type as explained here. Example:
{
  "objects": {
    "YourAnalyticsPropertiesCard": {
      "properties": {
        "show": {
          "type": {
            "bool": true
          }
        },
        "displayName": {
          "type": {
            "text": true
          }
        },
      ... //any other properties for your Analytics card
      }
    }
  ...
  }
}
In the formatting settings card, specify that this card belongs to the analytics pane by setting the set card analyticsPane parameter to true. By default, analyticsPane parameter is false and the card will be added to formatting pane. See the following implementations:
class YourAnalyticsCardSettings extends FormattingSettingsCard {
    show = new formattingSettings.ToggleSwitch({
        name: "show",
        displayName: undefined,
        value: false,
        topLevelToggle: true
    });

    displayNameProperty = new formattingSettings.TextInput({
        displayName: "displayName",
        name: "displayName",
        placeholder: "",
        value: "Analytics Instance",
    });

    name: string = "YourAnalyticsPropertiesCard";
    displayName: string = "Your analytics properties card's name";
    analyticsPane: boolean = true; // <===  Add and set analyticsPane variable to true
    slices = [this.show, this.displayNameProperty];
}
Define other properties the same way that you do for Format objects, and enumerate objects just as you do in the Format pane.
Note
- Use the Analytics pane only for objects that add new information or shed new light on the presented information (for example, dynamic reference lines that illustrate important trends).
- Any options that control the look and feel of the visual (that is, formatting) should be limited to the Formatting pane.
Considerations and limitations
- The Analytics pane has no multi-instance support yet. The only selector an object can have is static (that is,
selector: null), and Power BI visuals can't have multiple instances of a user-defined card. - Properties of type
integeraren't displayed correctly. As a workaround, use typenumericinstead.
Related content
Feedback
Coming soon: Throughout 2024 we will be phasing out GitHub Issues as the feedback mechanism for content and replacing it with a new feedback system. For more information see: https://aka.ms/ContentUserFeedback.
Submit and view feedback for