Configure Azure Log Analytics for Power BI
Power BI is integrating with Azure Log Analytics to enable administrators and Premium workspace owners to configure a Log Analytics connection to their Power BI subscription. This article describes how the integration between Log Analytics and Power BI works and how to configure it for your environment.
There are two elements to getting Azure Log Analytics working for Power BI:
- Configure your Azure subscription in the Azure portal.
- Enable Log analytics for Power BI in the Power BI Admin portal.
The following sections take you through the steps in to do both.

Prerequisites
Before you can configure Log Analytics integration from Power BI, you need to create a Log Analytics Workspace in the Azure portal. You must also give permission in Azure for the Power BI service to write logs. The exact requirements are:
- Contributor access to Azure subscription.
- Register the 'microsoft.insights' resource provider in the Azure subscription where you'll collect Power BI log data.
- The user who sets up Log Analytics integration in Power BI must be in the Log Analytics Contributor role for the Log Analytics Workspace. See FAQ for workarounds if the Owner role can't be given.
Enable the 'microsoft.insights' resource provider
Log Analytics requires the 'microsoft.insights' resource provider enabled at the Azure subscription level. The following steps take you through the process.
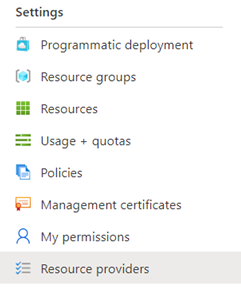
Sign in to the Azure portal, select the subscription you want to use with Log Analytics and that contains your Log Analytics workspaces. In the Settings section, select Resource providers as shown in the following image.
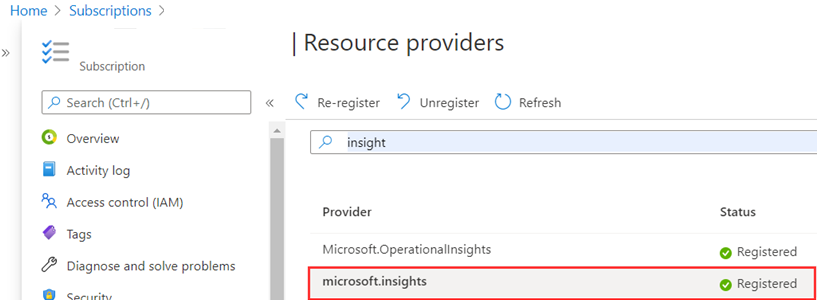
Search for microsoft.insights under Resource providers. Then select Register.
Set permissions
Make sure the user configuring Log Analytics integration has Log Analytics Contributor role of the Log Analytics workspace. When you select Access control (IAM) for the subscription in the Azure portal, and then select Role assignments from the top selections in the panel, the current user must see one entry: Log Analytics Contributor for the user who configures Log Analytics:

After you complete those steps, the Azure Log Analytics configuration portion is complete. The next section shows you how to continue and complete the configuration in the Power BI Admin portal.
Allow Workspace-level logging from the Admin Portal
A Power BI administrator must complete the following step to enable Azure Log Analytics for Power BI Premium workspaces. This setting allows Power BI Premium workspace administrators to send their workspace logs to Azure Log Analytics when the prerequisites have been met.
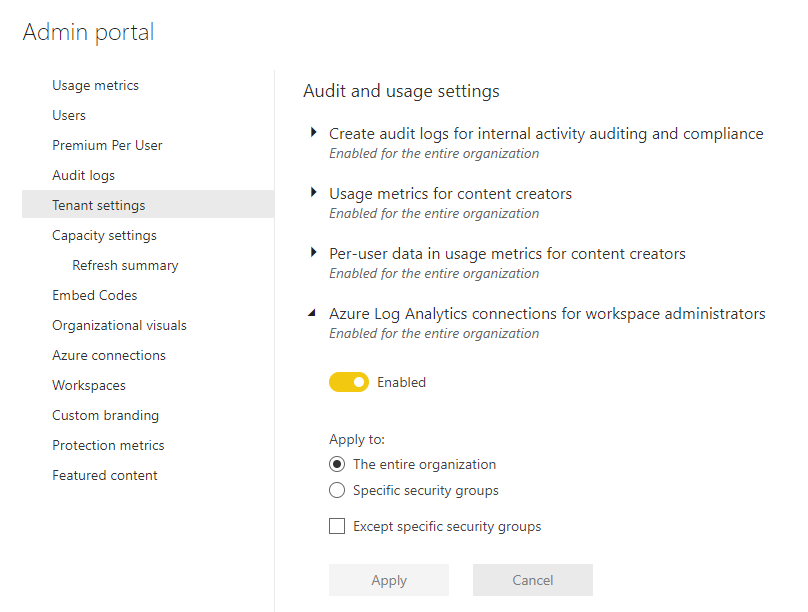
In the Power BI Admin portal, go to Tenant Settings > Audit and usage settings, and expand Azure Log Analytics connections for workspace administrators. To allow workspace admins to enable Log Analytics, set the slider to Enabled and specify the needed security groups under Apply to, as shown in the following image.
Configure logging in a Premium Workspace
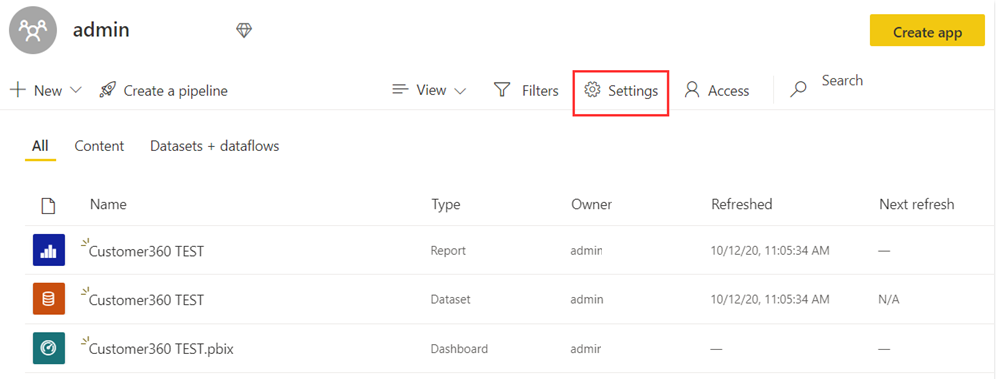
In the Premium workspace, workspace admins can enable Log Analytics. To do so, go to Settings as shown in the following image.
In the Settings pane, select Azure connections, then expand Log Analytics as shown in the following image.
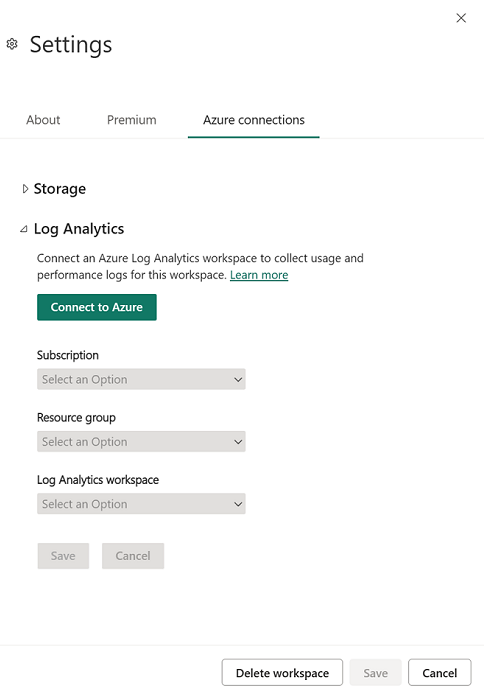
Select the Azure subscription, Resource group, and then the Log Analytics workspace configured in the previous section. Then choose Save. When successfully completed, the expanded Tenant-level Log Analytics section should look similar to the following image.
Disconnect Azure Log Analytics
You can disconnect from Azure Log Analytics to stop sending logs to Azure. To disconnect, in the Power BI Workspace Settings, go to the Log Analytics settings. Select Disconnect from Azure. Then choose Save to disconnect.

Note
When you disconnect a Power BI workspace from Azure Log Analytics, logs are not deleted. Your data remains and follows the storage and retention policies you set there.
Usage scenarios
There are many ways that Azure Log Analytics and Power BI can help solve real-world challenges for your organization. Consider the following:
- Identify periods of high or unusual Analysis Services engine activity by capacity, workspace, report, or user.
- Analyze query performance and trends, including external DirectQuery operations.
- Analyze semantic model refresh duration, overlaps, and processing steps.
- Analyze custom operations sent using the Premium XMLA endpoint.
Send us feedback in the Power BI Community for how you're using logging and how it has helped your organization.
Error conditions and resolutions
The following table provides a collection of common errors, the events or configurations that triggered them, and suggested resolutions.
| Trigger Condition | Type | Message |
|---|---|---|
| You don't have permission to write to the Log Analytics Workspace | Error - cannot proceed | You need write permissions on this Log Analytics workspace to connect it to Power BI. Contact the person in your organization who manages Azure subscriptions to fix this problem. |
| You don't have permission to write to the Log Analytics workspace account | Error - cannot proceed | You need write permissions on this Log Analytics workspace to connect it to Power BI. |
| You don't have access to any Azure subscriptions | Error - cannot proceed | You don't have access to any Azure subscriptions. Ask the person who manages Azure subscriptions in your organization to grant you contributor access or higher. |
| You don't have access to any Azure Log Analytics workspaces within that subscription | Error - cannot proceed | You don't have access to an Azure Log Analytics workspace. Ask the person who manages Azure subscriptions in your organization to add you to the Log Analytics owner or contributor role. |
| Workspace-level Log Analytics disabled when trying to connect | Information | Ask your tenant admin to grant workspace admins permission to connect Log Analytics workspaces. |
| Workspace-level Log Analytics disabled when trying to disconnect | Information | Your tenant admin revoked permission for workspace admins to connect their own Azure Log Analytics workspaces. If you disconnect, you can't connect to another one. |
Events and schema
After you enable Azure Log Analytics, it starts to log the following event categories. For more information on these events, see Analysis Services Trace Events.
- AggregateTableRewriteQuery
- Command
- Deadlock
- DirectQuery
- Discover
- Error
- ProgressReport
- Query
- Session Initialize
- VertiPaqSEQuery
- Notification
The following table describes the schema.
| Property | Existing Azure Analysis Services property | Description |
|---|---|---|
| TimeGenerated | The timestamp (UTC) of when the log was generated. | |
| OperationName | EventClass_s | The operation associated with the log record. |
| CorrelationId | The ID for correlated events. Can be used to identify correlated events between multiple tables. | |
| PowerBIWorkspaceId | Unique identifier of the workspace containing the artifact being operated on. | |
| PremiumCapacityId | Unique identifier of the Premium capacity hosting the artifact being operated on. | |
| ApplicationContext | ApplicationContext_s | Property bag of unique identifiers providing details about the application executing the request. for example, report ID. |
| ApplicationName | ApplicationName_s | Contains the name of the client application that created the connection to the server. This column is populated with the values passed by the application rather than the displayed name of the program. |
| ArtifactId | Unique identifier of the resource logging the data. | |
| ArtifactKind | Type of artifact logging the operation, for example, semantic model. | |
| CpuTimeMs | CPUTime_s | Amount of CPU time (in milliseconds) used by the event. |
| ArtifactName | DatabaseName_s | The name of the Power BI artifact logging this operation. |
| LogAnalyticsCategory | Unique | Category of the events, like Audit/Security/Request. |
| DatasetMode | The mode of the semantic model. Import, DirectQuery, or Composite. | |
| DurationMs | Duration_s | Amount of time (in milliseconds) taken by the operation. |
| User | User_s | The user associated with the running operation. Used when an end-user identity must be impersonated on the server. |
| ExecutingUser | EffectiveUsername_s | The user running the operation. |
| OperationDetailName | EventSubclass_s | More details about the operation. |
| XmlaObjectPath | ObjectPath_s | Object path. A comma-separated list of parents, starting with the object's parent. |
| PowerBIWorkspaceName | Name of the Power BI workspace containing the artifact. | |
| StatusCode | Error_s | Status code of the operation. It covers success and failure. |
| ProgressCounter | ProgressTotal_s | Progress counter. |
| XmlaProperties | RequestProperties_s | Properties of the XMLA request. |
| XmlaSessionId | SPID_s | Analysis Services session identifier. |
| Level | Severity_s | Contains the severity level of the operation being logged. Success, Informational, Warning, or Error. |
| Identity | Information about user and claims. | |
| Status | Status of the operation. | |
| EventText | TextData_s | Contains verbose information associated with the operation, for example, DAX Query. |
| CustomerTenantId | Customer's Power BI tenant identifier. | |
| XmlaRequestId | RootActivityId_g | Unique Identifier of request. |
| ReplicaId | Replica identifier that will let you identify the replica when Query Scale Out (QSO) is enabled. Read-write replica always has ReplicaId='AAA' and read-only replicas have ReplicaId starting 'AAB' onwards. For non-QSO enabled semantic models the ReplicaId is always 'AAA' |
ExecutionMetrics event
For every Discover, Command and Query request, an event named ExecutionMetrics is produced at the end of the request. This event contains execution metrics for the request, which can assist you in diagnosing and troubleshooting more effectively. The ExecutionMetrics trace is correlated with the nearest [Discover|Command|Query]End event.
The following KQL query retrieves the ExecutionMetrics events for all refresh operations of a Semantic Model in the last day:
let commands = PowerBIDatasetsWorkspace
    | where TimeGenerated > ago(1d)
    | where ArtifactId =~ "[Semantic Model Id]"
    | where OperationName in ("CommandEnd")
    | where EventText contains "<Refresh"
    | project TimeGenerated, ArtifactId, CommandOperationName = OperationName, XmlaRequestId, CorrelationId, CommandText = EventText;
let executionMetrics = PowerBIDatasetsWorkspace
    | where OperationName == "ExecutionMetrics"
    | project TimeGenerated, XmlaRequestId, CorrelationId, EventText;
commands
| join kind=leftouter executionMetrics on XmlaRequestId
The following KQL query retrieves events that were throttled in the last day by workspace, item, and user:
let executionMetrics = PowerBIDatasetsWorkspace
    | where TimeGenerated > ago(1d)
    | where OperationName == "ExecutionMetrics"
    | extend eventTextJson = parse_json(EventText)
    | extend capacityThrottlingMs=toint(eventTextJson.capacityThrottlingMs)
    | where capacityThrottlingMs > 0;
let commands = PowerBIDatasetsWorkspace
    | where OperationName in ("CommandEnd", "QueryEnd", "DiscoverEnd")
    | project
        TimeGenerated,
        ExecutingUser,
        ArtifactId,
        PowerBIWorkspaceId,
        CommandOperationName = OperationName,
        XmlaRequestId,
        CorrelationId,
        CommandText = EventText;
commands
| join kind=inner executionMetrics on XmlaRequestId
| project
    TimeGenerated,
    ArtifactId,
    PowerBIWorkspaceId,
    ExecutingUser,
    CommandOperationName,
    XmlaRequestId,
    EventText,
    CommandText,
    capacityThrottlingMs
| summarize countThrottling = count(), avgThrottlingDuration = avg(capacityThrottlingMs) by PowerBIWorkspaceId, ArtifactId, ExecutingUser, CommandOperationName
The statistics are presented as a JSON text in the EventText property, see the following examples.
{
    "timeStart": "2024-03-20T12:39:59.681Z",
    "timeEnd": "2024-03-20T13:01:14.241Z",
    "durationMs": 1274559,
    "vertipaqJobCpuTimeMs": 156,
    "mEngineCpuTimeMs": 9617484,
    "totalCpuTimeMs": 9618469,
    "executionDelayMs": 10,
    "approximatePeakMemConsumptionKB": 1683409,
    "mEnginePeakMemoryKB": 1676816,
    "tabularConnectionTimeoutMs": 18000000,
    "refreshParallelism": 16,
    "vertipaqTotalRows": 114,
    "intendedUsage": 2
}
Feedback
Coming soon: Throughout 2024 we will be phasing out GitHub Issues as the feedback mechanism for content and replacing it with a new feedback system. For more information see: https://aka.ms/ContentUserFeedback.
Submit and view feedback for