View analytics for desktop flows
As an admin, you will need to view the overall status of automation that runs in your organization. There are two options to monitor the analytics for automation that's built with desktop flows:
- The Power Platform admin center.
- The Center of Excellence (CoE) Starter Kit.
This article discusses the viewing desktop flows analytics reports in the Power Platform admin center.
The easiest option for an admin to view analytics for the desktop flows in their organization is to visit Power Platform admin center. You'll find the following three reports:
| Report | Description |
|---|---|
| Runs | This report gives you an overview of the daily, weekly, and monthly desktop flows run statistics. This report also provides trend lines and run results (success/failure/cancel). This report gives insights on how actively desktop flows are used in each environment. |
| Usage | This report shows you the desktop flows that are being used most, giving you insights into your automation inventory. |
| Created | This report shows you analytics against recently created desktop flows, giving you insights into your most active desktop flows makers. |
Data storage
When a user creates an environment in a region, the environment is hosted in that region. All data for that environment resides within that region for a maximum period of 28 days.
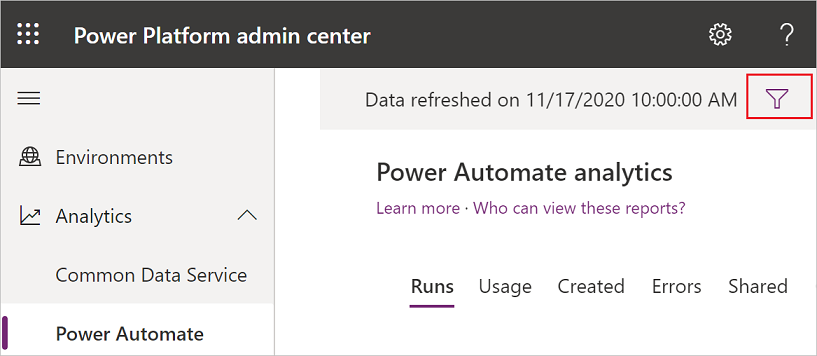
The data refresh cycle is about 24 hours and you can find the last refresh time at the top-right corner of the page.
Prerequisites
You must have the environment admin privilege to access the Power Platform admin center reports.
To access the reports:
Sign into Power Automate.
Note
You may have to select your country/region if it's your first time signing in.
Select the Settings icon > Admin Center.

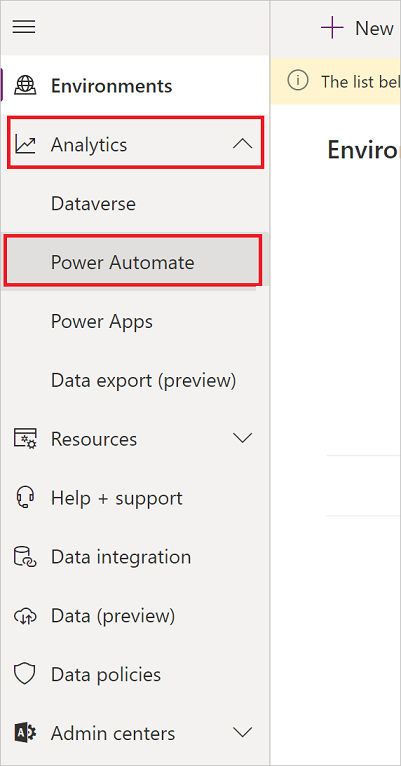
Expand Analytics, and then select Power Automate.
Select Desktop flows.
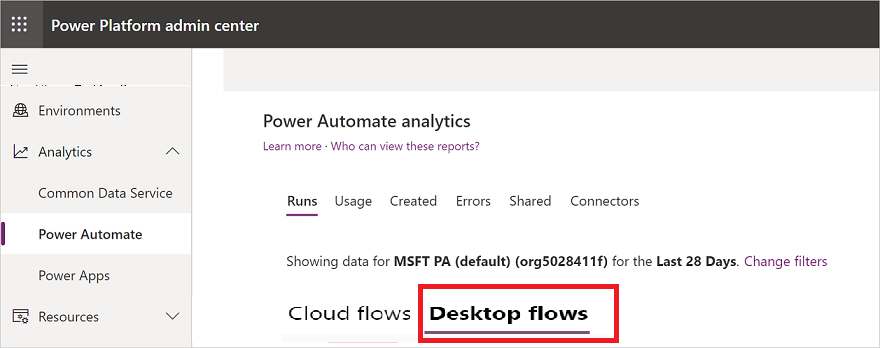
View the reports.

Filter your view
You can filter your view to display reports from a specific environment or for a specific Time period
Select the filter icon.
Expand the Environment list, and then select the environment for which you'd like to view reports.
Expand the Time period list, and then select the number of days for which you'd like to view reports.
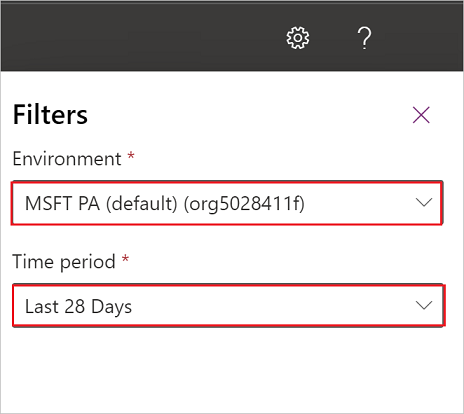
Select Apply.
View the runs report
Select Runs.
Filter the view to display the Runs reports from a specific environment and for a specific time period.
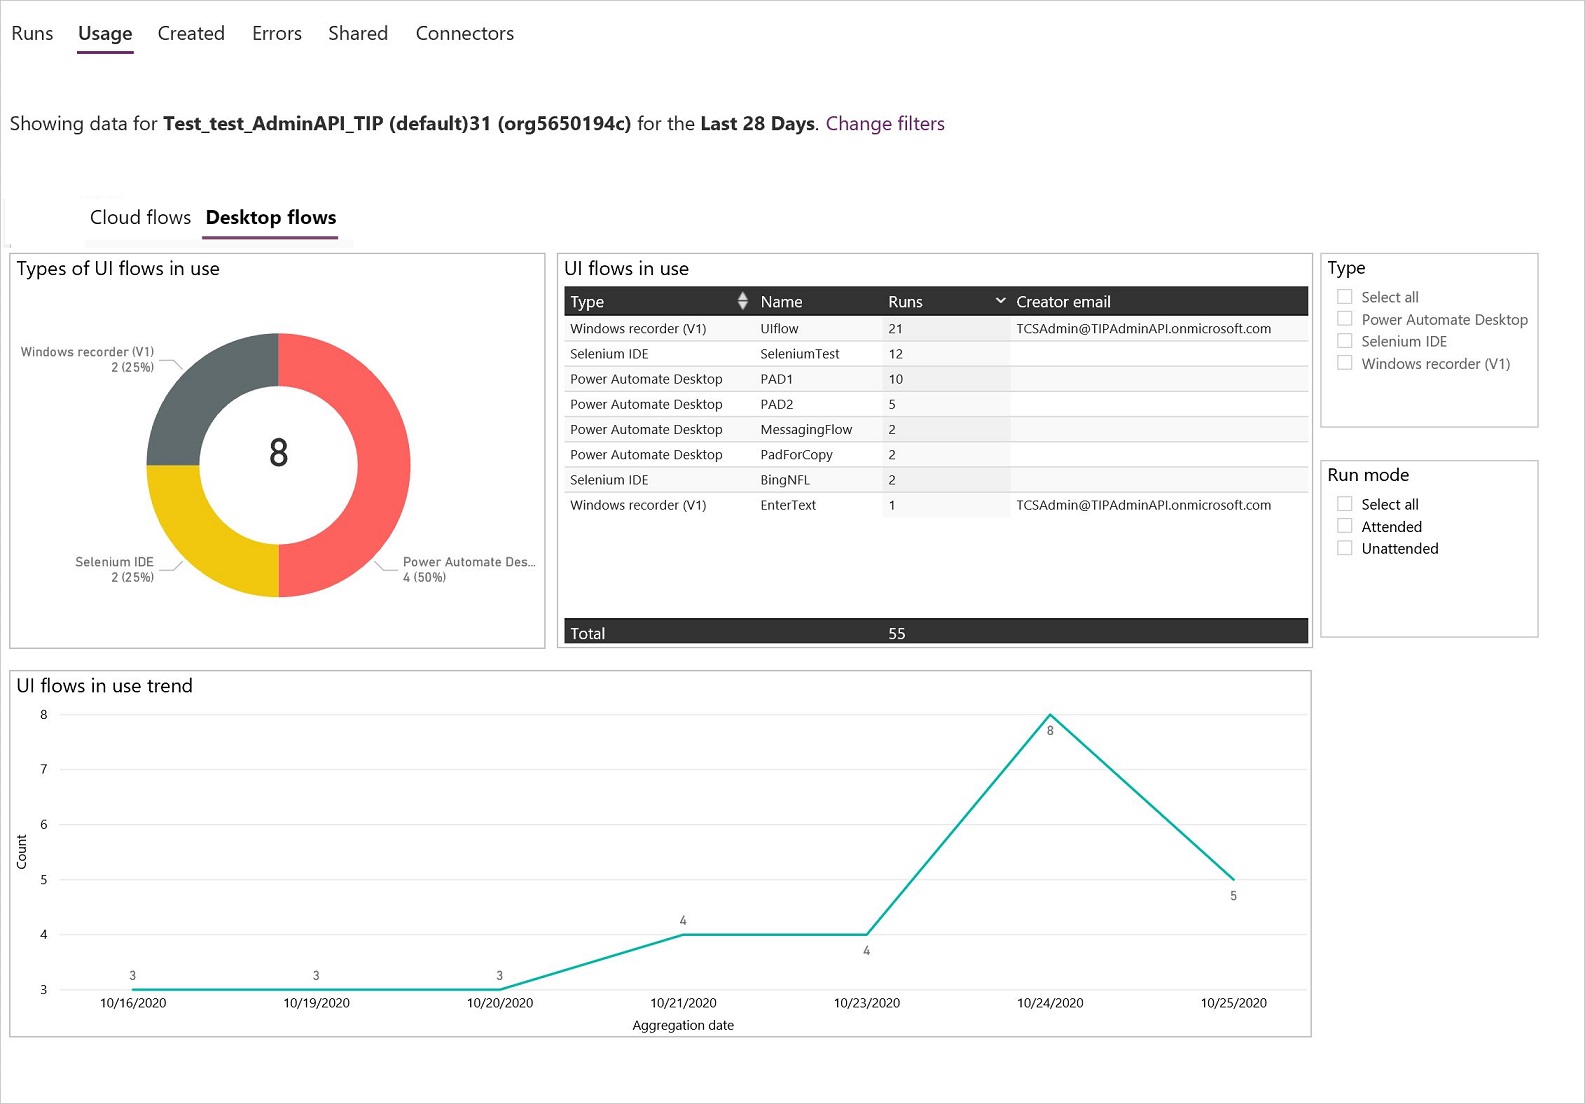
View the usage report
Select Usage.

Filter the view to display the Usage reports from a specific environment and for a specific time period.
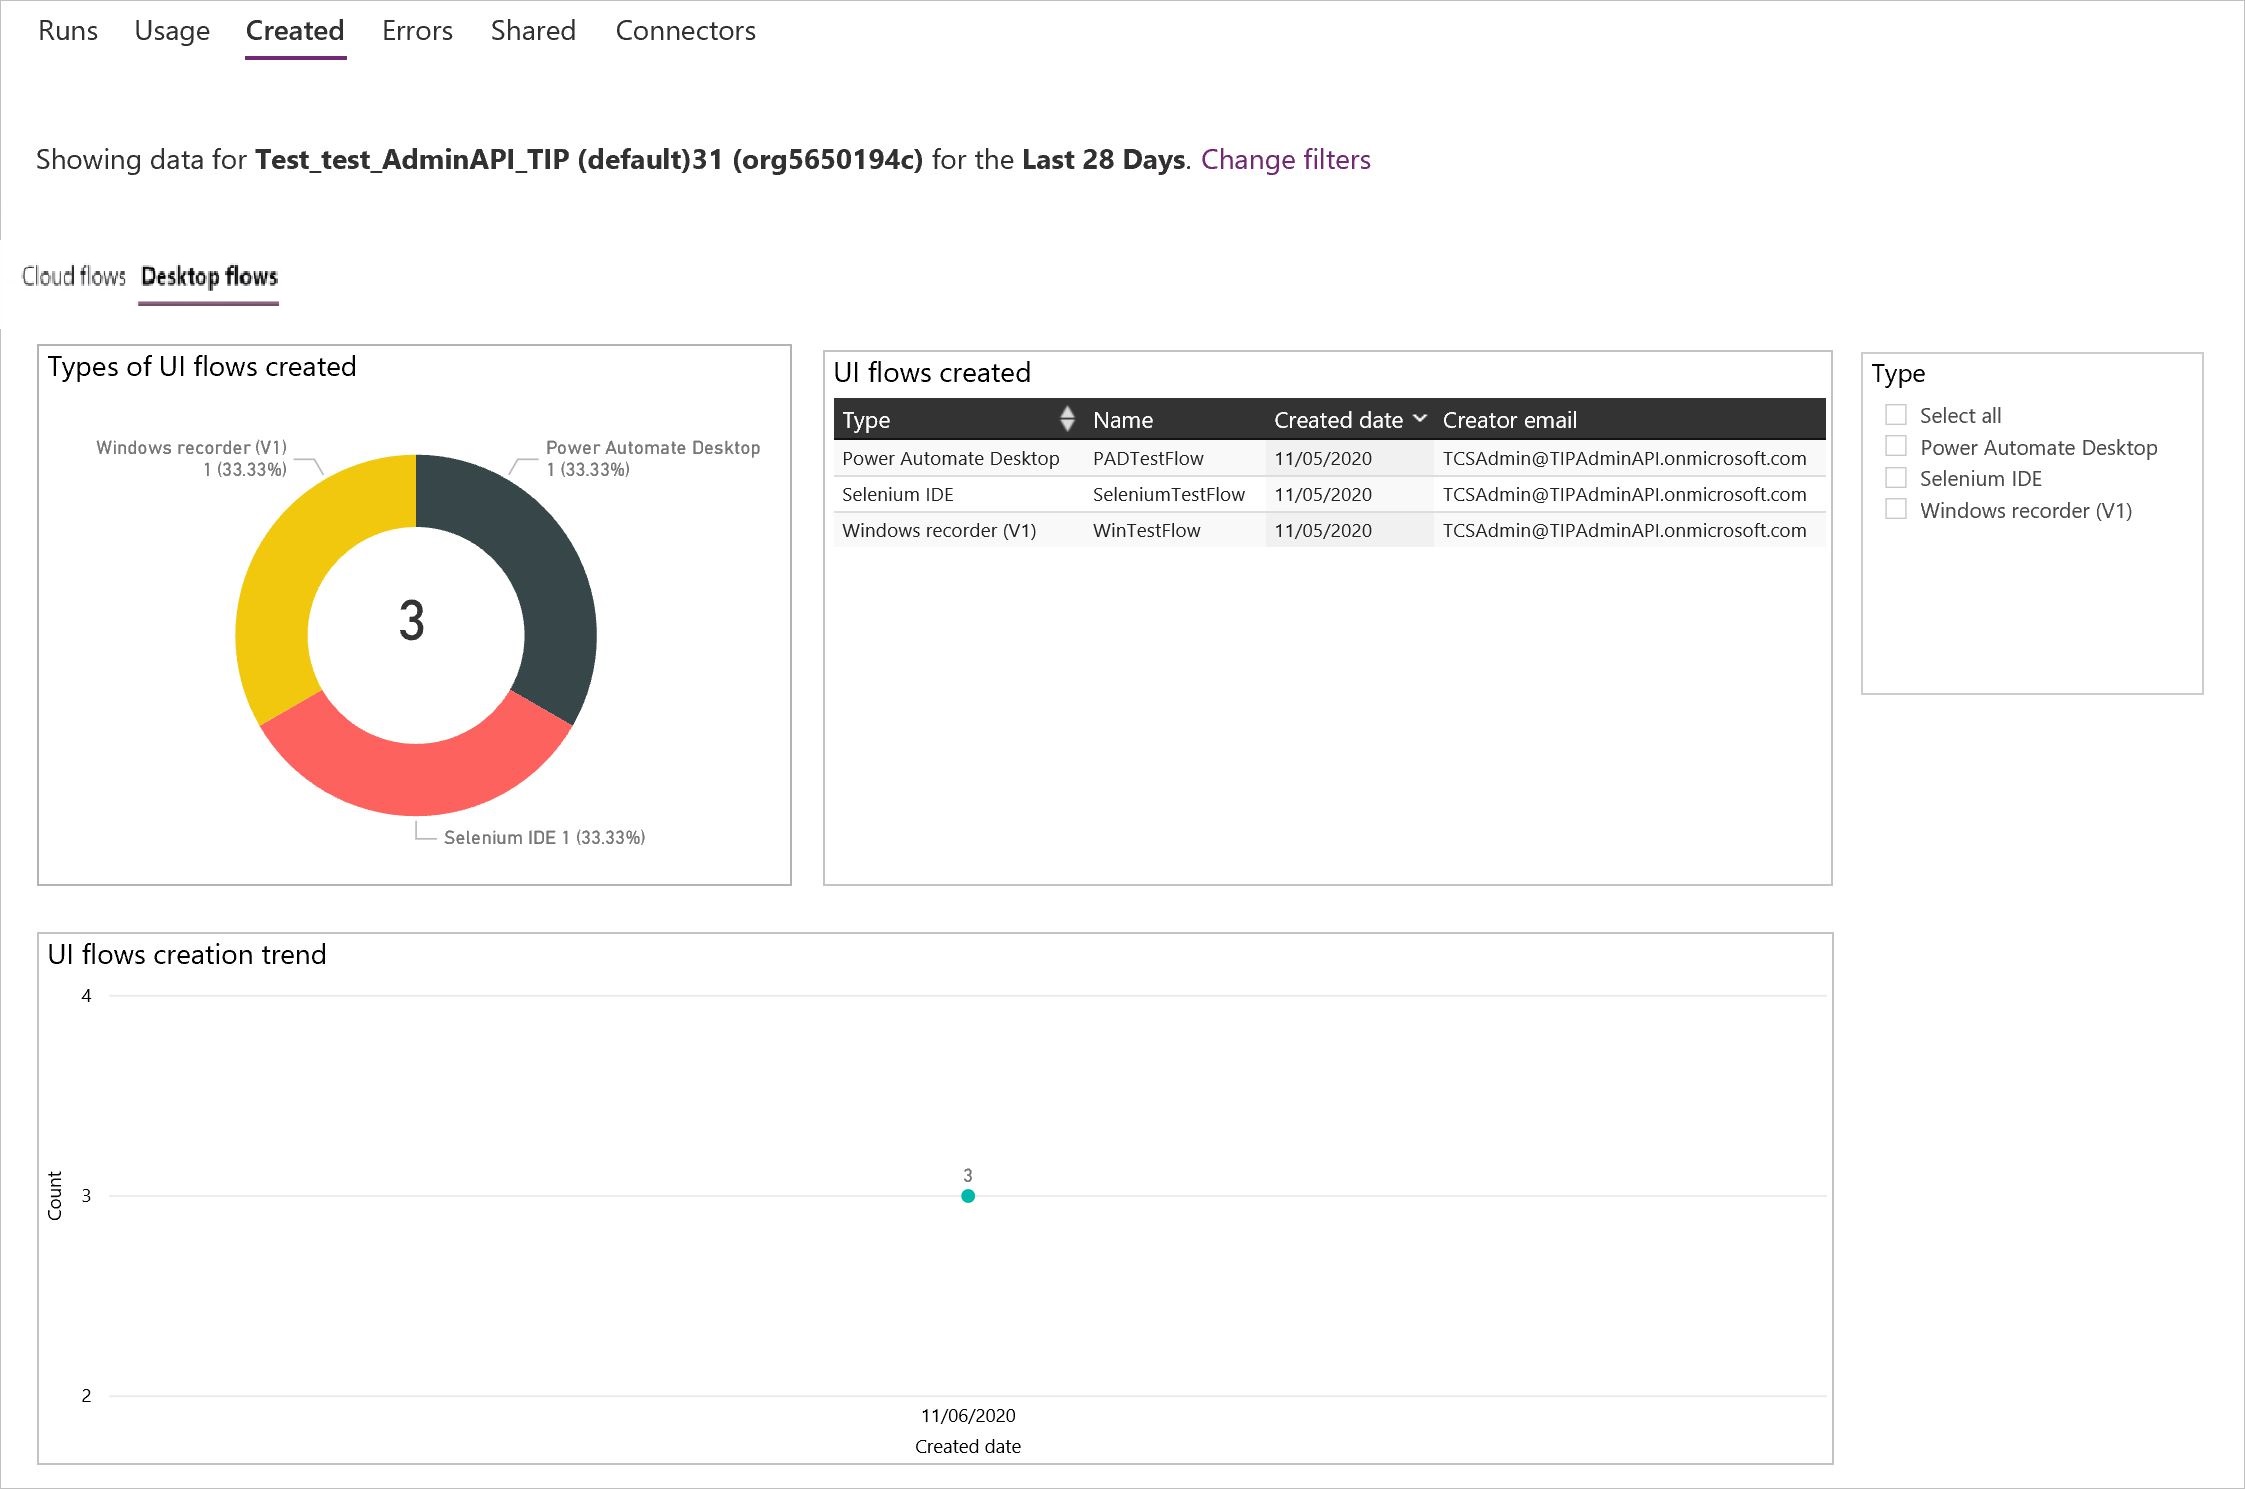
View the created report
Important
You must upgrade the Power Automate Desktop (preview) app to the version of 2.1.43.20312 or later, in order to generate correct data for this report.
Select Created.

Filter the view to display the Created reports from a specific environment and for a specific time period.
Learn more
Feedback
Coming soon: Throughout 2024 we will be phasing out GitHub Issues as the feedback mechanism for content and replacing it with a new feedback system. For more information see: https://aka.ms/ContentUserFeedback.
Submit and view feedback for