Quick Start: ReadyBoot Graphs
For information on collecting ReadyBoot trace data please see the Quick Start: Capturing ReadyBoot Information section of this document.
To view the ReadyBoot graph, open the trace as described in the previous section, Quick Start: Opening the Trace.
Open the Frame List, located on the left side of the graph, by clicking the chevron.
Ensure the "ReadyBoot I/O" selection is checked.
Close the Frame List by clicking the chevron again.
Scroll to the ReadyBoot I/O graph.
Place the cursor on the time line.
Select an approximate time interval in which the ReadyBoot events appear, in this case from about 0 to 30 seconds, by left clicking and dragging from 0 to 30 on the time line. The selection will be highlighted.
Right click on on the highlighted selection to open the context menu and select Zoom to Selection.
The time interval selected will be applied to all of the graphs. This feature provides a consistent view of the time interval being examined across all the graphs, as in the following screen shot.
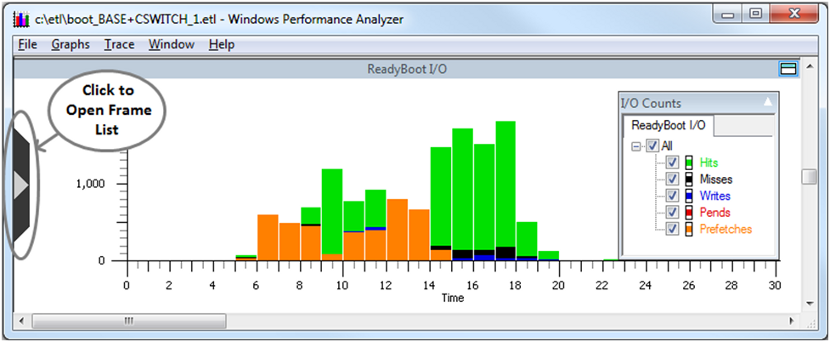
The ReadyBoot I/O graph shows a histogram of ReadyBoot event counts colored by the event type for a selected time period. The dropdown legend menu in the top right corner can be used to filter displayed events by type.