ReadyBoot Summary Table
The "Summary Table" view of the ReadyBoot I/O allows the analyst to see ReadyBoot statistics across all boot phases, as in the following screen shot.
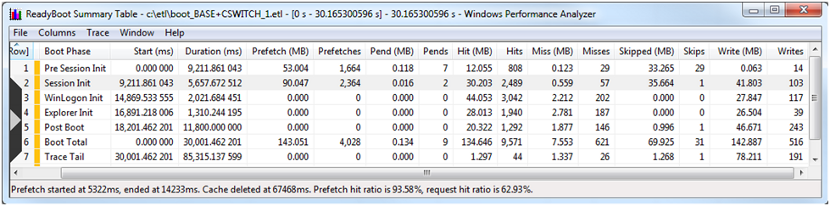
The Summary Table provides an overview of ReadyBoot activity in boot including:
Start times and durations of the boot phases. For a detailed description of the boot phases refer to the Windows On/Off Transitions Solutions Guide.
Data amounts and IO counts for hits, misses, and skips (which together form the actual read footprint) for each boot phase and for the entire boot ("Boot Total" line).
Summary information for all of the various ReadyBoot cache access types described earlier.
The Summary Table's status bar provides additional ReadyBoot statistics including:
ReadyBoot prefetching start and end times
Time at which the ReadyBoot cache was deleted/released
Prefetch hit ratio, which is the ratio of the total size prefetched to the total size hit in the ReadyBoot cache
Request hit ratio, which is a ratio of the total size of read requests (as issues by the system, services, applications, etc) to the total size of ReadyBoot cache hits (read requests could end up as either cache hits or misses)