Debug SharePoint Framework solutions in Visual Studio Code
Visual Studio Code is a popular code editor frequently used for building SharePoint Framework solutions. By setting up debugging of your SharePoint Framework solution in Visual Studio Code, you can more efficiently step through your code and fix errors.
You can also see the required steps to enable debugging in Visual Studio Code in this video on the Microsoft 365 Platform Communtiy (PnP) YouTube Channel:
Prerequisites
The easiest way to configure Visual Studio Code (VS Code) to debug SharePoint Framework solutions is by using the JavaScript Debugger included in VS Code to debug Chrome & Edge.
You also need Google Chrome or Microsoft Edge.
Debug configurations
You can locate the debug configurations in the ./vscode/launch.json file under the Visual Studio Code workspace folder.
Configure a breakpoint
In Visual Studio Code, open the main web part source file, and add a breakpoint in the first line of the
render()method by either selecting the margin that is left to the line number or by highlighting the code line in the editor and selecting the F9 key.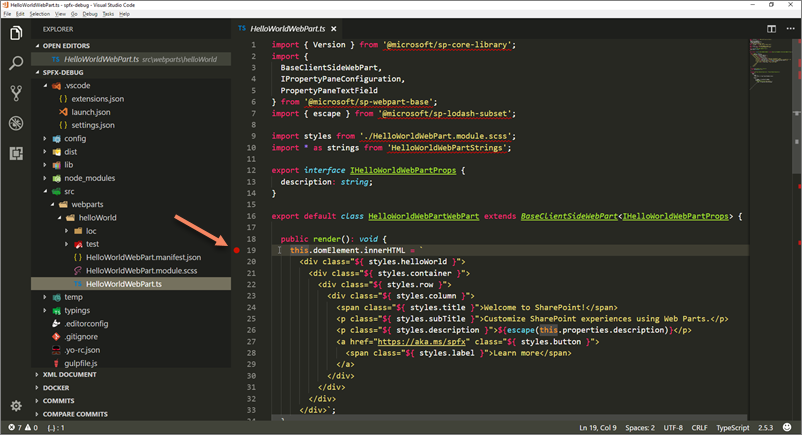
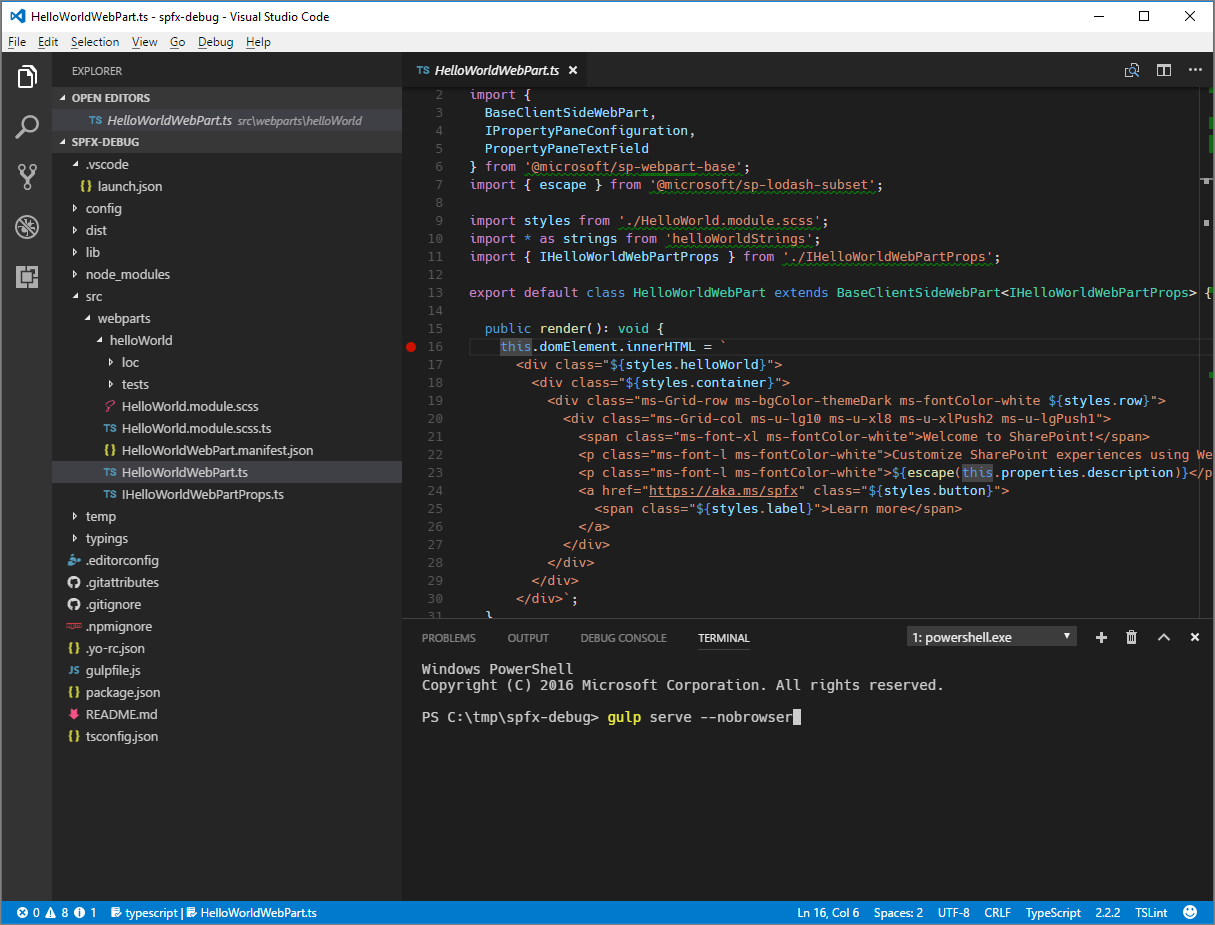
In Visual Studio Code, on the View menu, select the Integrated Terminal option or select ctrl+` on the keyboard.
In the terminal run the following command:
gulp serve --nobrowserRunning this command builds your SharePoint Framework solution and starts the local webserver to serve the output files. Because the debugger starts its own instance of the browser, you use the --nobrowser argument to prevent the serve task from opening a browser window.
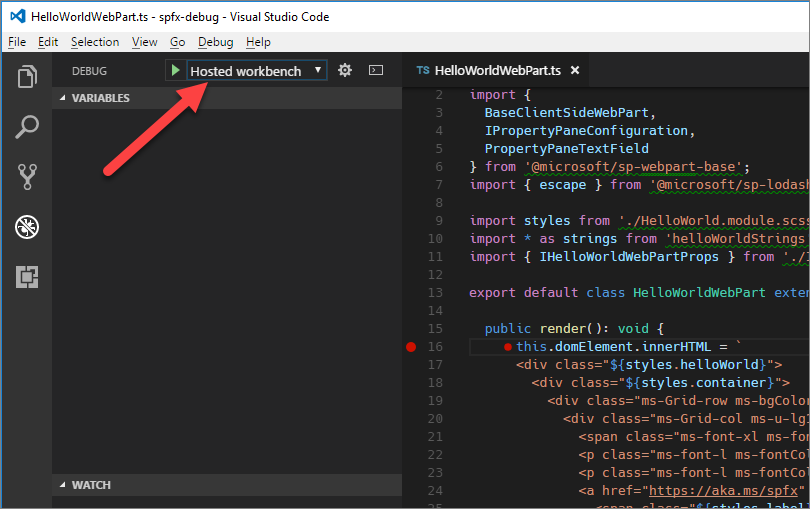
Start debugging in Visual Studio Code
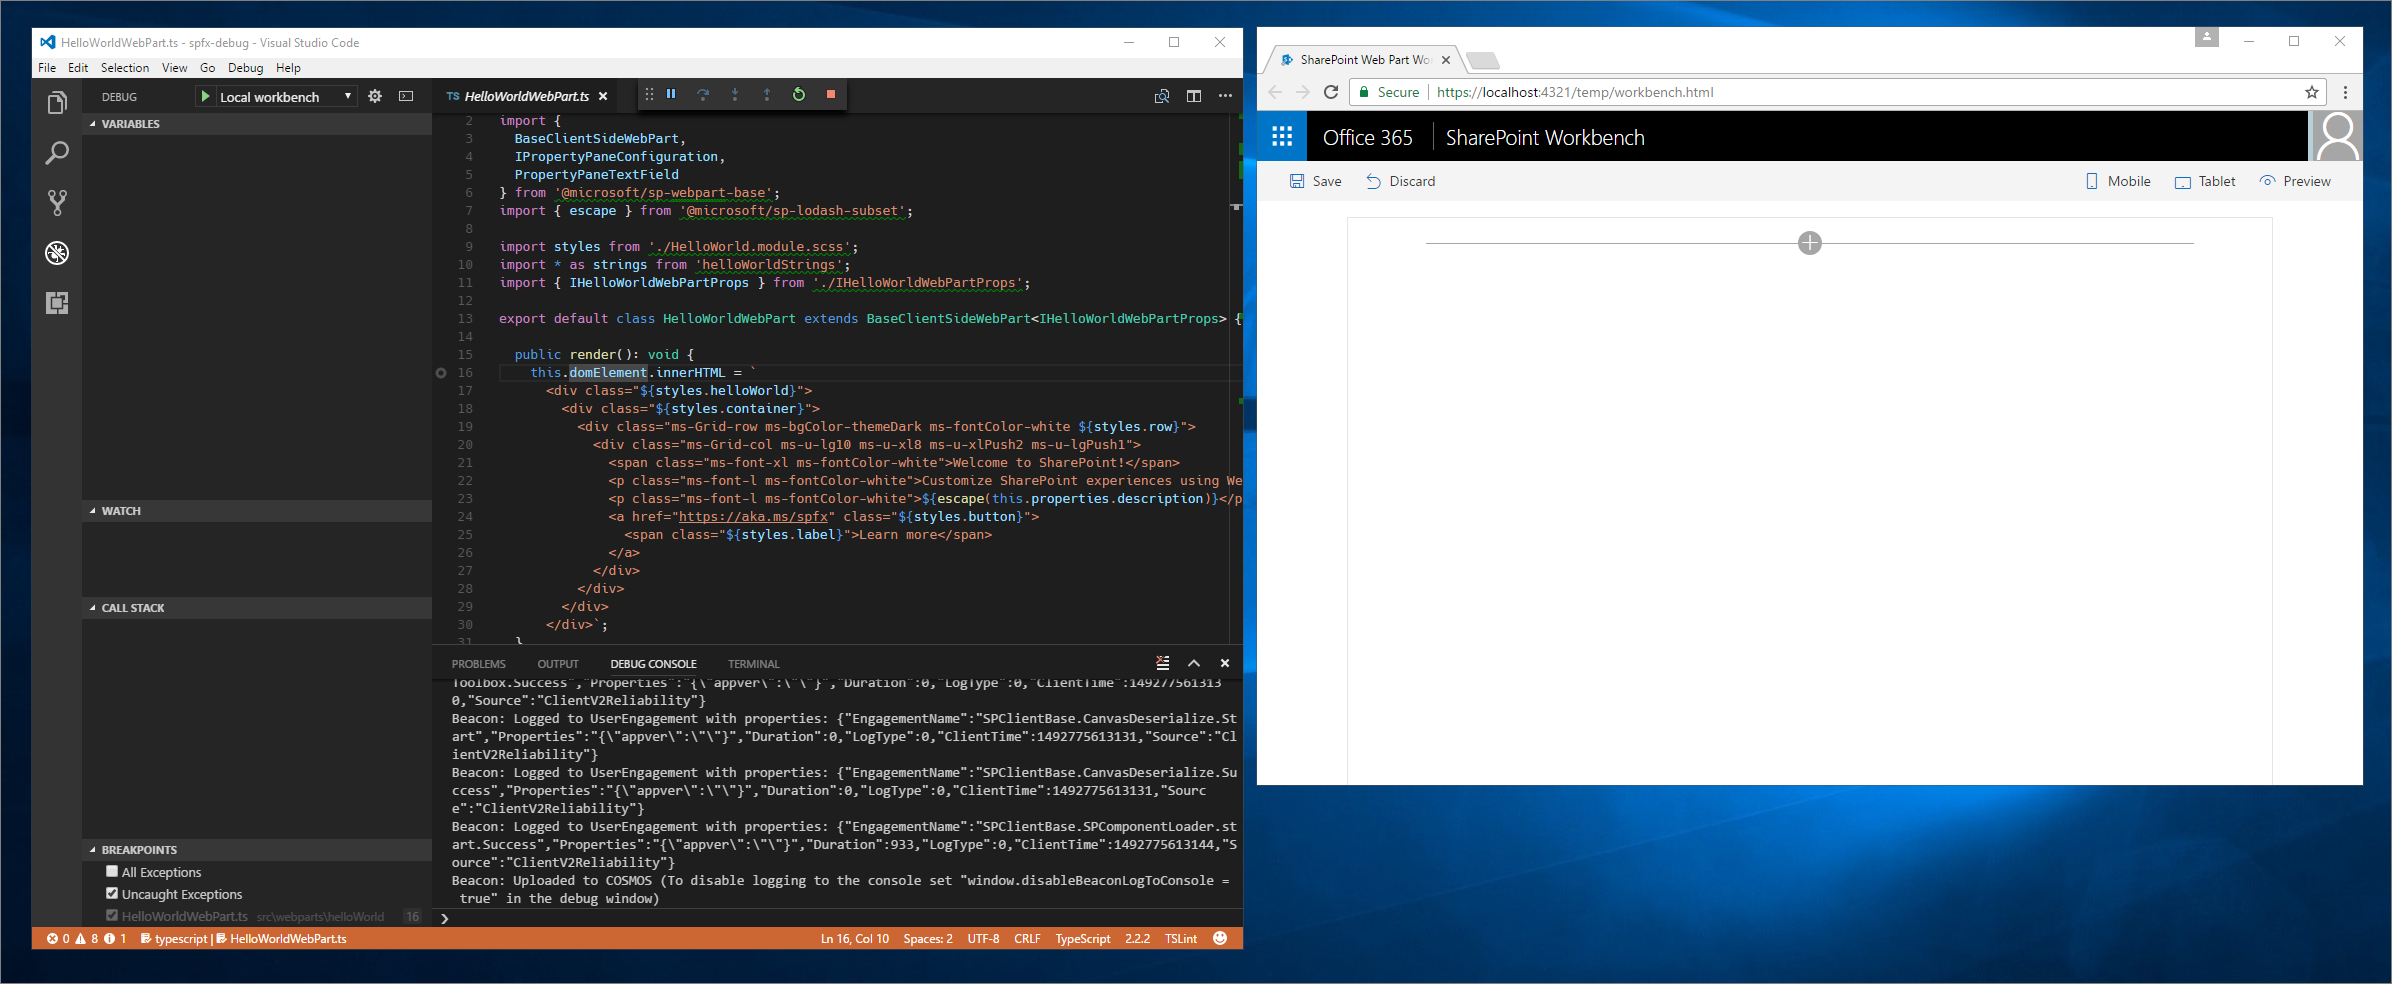
After the gulp task is finished, move the focus to the code area of Visual Studio Code and select F5 (or on the Debug menu, select the Start Debugging option).
The debug mode in Visual Studio Code starts, changing the color of the status bar to orange and opening a new window of Google Chrome showing the SharePoint Workbench.
Note
At this point the breakpoint is disabled because the web part's code hasn't been loaded yet. SharePoint Framework loads web parts on demand only after they have been added to the page.
Add a web part to the canvas
To verify that debugging is working, in the workbench, add your web part to the canvas.
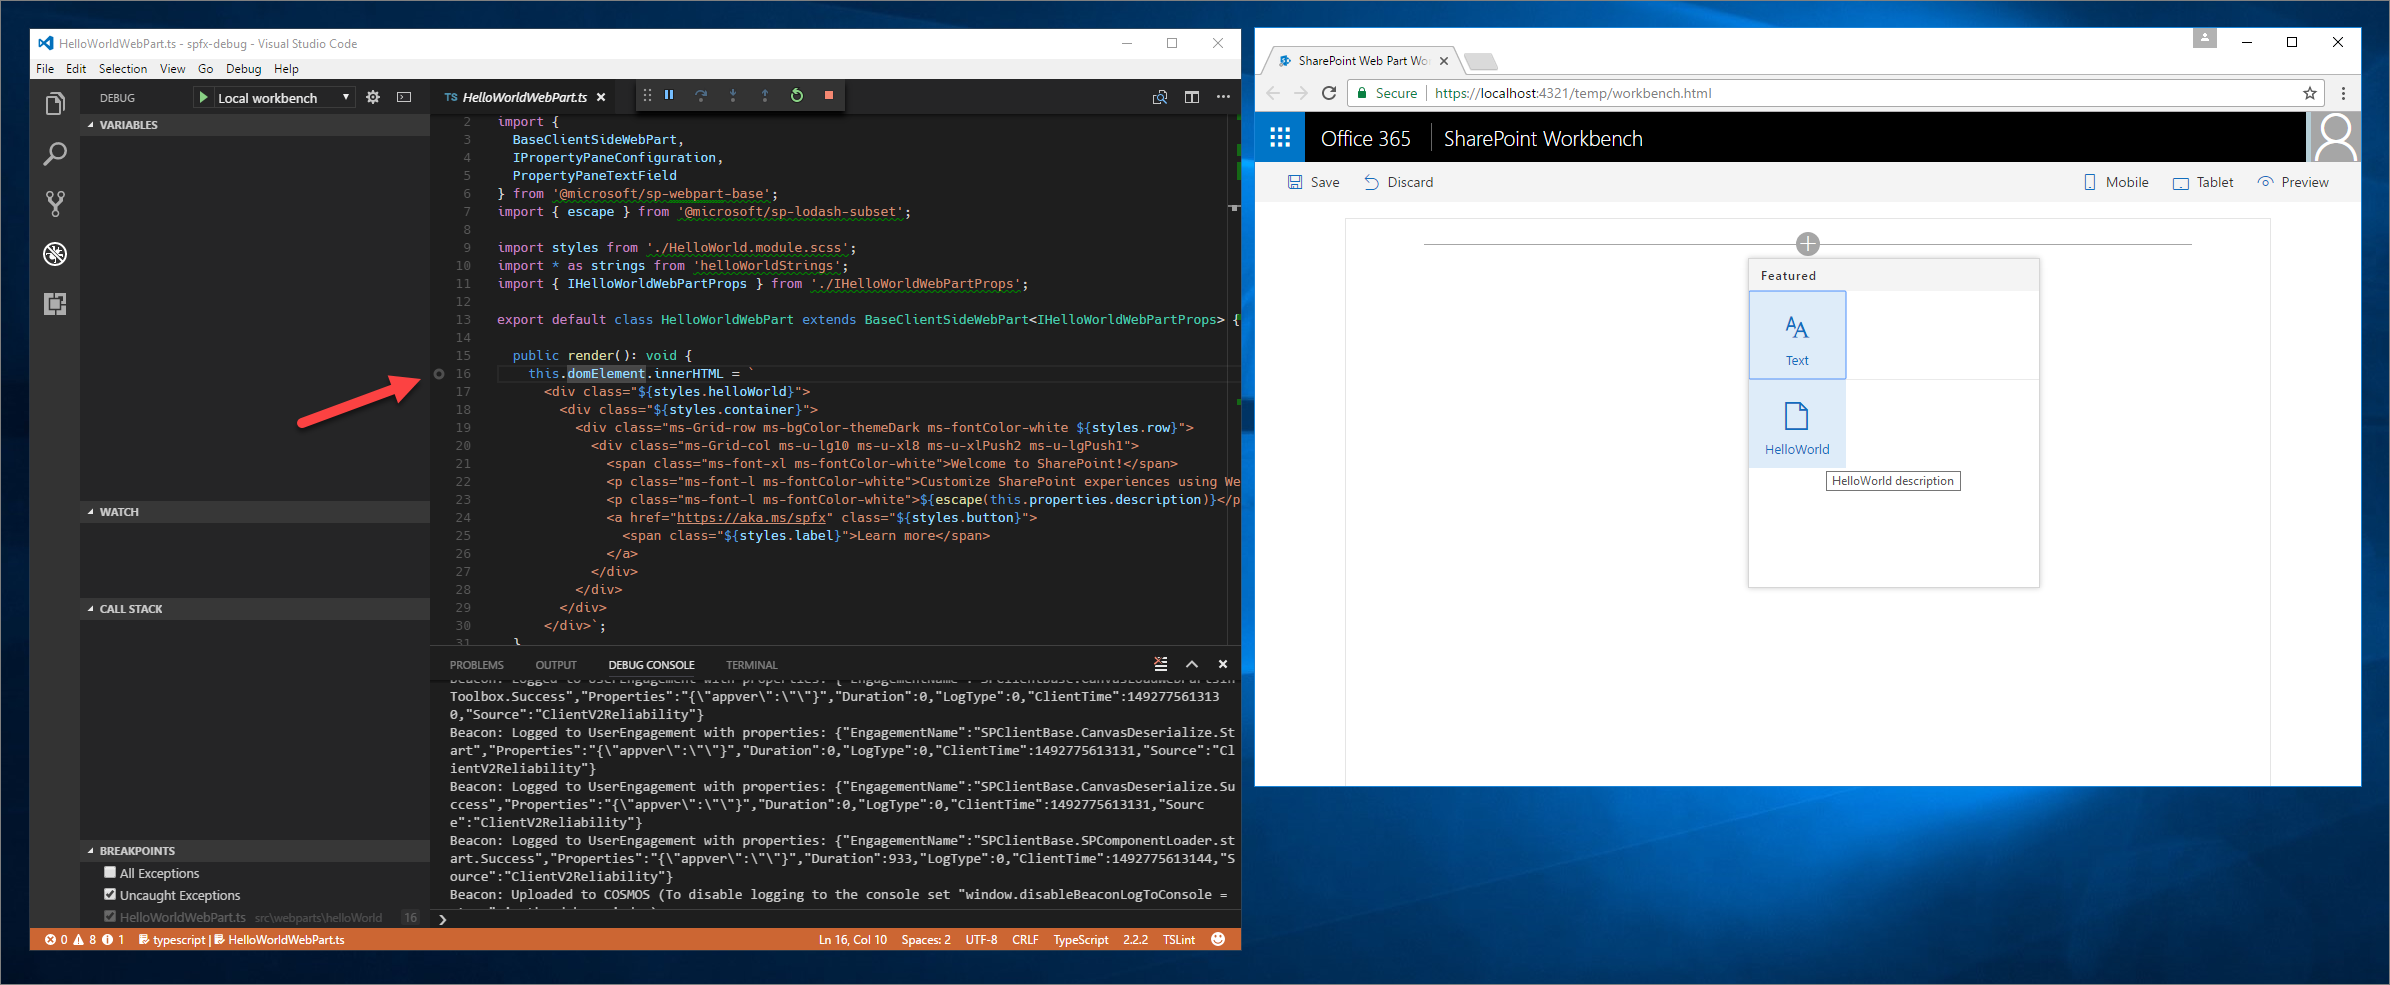
Notice that with the code loaded on the page, the breakpoint indicator changed to active.
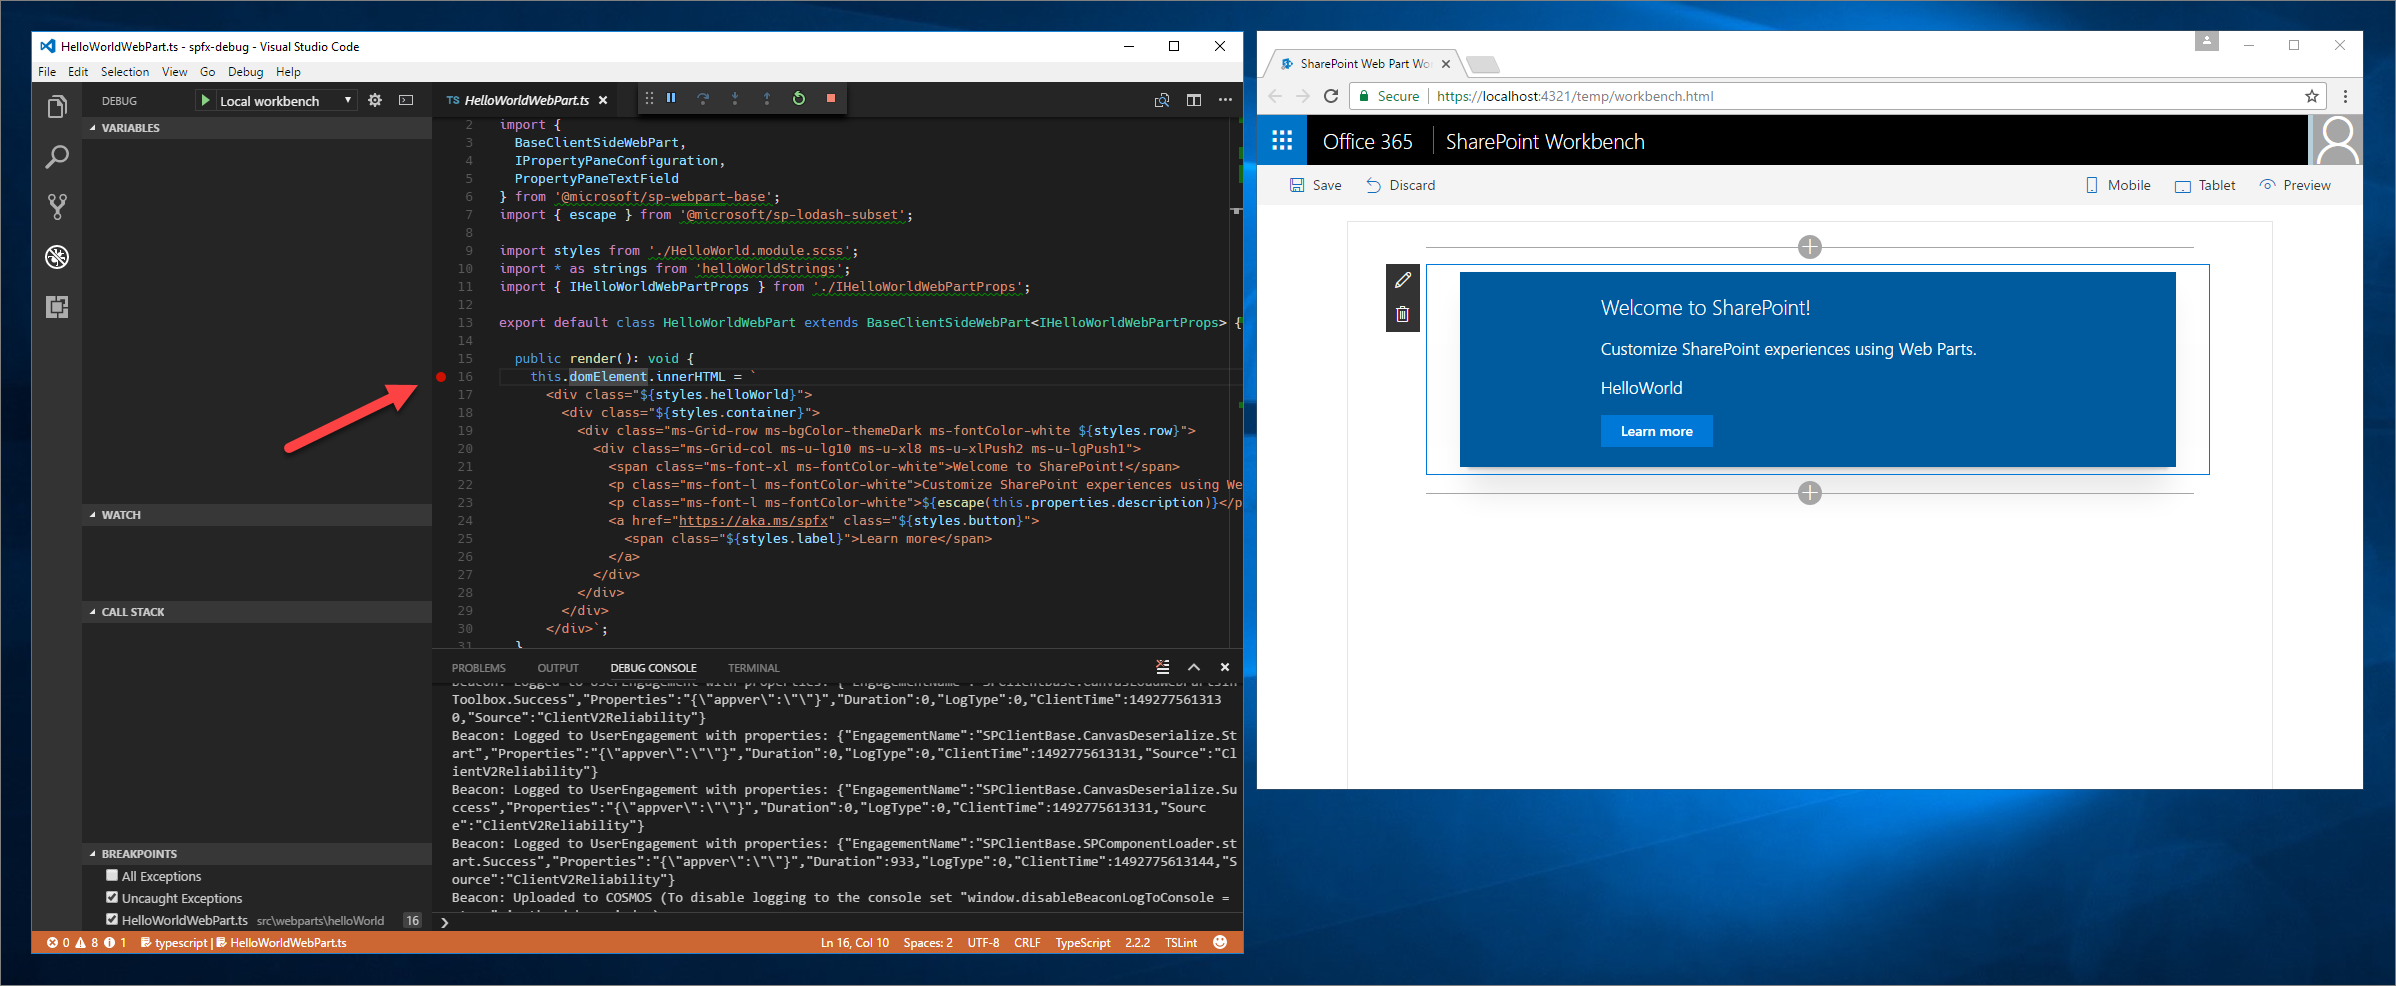
If you now reload the page, your breakpoint in Visual Studio Code is hit, and you're able to inspect all the properties and step through the code.

Debug solution using hosted workbench
When building SharePoint Framework solutions that communicate with SharePoint, you might want to verify the interaction between your solution in SharePoint. To do this easily, you can use the hosted version of the SharePoint Workbench, which is available on every Microsoft 365 tenant at https://yourtenant.sharepoint.com/_layouts/workbench.aspx.
When building SharePoint Framework solutions, you'll be doing such tests regularly, and it is a good idea to create a separate debug configuration for the hosted version of the SharePoint Workbench.
Debug Web Part solution using hosted workbench
Open .vscode/launch.json, and update the
urlproperty under the Hosted workbench configuration to your SharePoint site URL."url": "https://enter-your-SharePoint-site/_layouts/workbench.aspx",In Visual Studio Code, activate the Debug pane, and in the Configurations list, select the newly added Hosted workbench configuration.
Start debugging either by selecting F5 or by selecting the Start Debugging option on the Debug menu. Visual Studio Code switches into debug mode, indicated by the orange status bar, and the Debugger for Chrome extension opens a new instance of Google Chrome with the Microsoft 365 sign-in page.
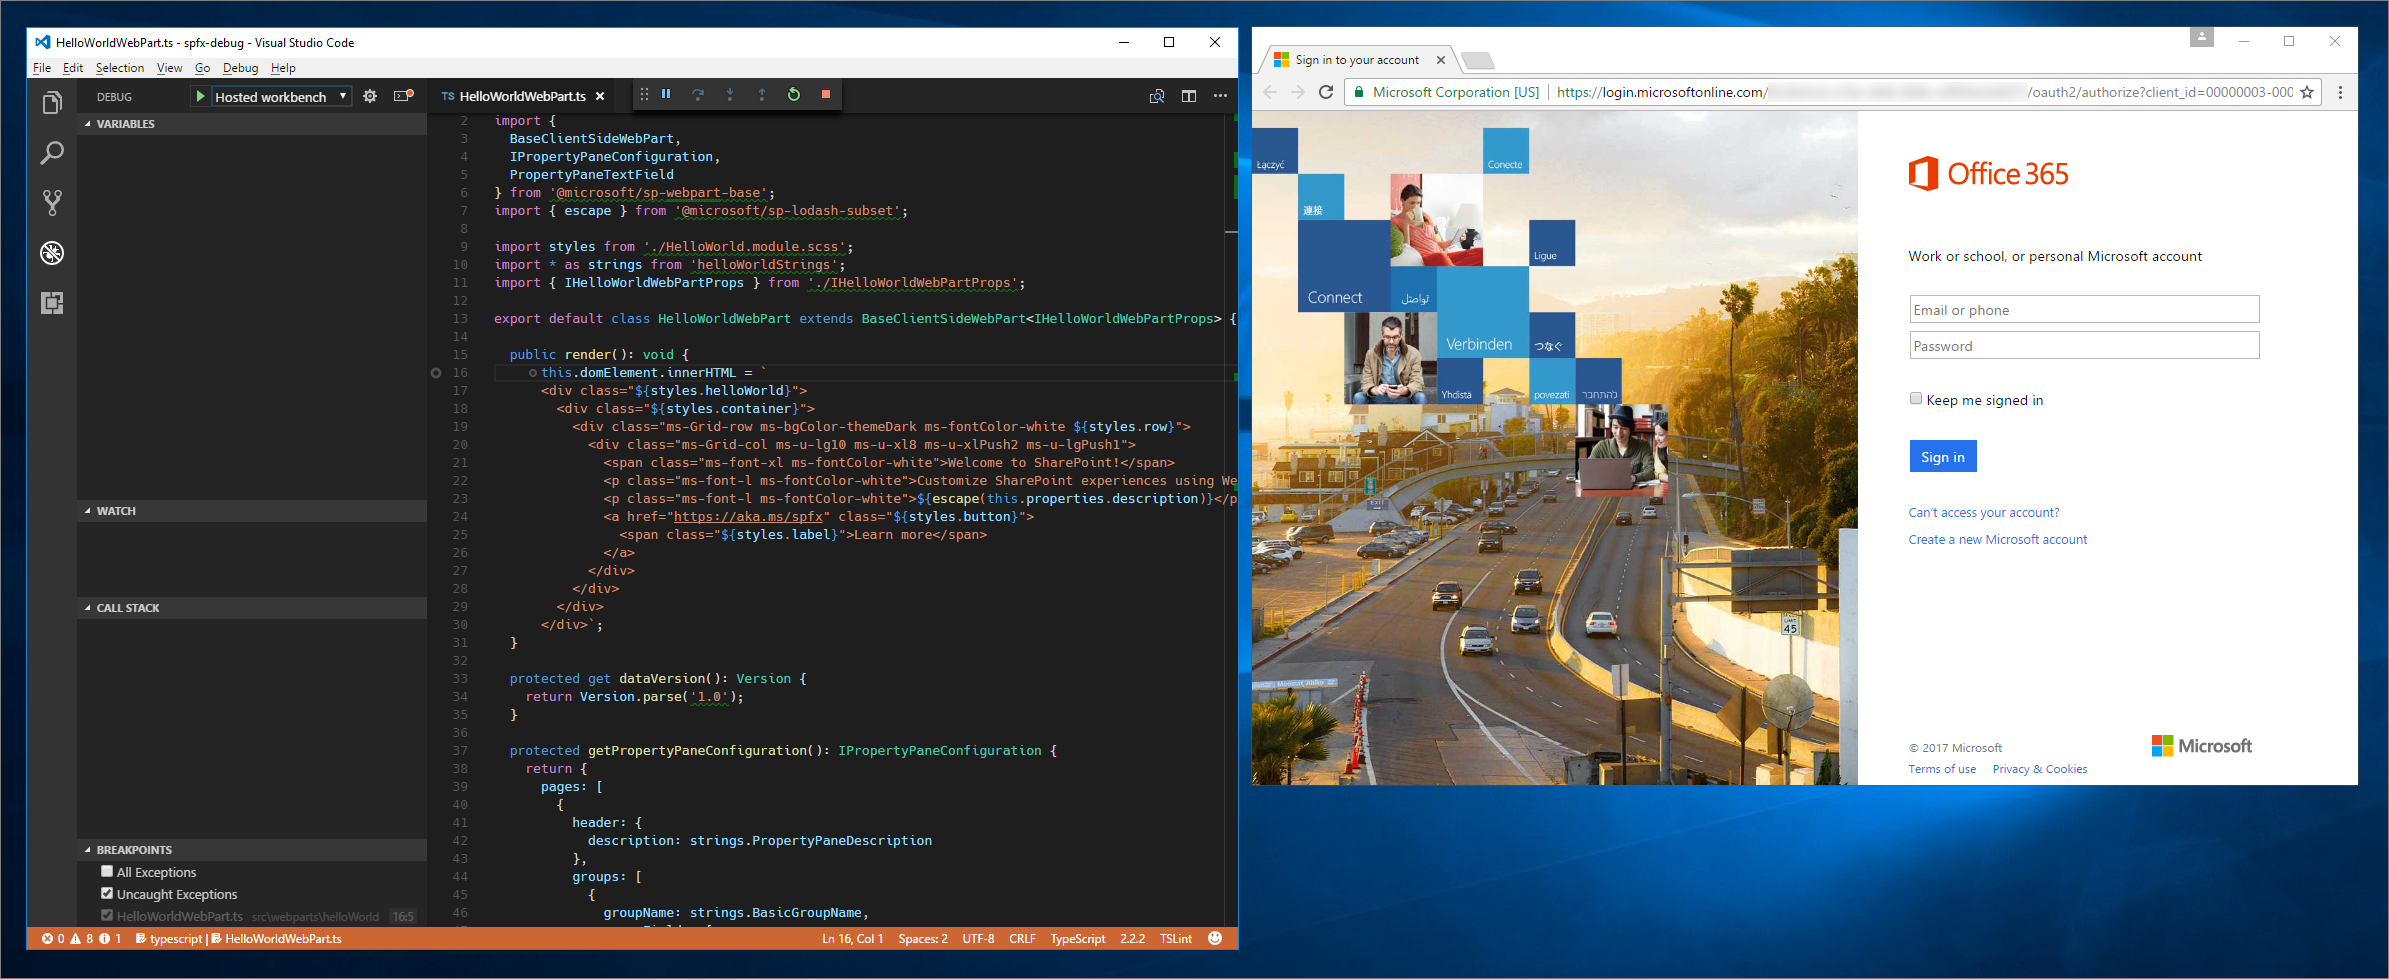
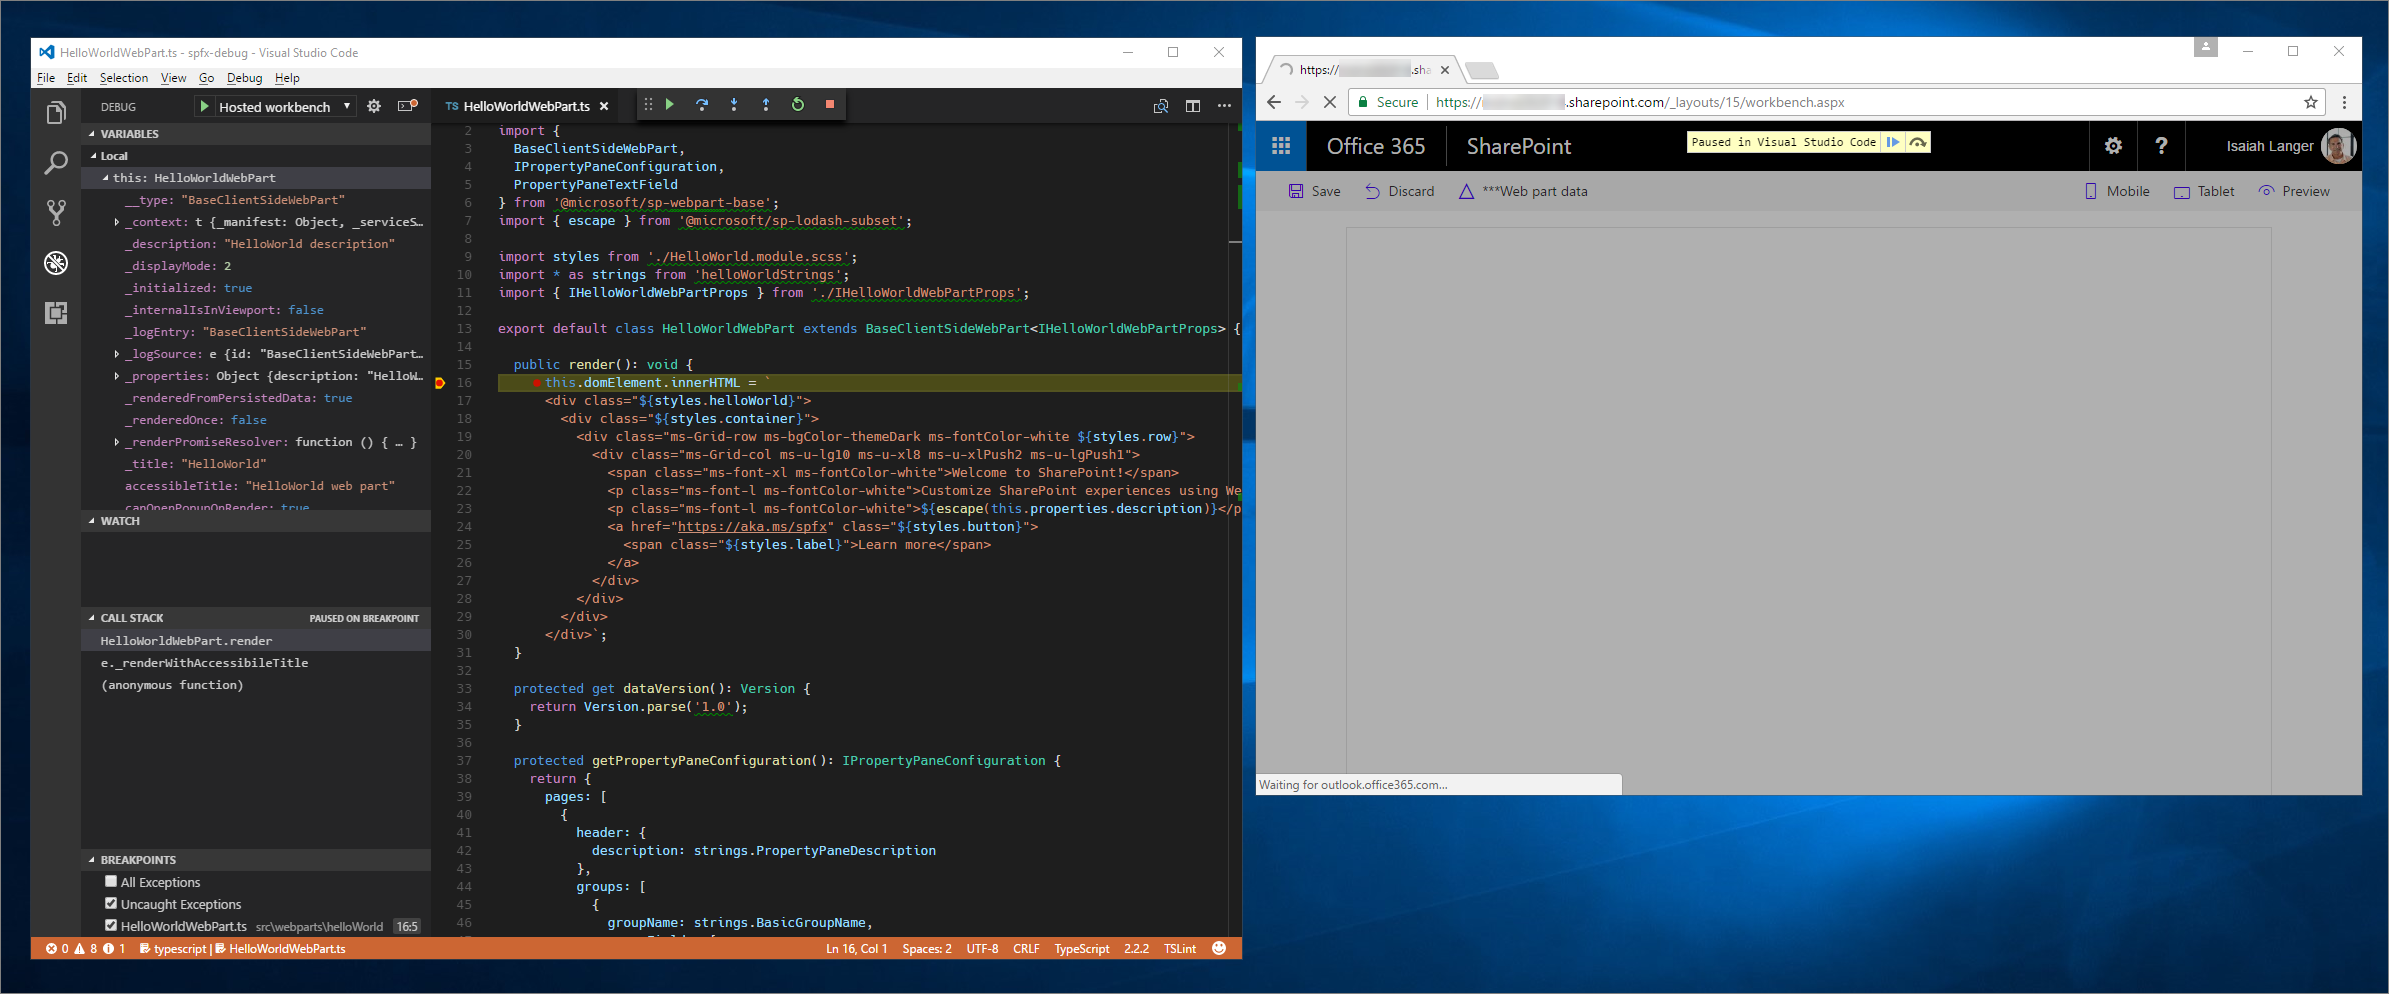
After you sign in, add the web part to the canvas and refresh the workbench. You will see the breakpoint in Visual Studio Code be hit, and you're able to inspect variables and step through the code.
Debug Extension solution using hosted workbench
Debugging an Extension in a hosted workbench is similar to the steps for a Web Part with a few key differences.
Open .vscode/launch.json, and update the
urlproperty under the Hosted workbench configuration to your SharePoint site URL."url": "https://enter-your-SharePoint-site/_layouts/workbench.aspx",In Visual Studio Code, activate the Debug pane, and in the Configurations list, select the newly added Hosted workbench configuration.
After initiating the gulp serve in the Terminal start debugging either by selecting F5 or by selecting the Start Debugging option on the Debug menu. Visual Studio Code switches into debug mode, indicated by the orange status bar, and the Debugger for Chrome extension opens a new instance of Google Chrome with the Microsoft 365 sign-in page.
In the workbench tab that was opened in your browser navigate to a SharePoint Online page that you wish to test your extension.
Append the following query string parameters to the URL. Notice that you need to update the ID to match your own extension identifier. This is available in the HelloWorldApplicationCustomizer.manifest.json file.
Caution
Line breaks & indentation have been added to the following snippet for readability. The following text should be on a single line with no whitespace.
?loadSPFX=true
&debugManifestsFile=https://localhost:4321/temp/manifests.js
&customActions={"e5625e23-5c5a-4007-a335-e6c2c3afa485":{
    "location":"ClientSideExtension.ApplicationCustomizer",
    "properties":{
      "testMessage":"Hello as property!"
    }
}}
More detail about the URL parameters:
- loadSPFX=true: Ensures that the SharePoint Framework is loaded on the page. For performance reasons, the framework does not load unless at least one extension is registered. Because no components are registered, you must explicitly load the framework.
- debugManifestsFile: Specifies that you want to load SPFx components that are locally served. The loader only looks for components in the app catalog (for your deployed solution) and the SharePoint manifest server (for the system libraries).
- customActions: Simulates a custom action. When you deploy and register this component in a site, you'll create this CustomAction object and describe all the different properties you can set on it.
- Key: Use the GUID of the extension as the key to associate with the custom action. This has to match the ID value of your extension, which is available in the extension manifest.json file.
- Location: The type of custom action. Use
ClientSideExtension.ApplicationCustomizerfor the Application Customizer extension. - Properties: An optional JSON object that contains properties that are available via the
this.propertiesmember. In this HelloWorld example, it defined atestMessageproperty.
The full URL should look similar to the following:
Caution
Line breaks & indentation have been added to the following snippet for readability. The following text should be on a single line with no whitespace.
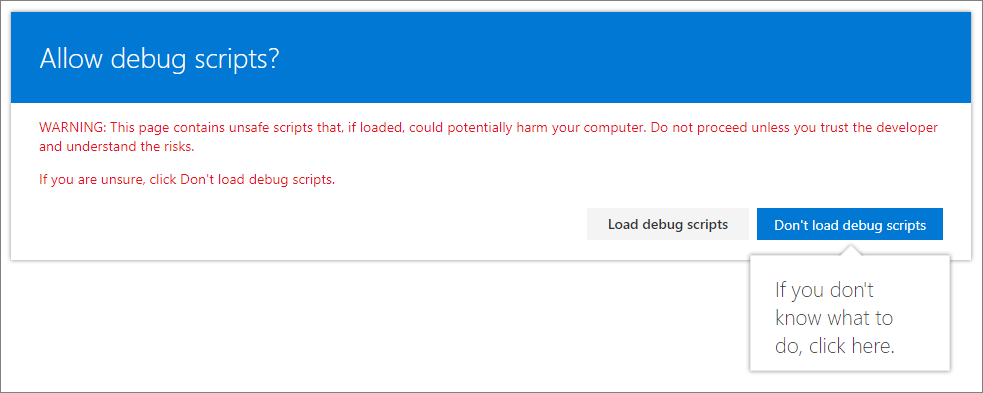
https://contoso.sharepoint.com/Lists/Contoso/AllItems.aspx
    ?loadSPFX=true
    &debugManifestsFile=https://localhost:4321/temp/manifests.js
    &customActions={"e5625e23-5c5a-4007-a335-e6c2c3afa485":{
        "location":"ClientSideExtension.ApplicationCustomizer",
        "properties":{
          "testMessage":"Hello as property!"
        }
    }}
Select Load debug scripts to continue loading scripts from your local host.
When the page loads, you should now be able to see the Extension on your page (in this case a list view command extension):
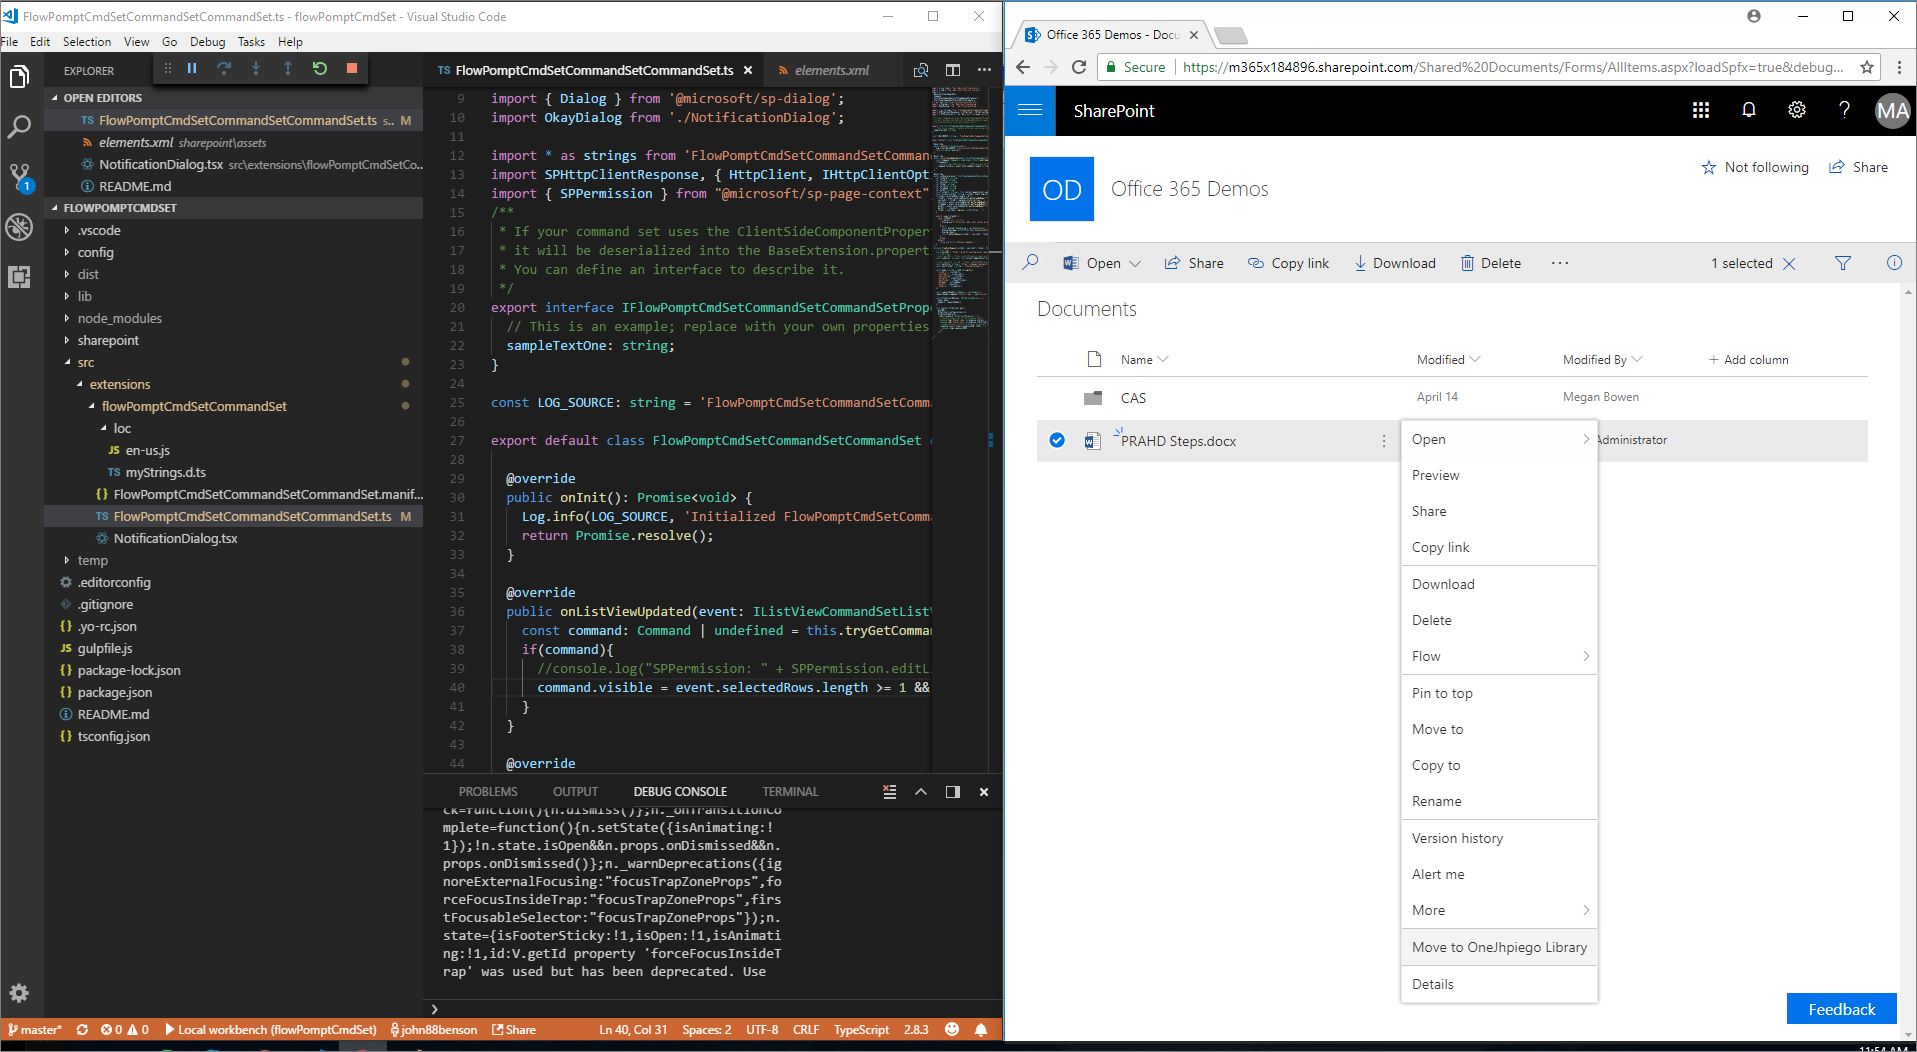
In addition, you can now toggle Breakpoints and step through the code:

Debugging with Microsoft Edge or older projects
If you're using an older version of SharePoint Framework Yeoman generator or want to debug with Microsoft Edge, follow these steps to create the launch.json file manually.
Note
In order for you to debug with Microsoft Edge, you'll have to install the Windows 10 April 2018 Update which includes the Microsoft Edge DevTools Protocol.
Create debug configuration for hosted workbench
In Visual Studio Code, open the .vscode/launch.json file.
For Edge, copy the existing debug configuration and use the URL of the hosted workbench:
{
  "version": "0.2.0",
  "configurations": [
    {
      "name": "Hosted workbench",
      "type": "msedge",
      "request": "launch",
      "url": "https://contoso.sharepoint.com/_layouts/workbench.aspx",
      "webRoot": "${workspaceRoot}",
      "sourceMaps": true,
      "sourceMapPathOverrides": {
        "webpack:///.././src/*": "${webRoot}/src/*",
        "webpack:///../../../src/*": "${webRoot}/src/*",
        "webpack:///../../../../src/*": "${webRoot}/src/*",
        "webpack:///../../../../../src/*": "${webRoot}/src/*"
      }
    }
  ]
}
For Chrome, copy the existing debug configuration and use the URL of the hosted workbench:
{
  "version": "0.2.0",
  "configurations": [
    {
      "name": "Hosted workbench",
      "type": "pwa-chrome",
      "request": "launch",
      "url": "https://contoso.sharepoint.com/_layouts/workbench.aspx",
      "webRoot": "${workspaceRoot}",
      "sourceMaps": true,
      "sourceMapPathOverrides": {
        "webpack:///.././src/*": "${webRoot}/src/*",
        "webpack:///../../../src/*": "${webRoot}/src/*",
        "webpack:///../../../../src/*": "${webRoot}/src/*",
        "webpack:///../../../../../src/*": "${webRoot}/src/*"
      },
      "runtimeArgs": [
        "--remote-debugging-port=9222",
        "-incognito"
      ]
    }
  ]
}
See also
Feedback
Coming soon: Throughout 2024 we will be phasing out GitHub Issues as the feedback mechanism for content and replacing it with a new feedback system. For more information see: https://aka.ms/ContentUserFeedback.
Submit and view feedback for