Plot histograms in Python
Applies to: ![]() SQL Server
SQL Server ![]() Azure SQL Database
Azure SQL Database ![]() Azure SQL Managed Instance
Azure SQL Managed Instance
This article describes how to plot data using the Python package pandas'.hist(). A SQL database is the source used to visualize the histogram data intervals that have consecutive, non-overlapping values.
Prerequisites
SQL Server Management Studio for restoring the sample database to Azure SQL Managed Instance.
Azure Data Studio. To install, see Azure Data Studio.
Restore sample DW database to get sample data used in this article.
Verify restored database
You can verify that the restored database exists by querying the Person.CountryRegion table:
USE AdventureWorksDW;
SELECT * FROM Person.CountryRegion;
Install Python packages
Download and Install Azure Data Studio.
Install the following Python packages:
pyodbcpandassqlalchemymatplotlib
To install these packages:
- In your Azure Data Studio notebook, select Manage Packages.
- In the Manage Packages pane, select the Add new tab.
- For each of the following packages, enter the package name, select Search, then select Install.
Plot histogram
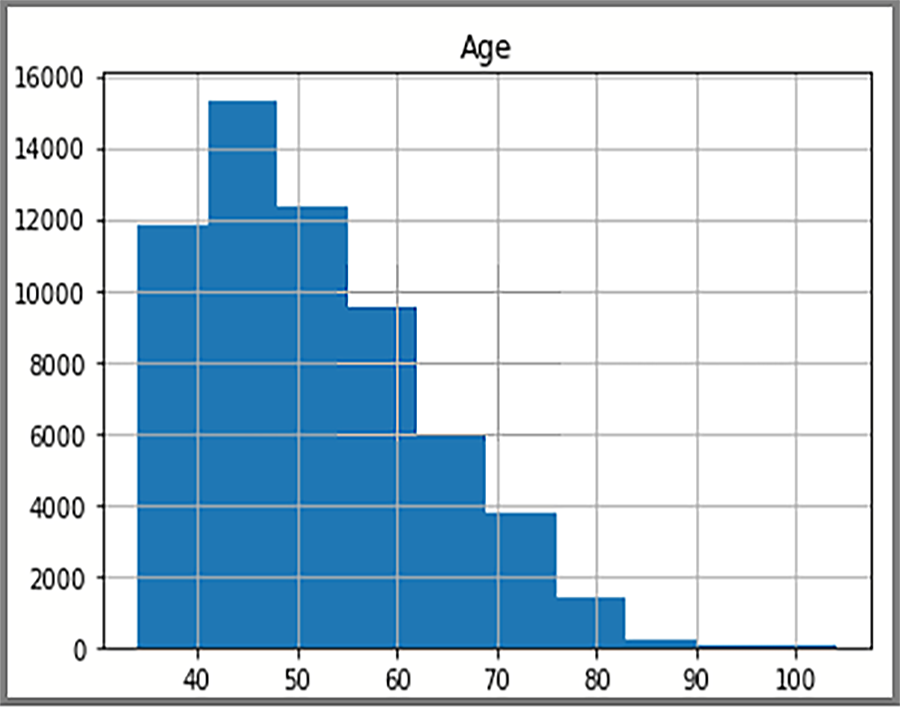
The distributed data displayed in the histogram is based on a SQL query from AdventureWorksDW2022. The histogram visualizes data and the frequency of data values.
Edit the connection string variables: 'server', 'database', 'username', and 'password' to connect to SQL Server database.
To create a new notebook:
- In Azure Data Studio, select File, select New Notebook.
- In the notebook, select kernel Python3, select the +code.
- Paste code in notebook, select Run All.
import pyodbc
import pandas as pd
import matplotlib
import sqlalchemy

from sqlalchemy import create_engine

matplotlib.use('TkAgg', force=True)
from matplotlib import pyplot as plt

# Some other example server values are
# server = 'localhost\sqlexpress' # for a named instance
# server = 'myserver,port' # to specify an alternate port
server = 'servername'
database = 'AdventureWorksDW2022'
username = 'yourusername'
password = 'databasename'

url = 'mssql+pyodbc://{user}:{passwd}@{host}:{port}/{db}?driver=SQL+Server'.format(user=username, passwd=password, host=server, port=port, db=database)
engine = create_engine(url)

sql = "SELECT DATEDIFF(year, c.BirthDate, GETDATE()) AS Age FROM [dbo].[FactInternetSales] s INNER JOIN dbo.DimCustomer c ON s.CustomerKey = c.CustomerKey"

df = pd.read_sql(sql, engine)
df.hist(bins=50)

plt.show()
The display shows the age distribution of customers in the FactInternetSales table.
Feedback
Coming soon: Throughout 2024 we will be phasing out GitHub Issues as the feedback mechanism for content and replacing it with a new feedback system. For more information see: https://aka.ms/ContentUserFeedback.
Submit and view feedback for