Monitor performance by using the Query Store
Applies to: ![]() SQL Server 2016 (13.x) and later
SQL Server 2016 (13.x) and later ![]() Azure SQL Database
Azure SQL Database ![]() Azure SQL Managed Instance
Azure SQL Managed Instance ![]() Azure Synapse Analytics (dedicated SQL pool only)
Azure Synapse Analytics (dedicated SQL pool only)
The Query Store feature provides you with insight on query plan choice and performance for SQL Server, Azure SQL Database, Azure SQL Managed Instance, and Azure Synapse Analytics. The Query Store simplifies performance troubleshooting by helping you quickly find performance differences caused by query plan changes. Query Store automatically captures a history of queries, plans, and runtime statistics, and retains these for your review. It separates data by time windows so you can see database usage patterns and understand when query plan changes happened on the server. You can configure query store using the ALTER DATABASE SET option.
- For information about operating the Query Store in Azure SQL Database, see Operating the Query Store in Azure SQL Database.
- For information on discovering actionable information and tune performance with the Query Store, see Tune performance with the Query Store.
- For information on shaping query plans without changing application code, see Query Store hints.
Important
If you are using Query Store for just in time workload insights in SQL Server 2016 (13.x), plan to install the performance scalability fixes in KB 4340759 as soon as possible.
Enable the Query Store
- Query Store is enabled by default for new Azure SQL Database and Azure SQL Managed Instance databases.
- Query Store is not enabled by default for SQL Server 2016 (13.x), SQL Server 2017 (14.x), SQL Server 2019 (15.x). It is enabled by default in the
READ_WRITEmode for new databases starting with SQL Server 2022 (16.x). To enable features to better track performance history, troubleshoot query plan related issues, and enable new capabilities in SQL Server 2022 (16.x), we recommend enabling Query Store on all databases. - Query Store is not enabled by default for new Azure Synapse Analytics databases.
Use the Query Store page in SQL Server Management Studio
In Object Explorer, right-click a database, and then select Properties.
Note
Requires at least version 16 of Management Studio.
In the Database Properties dialog box, select the Query Store page.
In the Operation Mode (Requested) box, select Read Write.
Use Transact-SQL statements
Use the ALTER DATABASE statement to enable the query store for a given database. For example:
ALTER DATABASE <database_name>
SET QUERY_STORE = ON (OPERATION_MODE = READ_WRITE);
In Azure Synapse Analytics, enable the Query Store without additional options, for example:
ALTER DATABASE <database_name>
SET QUERY_STORE = ON;
For more syntax options related to the Query Store, see ALTER DATABASE SET Options (Transact-SQL).
Note
Query Store cannot be enabled for the master or tempdb databases.
Important
For information on enabling Query Store and keeping it adjusted to your workload, refer to Best Practice with the Query Store.
Information in the Query Store
Execution plans for any specific query in SQL Server typically evolve over time due to a number of different reasons such as statistics changes, schema changes, creation/deletion of indexes, etc. The procedure cache (where cached query plans are stored) only stores the latest execution plan. Plans also get evicted from the plan cache due to memory pressure. As a result, query performance regressions caused by execution plan changes can be non-trivial and time consuming to resolve.
Since the Query Store retains multiple execution plans per query, it can enforce policies to direct the Query Processor to use a specific execution plan for a query. This is referred to as plan forcing. Plan forcing in Query Store is provided by using a mechanism similar to the USE PLAN query hint, but it does not require any change in user applications. Plan forcing can resolve a query performance regression caused by a plan change in a very short period of time.
Note
Query Store collects plans for DML Statements such as SELECT, INSERT, UPDATE, DELETE, MERGE, and BULK INSERT.
By design, Query Store does not collect plans for DDL statements such as CREATE INDEX, etc. Query Store captures cumulative resource consumption by collecting plans for the underlying DML statements. For example, Query Store may display the SELECT and INSERT statements executed internally to populate a new index.
Query Store does not collect data for natively compiled stored procedures by default. Use sys.sp_xtp_control_query_exec_stats to enable data collection for natively compiled stored procedures.
Wait stats are another source of information that helps to troubleshoot performance in the Database Engine. For a long time, wait statistics were available only on instance level, which made it hard to backtrack waits to a specific query. Starting with SQL Server 2017 (14.x) and Azure SQL Database, Query Store includes a dimension that tracks wait stats. The following example enables the Query Store to collect wait stats.
ALTER DATABASE <database_name>
SET QUERY_STORE = ON ( WAIT_STATS_CAPTURE_MODE = ON );
Common scenarios for using the Query Store feature are:
- Quickly find and fix a plan performance regression by forcing the previous query plan. Fix queries that have recently regressed in performance due to execution plan changes.
- Determine the number of times a query was executed in a given time window, assisting a DBA in troubleshooting performance resource problems.
- Identify top n queries (by execution time, memory consumption, etc.) in the past x hours.
- Audit the history of query plans for a given query.
- Analyze the resource (CPU, I/O, and Memory) usage patterns for a particular database.
- Identify top n queries that are waiting on resources.
- Understand wait nature for a particular query or plan.
The Query Store contains three stores:
- a plan store for persisting the execution plan information.
- a runtime stats store for persisting the execution statistics information.
- a wait stats store for persisting wait statistics information.
The number of unique plans that can be stored for a query in the plan store is limited by the max_plans_per_query configuration option. To enhance performance, the information is written to the stores asynchronously. To minimize space usage, the runtime execution statistics in the runtime stats store are aggregated over a fixed time window. The information in these stores is visible by querying the Query Store catalog views.
The following query returns information about queries and plans in the Query Store.
SELECT Txt.query_text_id, Txt.query_sql_text, Pl.plan_id, Qry.*
FROM sys.query_store_plan AS Pl
INNER JOIN sys.query_store_query AS Qry
    ON Pl.query_id = Qry.query_id
INNER JOIN sys.query_store_query_text AS Txt
    ON Qry.query_text_id = Txt.query_text_id;
Query Store for secondary replicas
Applies to: SQL Server (Starting with SQL Server 2022 (16.x))
The Query Store for secondary replicas feature enables the same Query Store functionality on secondary replica workloads that is available for primary replicas. When Query Store for secondary replicas is enabled, replicas send the query execution information that would normally be stored in the Query Store back to the primary replica. The primary replica then persists the data to disk within its own Query Store. In essence, there is one Query Store shared between the primary and all secondary replicas. The Query Store exists on the primary replica and stores data for all replicas together.
For complete information on Query Store for secondary replicas, see Query Store for Always On availability group secondary replicas.
Use the Regressed Queries feature
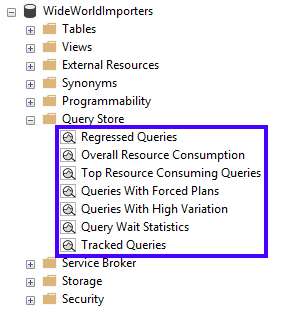
After enabling the Query Store, refresh the database portion of the Object Explorer pane to add the Query Store section.
Note
For Azure Synapse Analytics, Query Store views are available under System Views in the database portion of the Object Explorer pane.
Select Regressed Queries to open the Regressed Queries pane in SQL Server Management Studio. The Regressed Queries pane shows you the queries and plans in the query store. Use the dropdown list boxes at the top to filter queries based on various criteria: Duration (ms) (Default), CPU Time (ms), Logical Reads (KB), Logical Writes (KB), Physical Reads (KB), CLR Time (ms), DOP, Memory Consumption (KB), Row Count, Log Memory Used (KB), Temp DB Memory Used (KB), and Wait Time (ms).
Select a plan to see the graphical query plan. Buttons are available to view the source query, force and unforce a query plan, toggle between grid and chart formats, compare selected plans (if more than one is selected), and refresh the display.
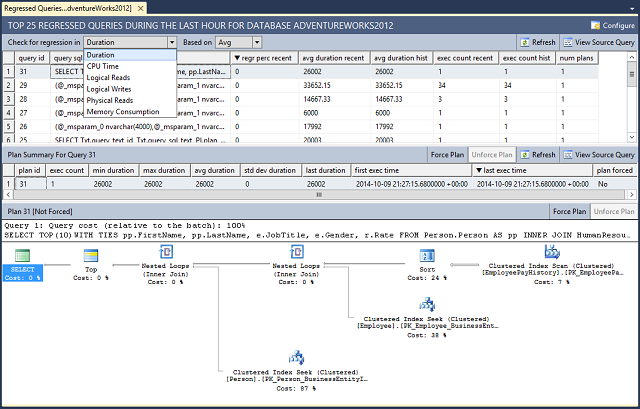
To force a plan, select a query and plan, then select Force Plan. You can only force plans that were saved by the query plan feature and are still retained in the query plan cache.
Find waiting queries
Starting with SQL Server 2017 (14.x) and Azure SQL Database, wait statistics per query over time are available in Query Store.
In Query Store, wait types are combined into wait categories. The mapping of wait categories to wait types is available in sys.query_store_wait_stats (Transact-SQL).
Select Query Wait Statistics to open the Query Wait Statistics pane in SQL Server Management Studio v18 or higher. The Query Wait Statistics pane shows you a bar chart containing the top wait categories in the Query Store. Use the dropdown list at the top to select an aggregate criteria for the wait time: avg, max, min, std dev, and total (default).
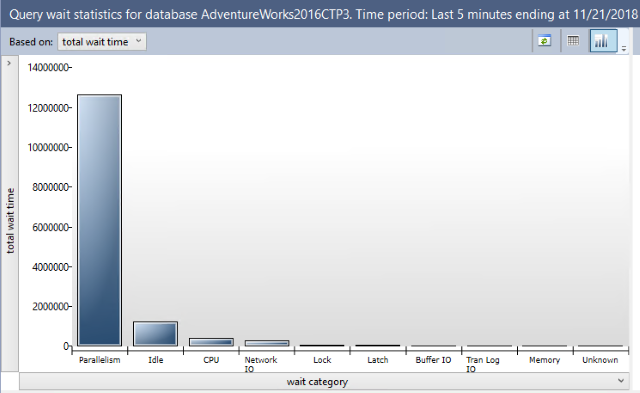
Select a wait category by selecting on the bar and a detail view on the selected wait category displays. This new bar chart contains the queries that contributed to that wait category.

Use the dropdown list box at the top to filter queries based on various wait time criteria for the selected wait category: avg, max, min, std dev, and total (default). Select a plan to see the graphical query plan. Buttons are available to view the source query, force, and unforce a query plan, and refresh the display.
Wait categories are combining different wait types into buckets similar by nature. Different wait categories require a different follow-up analysis to resolve the issue, but wait types from the same category lead to very similar troubleshooting experiences, and providing the affected query on top of waits would be the missing piece to complete most such investigations successfully.
Here are some examples how you can get more insights into your workload before and after introducing wait categories in Query Store:
| Previous experience | New experience | Action |
|---|---|---|
| High RESOURCE_SEMAPHORE waits per database | High Memory waits in Query Store for specific queries | Find the top memory consuming queries in Query Store. These queries are probably delaying further progress of the affected queries. Consider using MAX_GRANT_PERCENT query hint for these queries, or for the affected queries. |
| High LCK_M_X waits per database | High Lock waits in Query Store for specific queries | Check the query texts for the affected queries and identify the target entities. Look in Query Store for other queries modifying the same entity, which are executed frequently and/or have high duration. After identifying these queries, consider changing the application logic to improve concurrency, or use a less restrictive isolation level. |
| High PAGEIOLATCH_SH waits per database | High Buffer IO waits in Query Store for specific queries | Find the queries with a high number of physical reads in Query Store. If they match the queries with high IO waits, consider introducing an index on the underlying entity, in order to do seeks instead of scans, and thus minimize the IO overhead of the queries. |
| High SOS_SCHEDULER_YIELD waits per database | High CPU waits in Query Store for specific queries | Find the top CPU consuming queries in Query Store. Among them, identify the queries for which high CPU trend correlates with high CPU waits for the affected queries. Focus on optimizing those queries - there could be a plan regression, or perhaps a missing index. |
Configuration options
For the available options to configure Query Store parameters, see ALTER DATABASE SET options (Transact-SQL).
Query the sys.database_query_store_options view to determine the current options of the Query Store. For more information about the values, see sys.database_query_store_options.
For examples about setting configuration options using Transact-SQL statements, see Option Management.
Note
For Azure Synapse Analytics, the Query Store can be enabled as on other platforms but additional configuration options are not supported.
Related views, functions, and procedures
View and manage Query Store through Management Studio or by using the following views and procedures.
Query Store functions
Functions help operations with the Query Store.
Query Store catalog views
Catalog views present information about the Query Store.
Query Store stored procedures
Stored procedures configure the Query Store.
sp_query_store_consistency_check (Transact-SQL)1
1 In extreme scenarios Query Store can enter an ERROR state because of internal errors. Starting with SQL Server 2017 (14.x), if this happens, Query Store can be recovered by executing the sp_query_store_consistency_check stored procedure in the affected database. See sys.database_query_store_options for more details described in the actual_state_desc column description.
Query Store maintenance
Best practices and recommendations for maintenance and management of the Query Store have been expanded in this article: Best practices for managing the Query Store.
Performance auditing and troubleshooting
For more information about diving into performance tuning with Query Store, see Tune performance with the Query Store.
Other performance topics:
See also
- Query Store Stored Procedures (Transact-SQL)
- Query Store Catalog Views (Transact-SQL)
- sys.database_query_store_options (Transact-SQL)
- Live Query Statistics
- Activity Monitor
- How Query Store Collects Data
- Monitor and Tune for Performance
- Performance Monitoring and Tuning Tools
- Using the Query Store with In-Memory OLTP
Next steps
Feedback
Coming soon: Throughout 2024 we will be phasing out GitHub Issues as the feedback mechanism for content and replacing it with a new feedback system. For more information see: https://aka.ms/ContentUserFeedback.
Submit and view feedback for