View System Center Operations Manager’s alerts in Azure Monitor
This article describes the recent feature addition that allows Azure Monitor SCOM Managed Instance customers to view Operations Manager’s alerts in Azure Monitor.
Alert
An alert is an object that is generated in System Center Operations Manager when one of the rules or monitors that are set in an Operations Manager management pack is triggered. In System Center - Operations Manager, an alert can be generated by a rule or a monitor. For more information on rules and monitors, see Operations Manager management pack.
For detailed information on how an alert is produced in Operations Manager, see How an alert is produced.
View and manage alerts in Operations Manager on-premises
In System Center Operations Manager, alerts matching a specific criterion and related to an object or group of objects are presented in an alerts view. From this view, you can review alerts that have been generated by rules and monitors, which are still active and haven't been closed automatically or manually by an operator. For more information on how alerts are viewed, see View Active Alerts and Details.
Each alert has specific properties that inform the user about different factors such as the history of the alert, how it's generated, what are the objects affected etc. For a complete list of all the properties of a rule/monitor alert, see Examining Properties of Alerts, Rules, and Monitors.
View Operations Manager’s alerts in Azure Monitor
For SCOM Managed Instance, the alerts that are generated in the workload can now be seen in Azure Monitor.
Log in to the Azure portal, access the Azure Monitor service, and select Alerts tab to see a list of all the alerts that the service has generated.

To view the alerts that are generated by your SCOM Managed Instance service, select SCOM Managed Instance in the Monitor service filter.
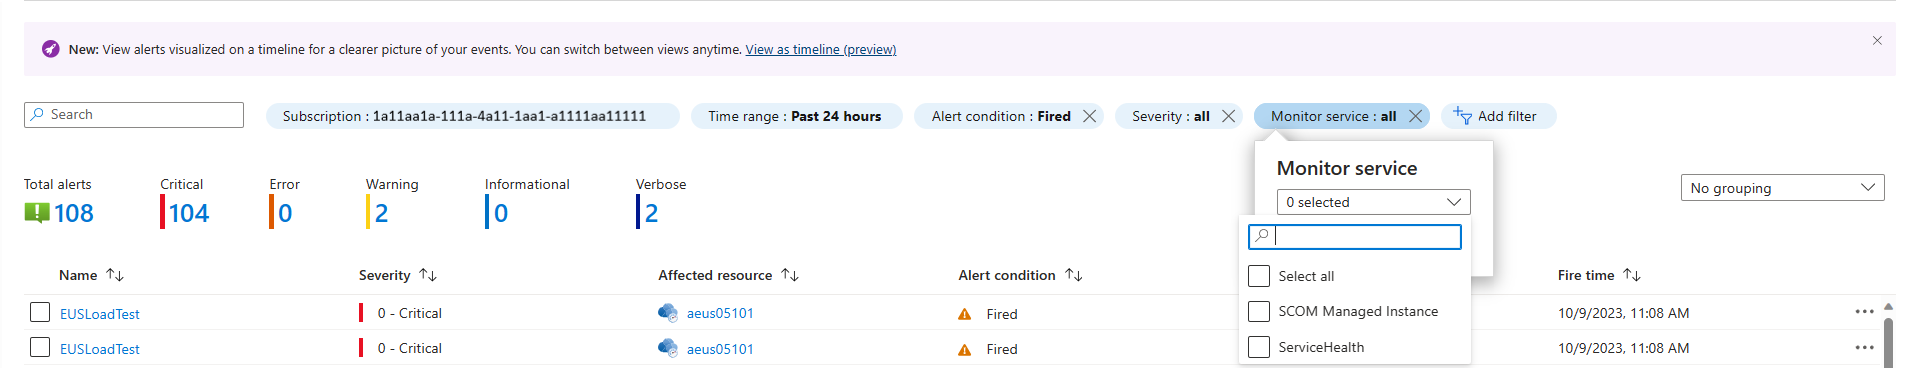
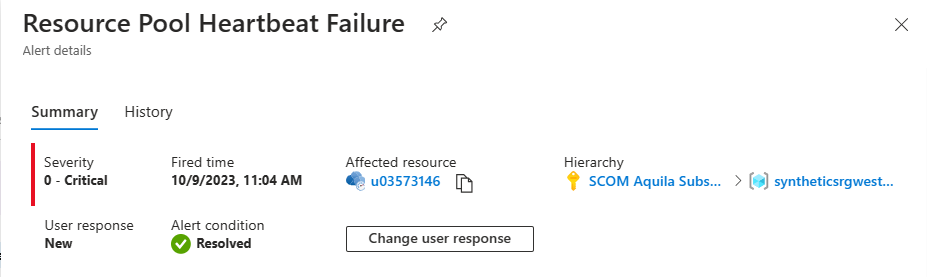
Select an alert to view its details. Details include:
- Severity of the alert
- Fired Time
- Affected Resource
- Hierarchy of the affected resource group
- User Response
- Alert Condition
- Is it a monitor alert
- Operations Manager resolution state
- Priority
- Last Modified Time
- Category
- Last Modified By
- Operations Manager severity
- Description
- Monitor service
- Alert ID
- Suppression Status
- Target Resource Type
- History of the alert

Compare Operations Manager Ops console and Azure Monitor alerts data
The alerts moving from System Center Operations Manager to Azure Monitor SCOM Managed Instance must match the Azure Monitor alert schema to be displayed properly in the portal.
The following translations are made to the Operations Manager alert schema when moving to Azure Monitor alerts schema:
| Alert property | Representation in Operations Console | Representation in Azure Monitor |
|---|---|---|
| State | Seven predefined Alert states, which can be extended to 255 user-defined states. New, Acknowledged, Scheduled, Assigned to Engineering, Awaiting Evidence, Resolved and Closed. |
Two distinct properties: Alert monitoring Condition and User state. The new alert from Operations Manager to Azure is represented as Fired and New, respectively. The closed alert from SCOM Managed Instance is represented as Resolved and New or Resolved and Closed. |
| Severity | Critical, Warning, Informational | Critical, Error, Warning, Informational and Verbose SCOM Managed Instance alerts are represented with the corresponding Alert severity in Azure. |
| Signal Type | All SCOM Managed Instance alerts are represented as Custom signal type in Azure. | |
| Monitoring Service | SCOM Managed Instance | |
| Effected resource | If the alert is from Azure native/Arc resource, then it is represented with its corresponding ARM resource ID. If the alert is from on-premises workload, it is represented with SCOM Managed Instance resource ARM ID. |
|
| Additional properties | Priority, Category, Owner, Repeat count, alert context, and parameters. The management pack discovered object for the alert. |
All these properties are represented in Azure alert context to enhance it with SCOM Managed Instance alerts information. |
Integrate Azure Monitor alerts with ITSM tools
Azure Monitor allows integration with ITSM tools such as ServiceNow so that alerts can be forwarded to the tools in the form of incidents. Using Azure Monitor Alerts’ concept of Action Groups and Alert Processing Rules, you can create the necessary actions to link alerts from SCOM Managed Instance with an ITSM connector such as ServiceNow.
For more information, see Connect ServiceNow with IT Service Management Connector.
Once the ITSM connector is created and connected to the ServiceNow instance, follow these steps:
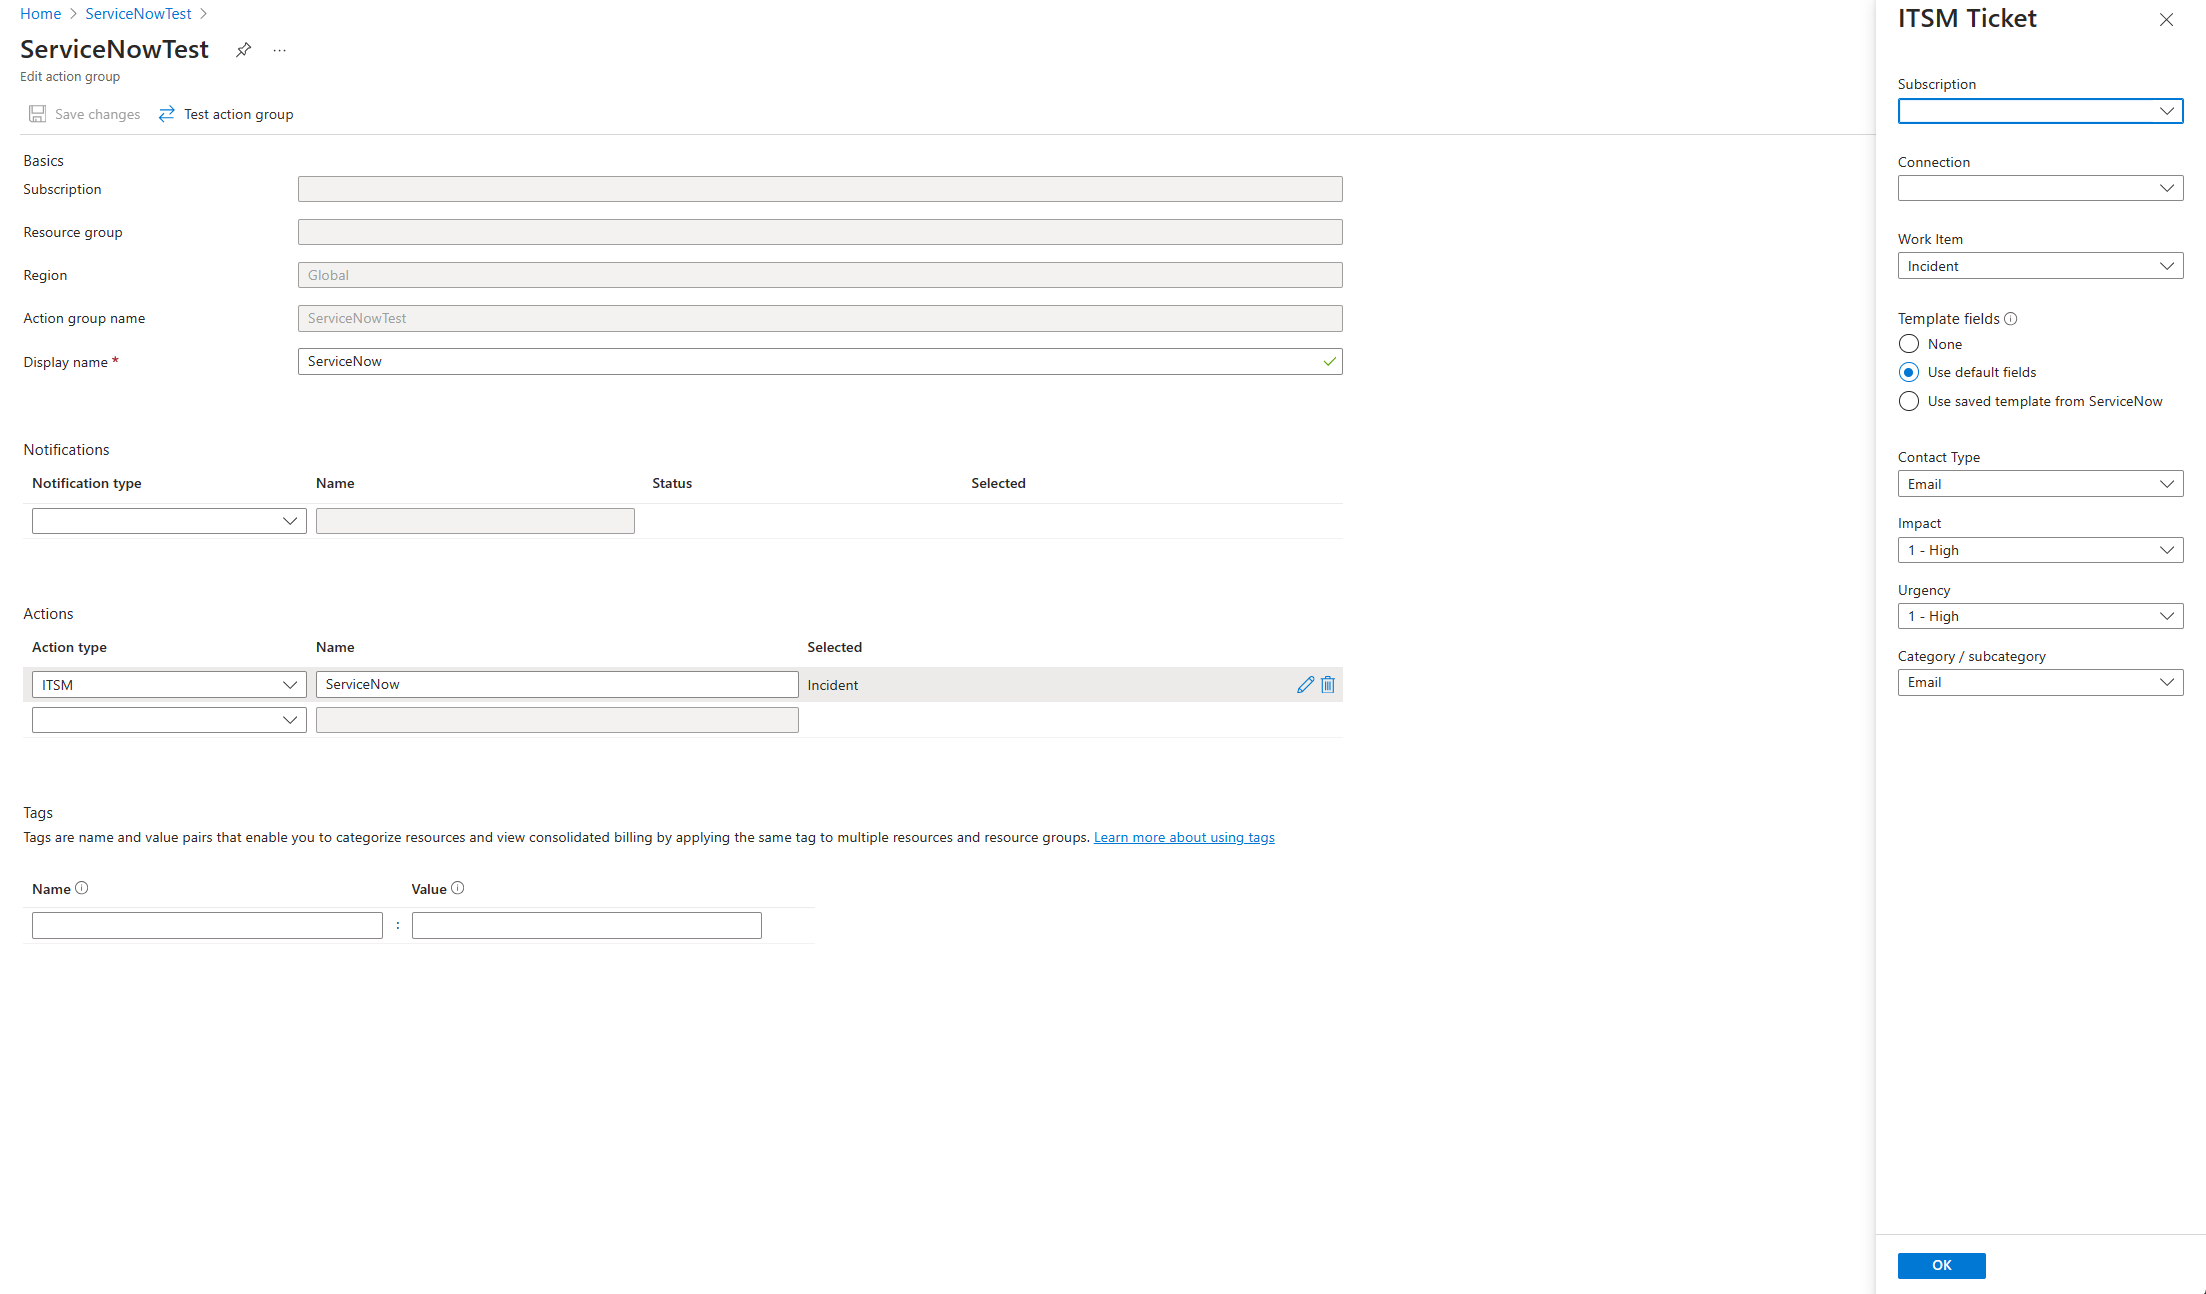
After you create the ITSM connector, create an Action Group in the Azure Monitor Alerts page with an ITSM action type created.
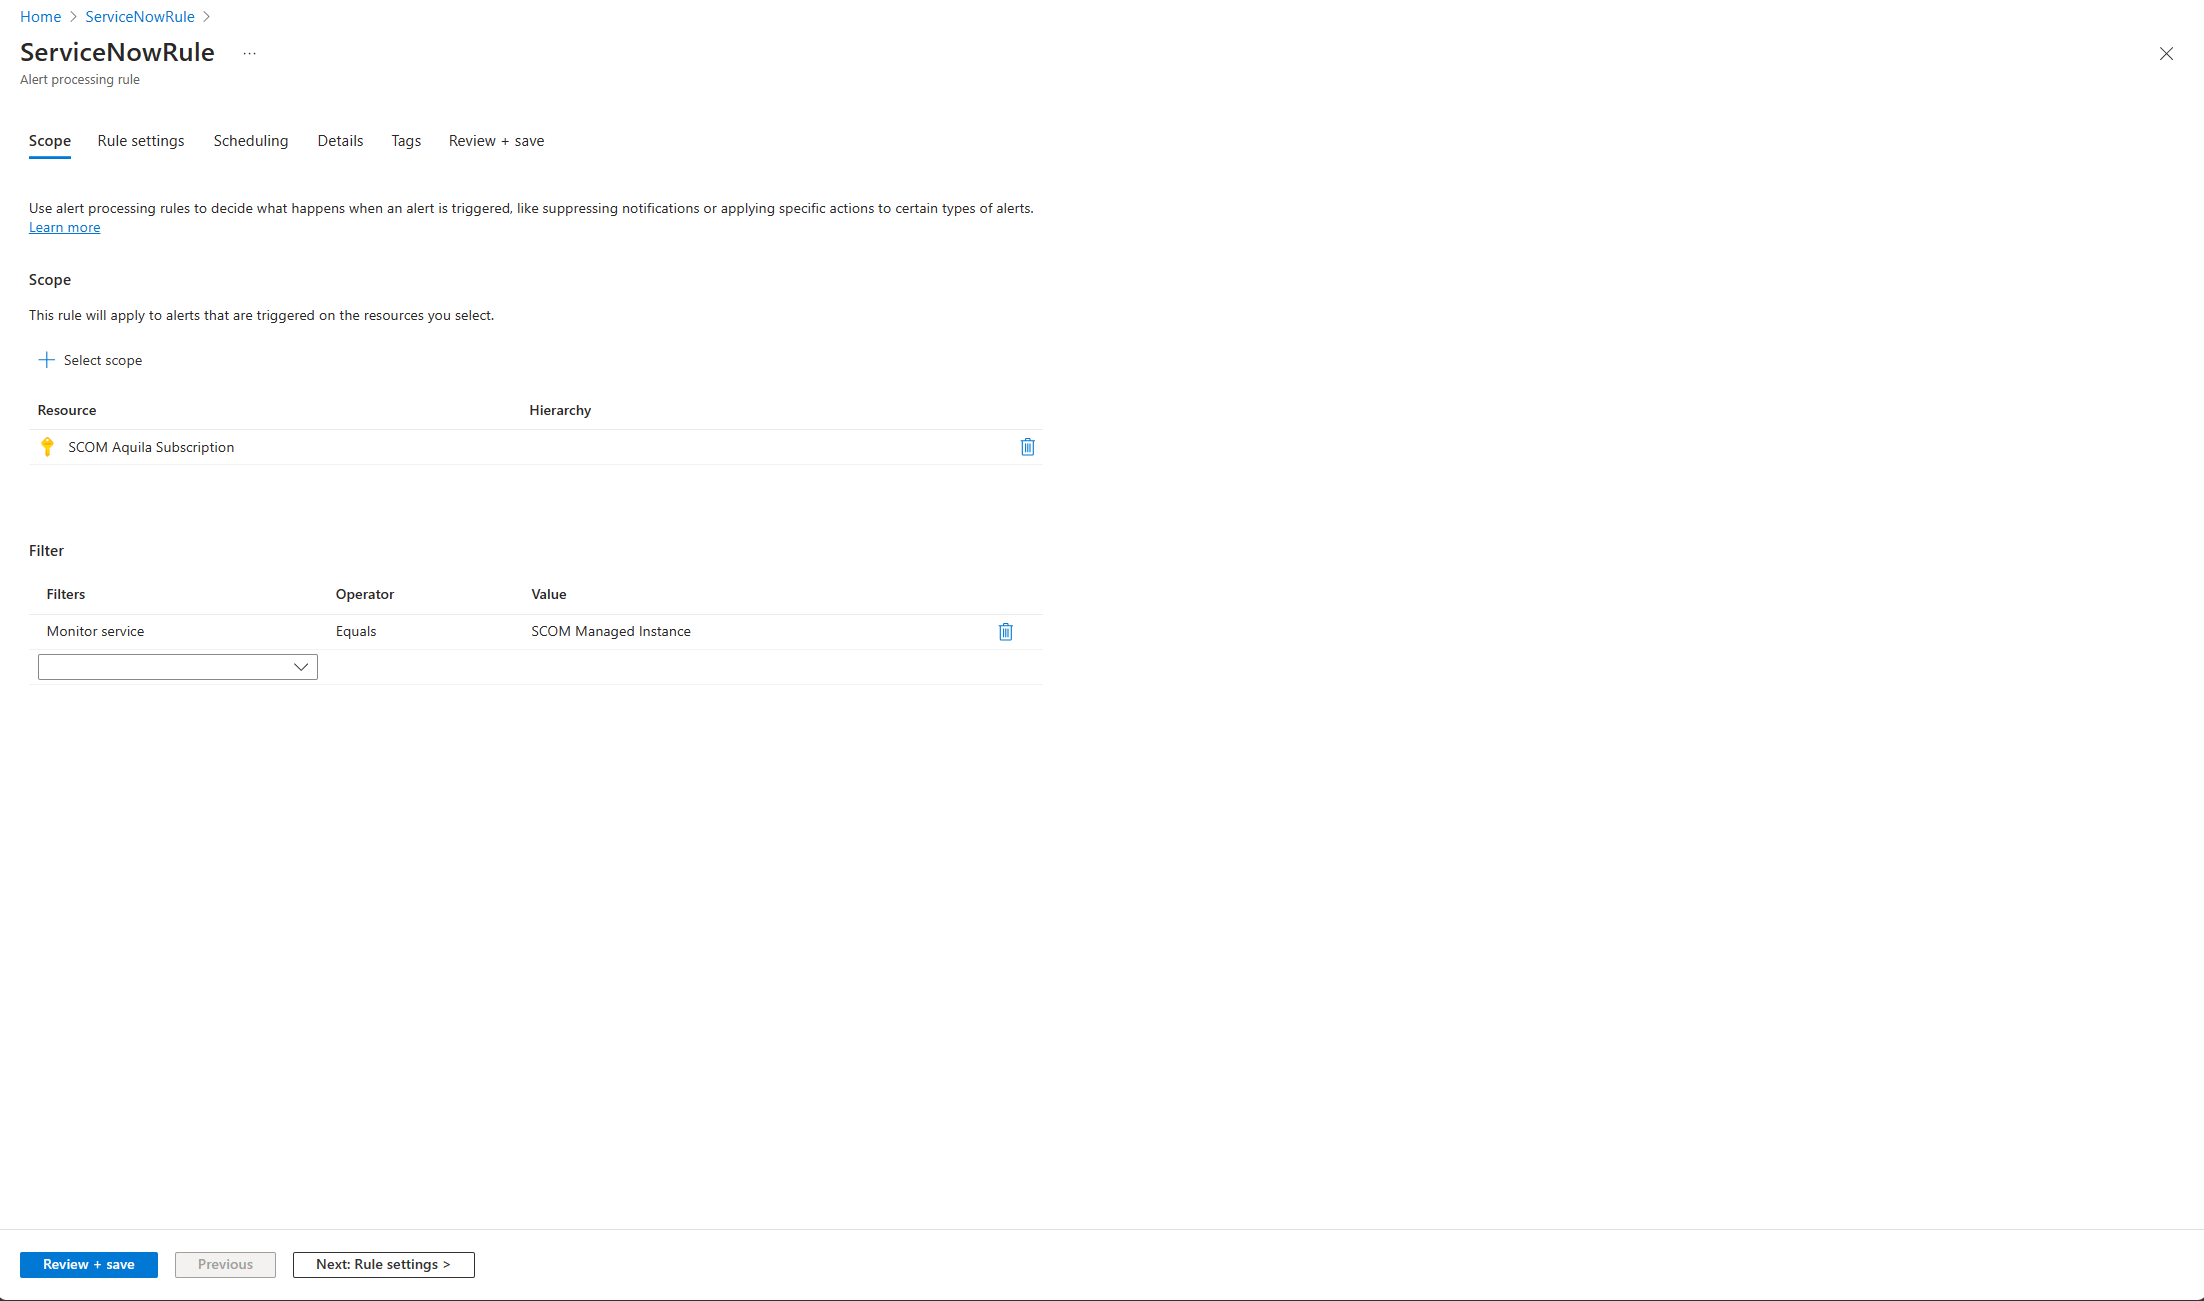
Create an Alert Processing Rule with the filter Monitor Service equals SCOM Managed Instance.
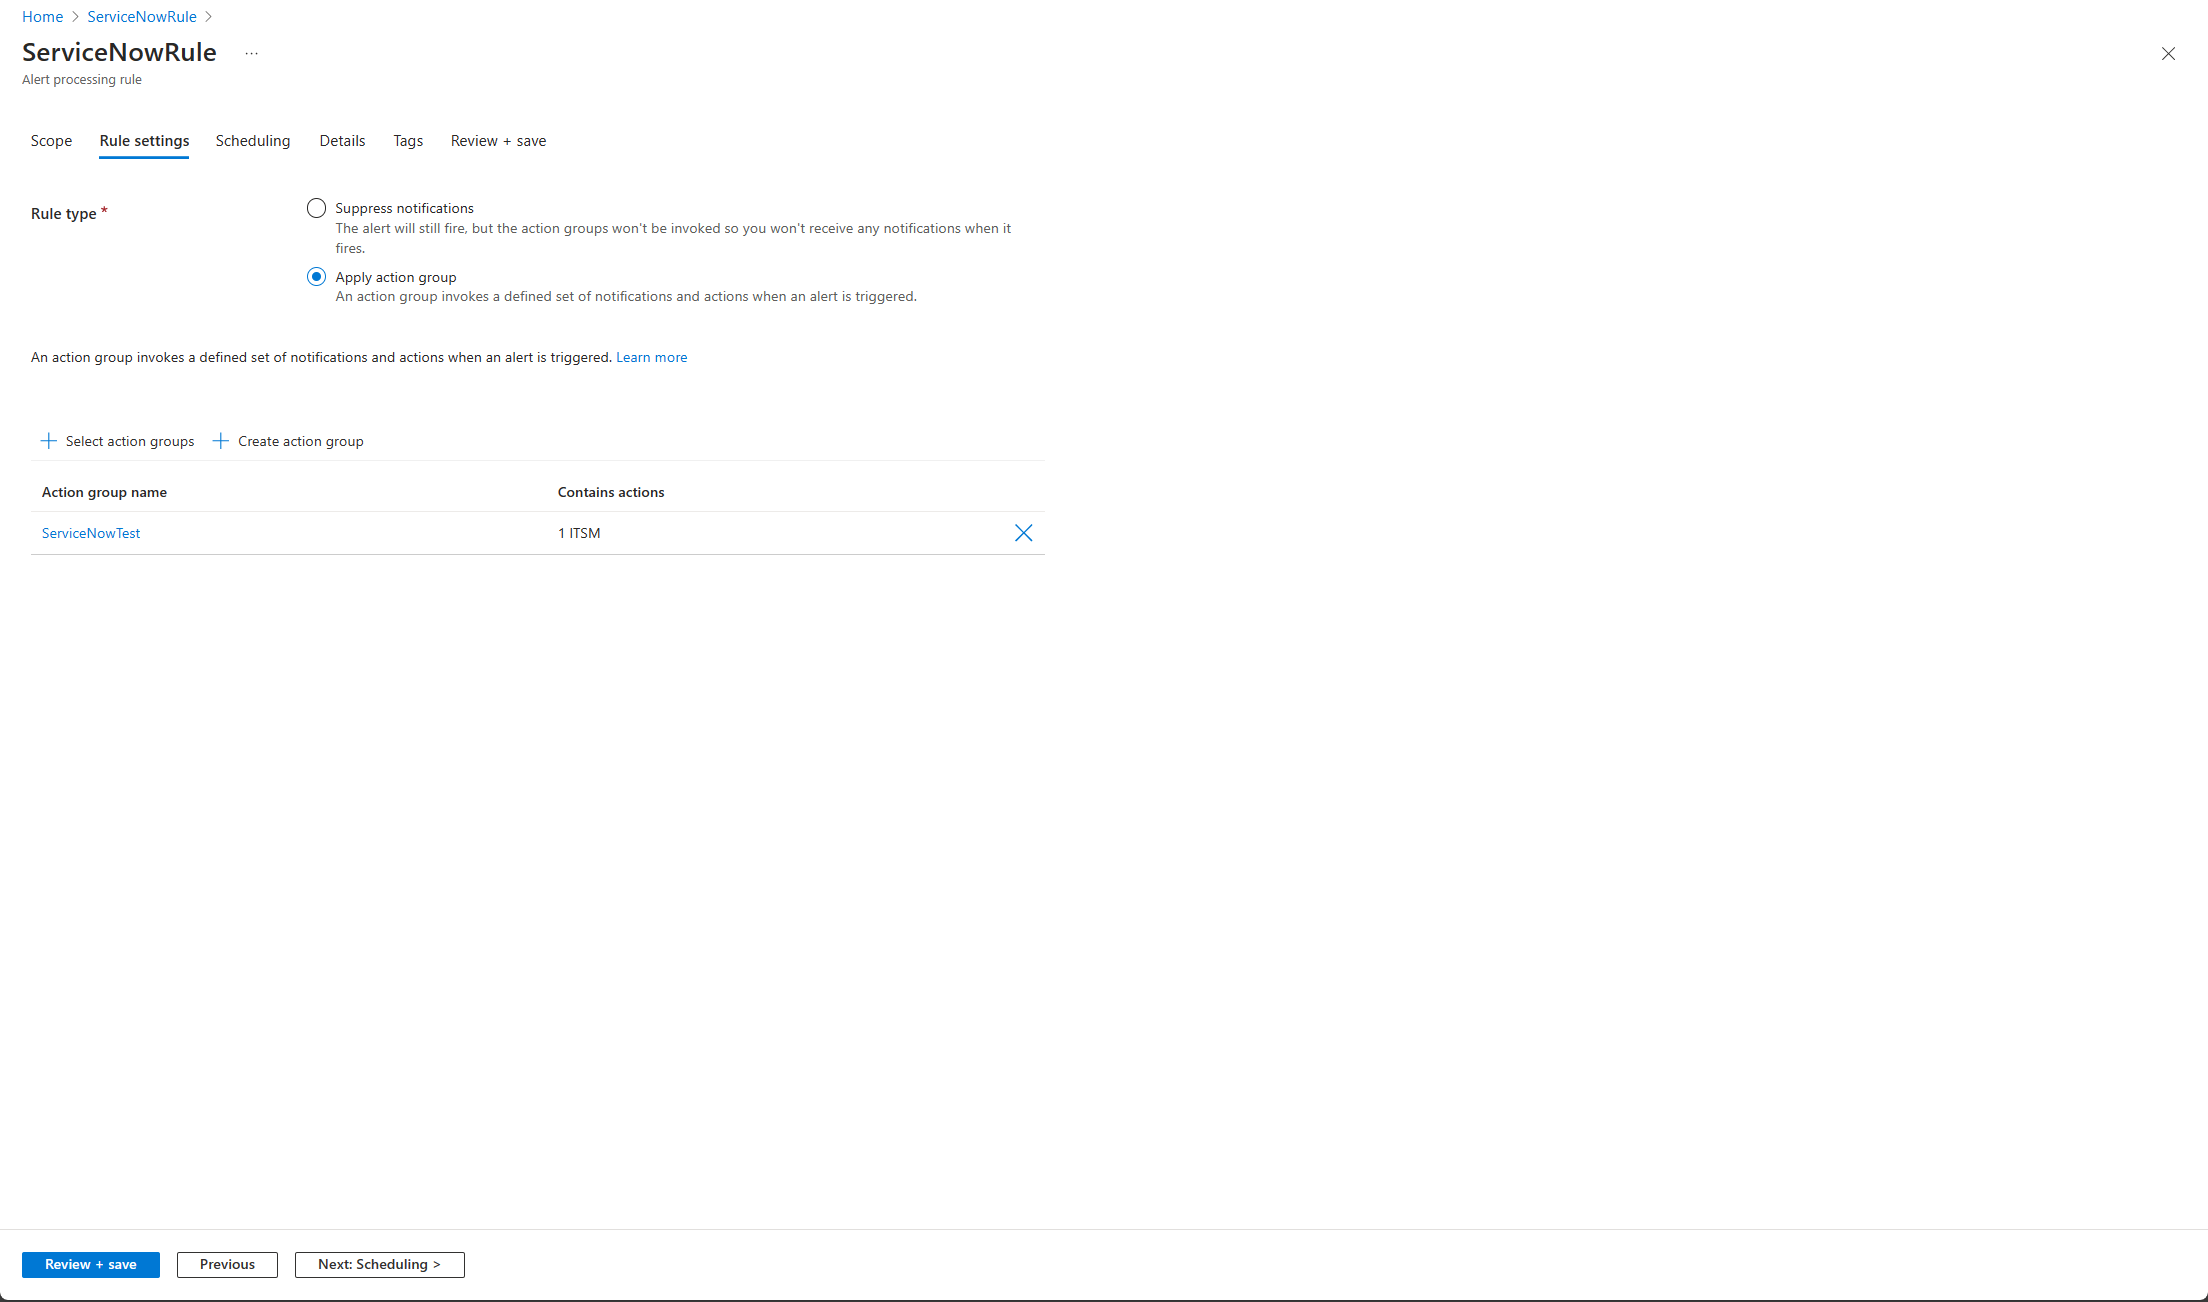
In the Rule settings tab, under Rule type, select Apply action group option.
 Now, the connection to the ServiceNow instance is successfully established and the alerts reflect in the portal as incidents.


In the ServiceNow portal, you can see your list of incidents under the Microsoft OMS Integrator – OMS Incidents tab.

Status of an alert when it’s closed
Irrespective of the alert being a rule or monitor alert, if the alert is closed in the System Center Operations Manager Ops Console, the closed state of the alert will be reflected in the Azure Monitor portal with the Alert condition changing from Fired to Resolved.
Note
- We don’t recommend closing a monitor alert manually in the Azure Monitor portal. For more information, see How to Close an Alert Generated by a Monitor.
- If you close a rule-based alert in the Azure Monitor portal, the change will not be reflected in the System Center Operations Manager Ops Console.
Feedback
Coming soon: Throughout 2024 we will be phasing out GitHub Issues as the feedback mechanism for content and replacing it with a new feedback system. For more information see: https://aka.ms/ContentUserFeedback.
Submit and view feedback for