Troubleshoot Azure Kubernetes Service clusters or nodes in a failed state
This article discusses how to troubleshoot a Microsoft Azure Kubernetes Service (AKS) cluster or node that enters a failed state.
Common causes
Here are the common causes of a failed cluster or node pool:
| Cause | Reference |
|---|---|
| Custom Script Extension (CSE) virtual machine (VM) extension provisioning error | Troubleshoot node not ready failures caused by CSE errors |
| Key Azure resources unavailable | |
| VM allocation failure due to no zonal/regional capacity | |
| VM allocation failure due to exceeded core quota | Quotaexceeded error |
| Customer imposed restrictions | |
| Workload issues |
Basic troubleshooting of common errors causing a cluster/node to fail
The following table outlines some common errors that can cause a cluster or node to enter a failed state, their descriptions, and basic troubleshooting methods to resolve these errors.
| Error | Description | Troubleshooting method |
|---|---|---|
| OutboundConnFailVMExtensionError | This error indicates that the VM extension fails to install or update due to a lack of outbound connectivity. | Check the network security group (NSG) rules and firewall settings of the VM or VM scale set. Make sure that the VM or VM scale set can access these endpoints: https://aka.ms/aks/outbound, https://aka.ms/aks/ssh, https://aka.ms/aks/agent, and https://aka.ms/aks/containerinsights. |
| Drain error | This error indicates that the node fails to drain before the upgrade operation. | Check the pod status and events on the node using the kubectl commands: kubectl get pods --all-namespaces -o wide and kubectl describe pod <pod-name> -n <namespace>. Look for any pods stuck in a terminated or unknown state or with any errors or warnings in the events. You may need to force delete the pods or restart the kubelet service on the node. |
| SubscriptionNotRegistered error | This error indicates that the subscription isn't registered to use the AKS resource provider. | Register the subscription using the az provider register --namespace Microsoft.ContainerService command. |
| RequestDisallowedByPolicy error | This error indicates that the operation is blocked by a policy applied to the subscription or resource group. | Review the policy details and policy assignment scopes. To allow the operation, you may need to modify or exclude the policy. |
| QuotaExceeded error | This error indicates that the operation exceeds the quota limit for a resource type or a region. | Check the current quota usage and quota limit for the resource type or region using the Azure portal, Azure CLI, or Azure PowerShell. You may need to delete some unused resources or request a quota increase. |
| PublicIPCountLimitReached error | This error indicates that the operation reaches the maximum number of public IP addresses that can be created in a subscription or region. | Check the current public IP address usage and limit for the subscription or region using the Azure portal, Azure CLI, or Azure PowerShell. You may need to delete some unused public IP addresses or request an increase in the public IP address limit. |
| OverconstrainedAllocationRequest error | This error indicates that the operation fails to allocate the requested VM size in a region. | Check the availability of the VM size in the region using the Azure portal, Azure CLI, or Azure PowerShell. You may need to choose a different VM size or a different region. |
| ReadOnlyDisabledSubscription error | This error indicates that the subscription is currently disabled and set to read-only. | Review and adjust the subscription permissions, as the subscription may have been suspended due to billing issues, expired credit, or policy violations. |
Basic troubleshooting of other possible issues causing a cluster/node to fail
This table describes other possible issues that can cause a cluster or node to enter a failed state, their descriptions, and solutions to fix these issues.
| Issue | Description | Solution |
|---|---|---|
| The subnet size is too small | The operation can't create or update the cluster because the subnet doesn't have enough space accommodate the required number of nodes. | Delete the node pool and create a new one with a larger subnet size using the Azure portal, Azure CLI, or Azure PowerShell. |
| The virtual network is blocked | The operation can't communitcate with the cluster API server or Kubernetes control plane because the firewall or a custom Domain Name System (DNS) setting blocks the outbound connections from the nodes. | Allow the node's traffic on the firewall and set up the DNS resolution to Azure using the Azure portal, Azure CLI, or Azure PowerShell. |
| PDB problems | The operation can't update the cluster because a PDB stopped the removal of one or more pods. A PDB is a resource that limits how many pods can be voluntarily terminated during a specific period. | Temporarily remove the PDB, reconcile the cluster, and then add the PDB again using the kubectl command-line tool. |
| Infrastructure issues | The operation can't update the cluster because of an internal issue with the Azure Resource Manager (ARM) service that manages resources in Azure. | Do an agent pool reconciliation for each node pool and a reconciliation for the managed cluster using the Azure CLI or Azure PowerShell. |
| API server errors | The operation can't reach the cluster API server or Kubernetes control plane because of an outage or a bug. | Report it to the AKS support team and provide the relevant logs and diagnostic information. You can get the logs and diagnostic information using the Azure portal, Azure CLI, or Azure PowerShell. |
Note
- The operation mentioned in the previous table refers to any update (
PUT) operation triggered from the customer side. - In Kubernetes, there's a component within a controller. It ensures the actual state of the world, including the cluster state and potentially external states like running containers for Kubelet or load balancers for a cloud provider. It aligns with the desired state specified in an object. This alignment process is a key function of the controller. For AKS, this component ensures that the state of the AKS cluster aligns with the desired configuration. To trigger it manually, run
az resource update --ids <AKS cluster id>. You can get the AKS cluster ID by runningaz aks show -n <cluster name> -g <cluster resource group> -o json --query id. If there are any differences between the actual and desired states, take necessary actions to correct these discrepancies.
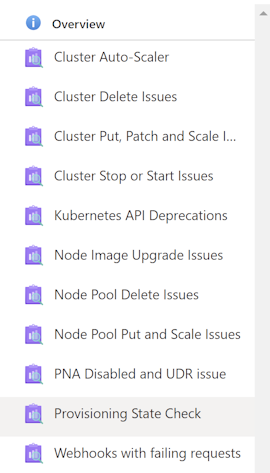
Provisioning State Check
To check the cluster status, select Provisioning State Check. Then, the provisioning state of the cluster and agent pool is shown.
Scenario 1: Cluster is in a failed state
To resolve this issue, get the operation that causes the failure and figure out the error. Here are two common operation failures that can result in a failed cluster:
- Cluster creation failed
- Cluster upgrade failed
If a recently created or upgraded cluster is in a failed state, use the following methods to troubleshoot the failure:
Examine the activity log to identify the root cause of the failure.
You can view the activity log using the Azure portal, Azure CLI, or Azure PowerShell.
The activity log can show you the error code and message associated with the failure. For more information about specific errors, see the Basic troubleshooting of common errors causing a cluster/node to fail section.
Use the AKS Diagnose and Solve Problems feature to troubleshoot and resolve common issues.
Note
This feature is only available in the Azure portal and Azure CLI.
View the activity log for a failed cluster using the Azure portal
To view the activity logs for a failed cluster from the Azure portal, follow these steps:
In the Azure portal, go to the Resource groups page and select the resource group that contains your cluster.
On the Overview page, select the cluster name from the resource list.
On the cluster page, select Activity log from the left menu.
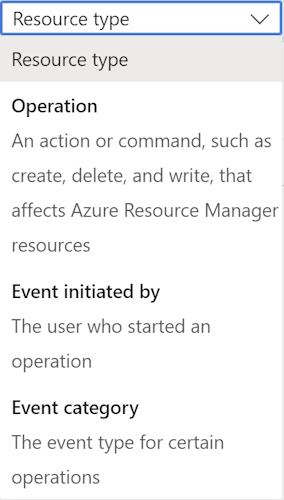
On the Activity log page, you can filter events by Status, Timespan, Event initiated by, and Event category. For example, you can select Failed from the Status drop-down list to see only failed events.
To check the details of an event, select the event name from the list. A new pane opens with the event summary, properties, and JSON data. You can also download the JSON data as a file.
To check the error code and message associated with the event, scroll down to the Status section in the event summary. You can also find the error information in the properties and JSON data sections.
View the activity log for a failed cluster using the Azure CLI
If you prefer to use Azure CLI to view the activity log for a failed cluster, follow these steps:
Install Azure CLI on your machine and log in with your Azure account.
List the resource groups in your subscription using the
az group listcommand and find the name of the resource group that contains your cluster.List the resources in the resource group using the
az resource listcommand with the--resource-groupparameter and find the name of the cluster.List the cluster's activity log using the
az monitor activity-log listcommand with the--resource-groupand--resourceparameters. You can also use the--status,--start-time,--end-time,--caller, and--filterparameters to filter events by different criteria. For example, you can use--status Failedto see only failed events.Show the details of a specific event using the
az monitor activity-log showcommand with the--resource-group,--resource, and--event-idparameters. You can find the event ID from the output of the previous command. The output will include the event summary, properties, and JSON data. You can also use the--outputparameter to change the output format.To see the error code and message associated with the event, look for the
statusMessagefield in the command output. You can also find the error information in the properties and JSON data sections.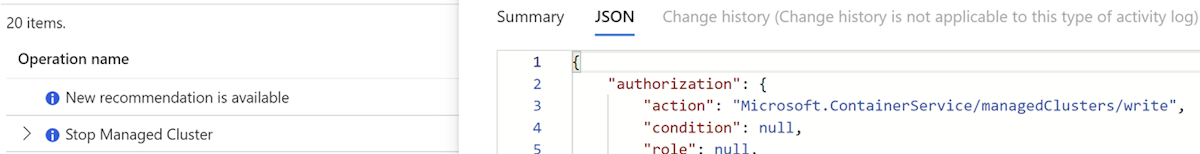

Use the AKS Diagnose and Solve Problems feature for a failed cluster
In the Azure portal, navigate to your AKS cluster resource and select Diagnose and solve problems from the left menu. You'll see a list of categories and scenarios that you can select to run diagnostic checks and get recommended solutions.
In the Azure CLI, use the az aks collect command with the --name and --resource-group parameters to collect diagnostic data from your cluster nodes. You can also use the --storage-account and --sas-token parameters to specify an Azure Storage account where the data will be uploaded. The output will include a link to the Diagnose and Solve Problems blade where you can view the results and suggested actions.
In the Diagnose and Solve Problems blade, you can select Cluster Issues as the category. If any issues are detected, you'll see a list of possible solutions that you can follow to fix them.

Scenario 2: Node is in a failed state
In rare cases, an Azure Disk detach operation may partially fail, which leaves the node VM in a failed state.
To resolve this issue, manually update the VM status using one of the following methods:
For a cluster that's based on an availability set, run the following az vm update command:
az vm update --resource-group <resource-group-name> --name <vm-name>For a cluster that's based on a VM scale set, run the following az vmss update-instances command:
az vmss update-instances --resource-group <resource-group-name> --name <scale-set-name> --instance-id <vm-or-scale-set-id>
Scenario 3: Node pool is in a failed state
This issue can happen when the VM scale set or availability set that backs the node pool encounters an error during provisioning, scaling, or updating. This issue can be due to insufficient capacity, quota limits, network issues, policy violations, resource locks, or other factors that prevent the VM from being allocated or configured properly.
To troubleshoot this issue, follow these steps:
- Check the status of the node pool using the
az aks nodepool showcommand. If the provisioning state isFailed, you can see the error message and code in the output. - Check the status of the VM scale set or availability set using the
az vmss showoraz vm availability-set showcommand. If the provisioning state isFailed, you can see the error message and code in the output. - Check the status of the individual VM in the node pool using the
az vmss list-instancesoraz vm listcommand. If any VM is in aFailedorUnhealthystate, you can see the error message and code in the output. - Check the activity log and diagnostic setting of the VM scale set or availability set to see if any events or alerts that indicate the cause of the failure. You can use the Azure portal, Azure CLI, or Azure Monitor API to access the activity log and diagnostic setting.
- Check the quota and capacity of the region and subscription where the node pool is deployed. You can use the
az vm list-usagecommand or the Azure portal to check the quota and capacity. If the quota or capacity limit is reached, you can request an increase or delete some unused resources. - Check the policy and role assignments of the node pool. You can use the
az policyandaz rolecommands or the Azure portal to check the policy definitions, assignments, compliance, and exemptions. You can also check the role assignments and permissions of the node pool using theaz role assignmentcommand or the Azure portal. - Check the resource locks of the node pool. You can use the
az lockcommand or the Azure portal to check the lock level, scope, and notes. You can also delete or update the lock if needed.
Other logging and diagnostic tools
If the previous troubleshooting methods don't resolve your issue, you can use the following logging and diagnostic tools to collect more information and identify the root cause:
Azure Monitor for containers:
This service collects and analyzes metrics and logs from AKS clusters and the nodes. Azure Monitor for containers can monitor cluster and node health, performance, and availability. You can also use it to view container logs, kubelet logs, and node boot diagnostic logs.
-
This tool collects node and pod logs, network information, and cluster configuration from an AKS cluster and uploads them to an Azure storage account. This tool can help you troubleshoot common cluster issues, such as DNS resolution, network connectivity, and node status. You can also use it to generate a support request with the collected logs attached.
AKS Diagnostics
This tool runs a series of checks on AKS clusters and the nodes and provides recommendations and remediation steps for common issues. This tool can help you troubleshoot issues related to cluster creation, upgrade, scaling, networking, storage, and security. You can also use it to generate a support request with the diagnostic results attached.
Contact us for help
If you have questions or need help, create a support request, or ask Azure community support. You can also submit product feedback to Azure feedback community.
Feedback
Coming soon: Throughout 2024 we will be phasing out GitHub Issues as the feedback mechanism for content and replacing it with a new feedback system. For more information see: https://aka.ms/ContentUserFeedback.
Submit and view feedback for