Use time travel debugging to record and replay ASP.NET apps on Azure VMs
Time travel debugging in Visual Studio Enterprise can record a web app running on an Azure virtual machine (VM), and then accurately reconstruct and replay the execution path. Time Travel Debugging (TTD) was added to Visual Studio 2019 Enterprise as a preview feature, and is now integrated into the Visual Studio Snapshot Debugger.
Time travel debugging lets you rewind and replay each line of code as many times as you want. This procedure can help you isolate and identify problems that might occur only in production environments.
Capturing a time travel debugging recording doesn't halt your app, but it adds significant overhead to the running process. The amount of slowdown depends on factors like process size and the number of active threads.
In this tutorial, you:
- Start the Snapshot Debugger with TTD.
- Set a snappoint and collect a time travel recording.
- Debug the time travel recording.
Prerequisites
Visual Studio Enterprise 2019 or higher with the Azure development workload installed.
In the Visual Studio Installer, make sure Snapshot Debugger is selected under Debugging and testing on the Individual components tab.
An ASP.NET (AMD64) web app running on .NET Framework 4.8 or later on an Azure VM.
Attach the Snapshot Debugger
Open the project for the app you want to debug.
Important
Make sure to open the same version of source code that's published to your Azure VM.
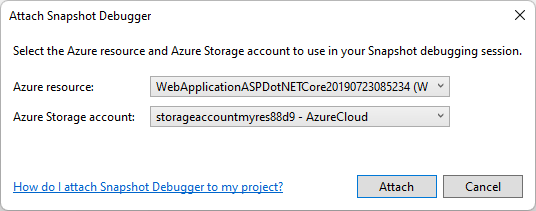
Choose Debug > Attach Snapshot Debugger. Select the Azure VM your web app is deployed to, and an Azure Storage account, and then select Attach.
Important
The first time you select Attach Snapshot Debugger, IIS automatically restarts on your VM.
Visual Studio is now in snapshot debugging mode.

Note
The Application Insights site extension also supports Snapshot Debugging. If you get a site extension out of date error message, see Site Extension Upgrade for upgrading details.
The metadata for the modules isn't initially activated. Navigate to the web app to load the modules.
The Modules window shows you when all the modules are loaded for the Azure VM. To open the Modules window, select Debug > Windows > Modules.

Once all modules are loaded, you can select the Start Collection button in the Visual Studio toolbar.
Set a snappoint
To set a snappoint, in the code editor, click the left gutter next to a method you're interested in. Make sure you know that the code executes.
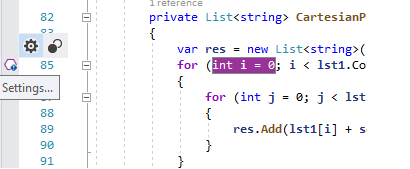
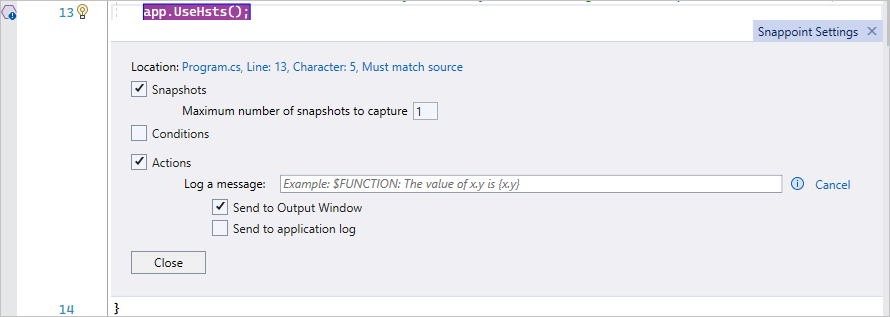
Right-click the snappoint hollow sphere icon and choose Actions to show the Snapshot Settings window.
Take the snapshot
Select Start Collection in the toolbar to turn on the snappoint.

When you turn on the snappoint, it captures a snapshot when the line of code it's placed on executes. The execution might require a request on your server. To force your snappoint to hit, go to the browser view of your website and take any required actions.
By default, the snappoint captures only one snapshot. After the snappoint captures a snapshot, it turns off. If you want to capture another snapshot at the snappoint, you can turn the snappoint back on by selecting Update Collection.
Debug a time travel recording
When the snappoint is hit, a snapshot appears in the Diagnostic Tools window. If this window isn't open, open it by selecting Debug > Windows > Show Diagnostic Tools.
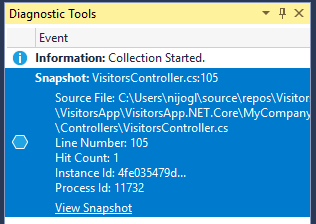
Select View Snapshot to open the time travel recording in the code editor.
You can execute every line of code that time travel debugging recorded by using the Continue and Reverse Continue buttons.
You can also use the Debug toolbar to Show Next Statement, Step Into, Step Over, Step Out, Step Back Into, Step Back Over, and Step Back Out.

You can also use the Visual Studio Locals, Watches, and Call Stack windows, and evaluate expressions.
The website is still live, and end users aren't impacted by time travel debugging activity.
For more information and help, see Troubleshooting and known issues for snapshot debugging in Visual Studio.
Set a conditional snappoint
If it's difficult to recreate a particular state in your app, consider using a conditional snappoint. Conditional snappoints help you avoid collecting a recording until the app enters a desired state, such as when a variable has a particular value. For more information about setting conditions based on expressions, filters, or hit counts, see Breakpoint conditions.
Related content
In this tutorial, you learned how to use the Snapshot Debugger to collect a time travel recording for Azure VMs. Learn more about snapshot debugging:
Feedback
Coming soon: Throughout 2024 we will be phasing out GitHub Issues as the feedback mechanism for content and replacing it with a new feedback system. For more information see: https://aka.ms/ContentUserFeedback.
Submit and view feedback for