Tutorial: Debug C# and C++ in the same debugging session
Visual Studio lets you enable more than one debugger type in a debugging session, which is called mixed-mode debugging. In this tutorial, you learn to debug both managed and native code in a single debugging session.
This tutorial shows how to debug native code from a managed app, but you can also debug managed code from a native app. The debugger also supports other types of mixed-mode debugging, such as debugging Python and native code, and using the script debugger in app types such as ASP.NET.
In this tutorial, you will:
- Create a simple native DLL
- Create a simple .NET Core or .NET Framework app to call the DLL
- Configure mixed-mode debugging
- Start the debugger
- Hit a breakpoint in the managed app
- Step into the native code
Prerequisites
You must have Visual Studio installed, with the following workloads:
- Desktop development with C++
- .NET desktop development
You must have Visual Studio installed, with the following workloads:
- Desktop development with C++
- .NET desktop development or .NET Core cross platform development, depending on the type of app that you want to create.
If you don't have Visual Studio, go to the Visual Studio downloads page to install it for free.
If you have Visual Studio installed, but don't have the workloads you need, select Open Visual Studio Installer in the left pane of the Visual Studio New Project dialog box. In the Visual Studio Installer, select the workloads you need, and then select Modify.
Create a simple native DLL
To create the files for the DLL project:
Open Visual Studio and create a project.
Press Esc to close the start window. Type Ctrl + Q to open the search box, type Empty Project, choose Templates, then choose Empty Project for C++. In the dialog box that appears, choose Create. Then, type a name like Mixed_Mode_Debugging and click Create.
If you don't see the Empty Project project template, go to Tools > Get Tools and Features..., which opens the Visual Studio Installer. The Visual Studio Installer launches. Choose the Desktop development with C++ workload, then choose Modify.
Visual Studio creates the project.
In Solution Explorer, select Source Files, and then select Project > Add New Item. Or, right-click Source Files and select Add > New Item.
If you don't see all the item templates, choose Show All Templates.
In the New Item dialog, select C++ file (.cpp). Type Mixed_Mode.cpp in the Name field, and then select Add.
Visual Studio adds the new C++ file to Solution Explorer.
Copy the following code into Mixed_Mode.cpp:
#include "Mixed_Mode.h"In Solution Explorer, select Header Files, and then select Project > Add New Item. Or, right-click Header Files and select Add > New Item.
If you don't see all the item templates, choose Show All Templates.
In the New Item dialog, select Header file (.h). Type Mixed_Mode.h in the Name field, and then select Add.
Visual Studio adds the new header file to Solution Explorer.
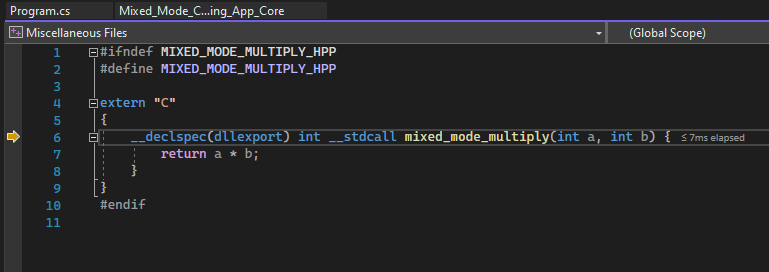
Copy the following code into Mixed_Mode.h:
#ifndef MIXED_MODE_MULTIPLY_HPP
#define MIXED_MODE_MULTIPLY_HPP

extern "C"
{
  __declspec(dllexport) int __stdcall mixed_mode_multiply(int a, int b) {
    return a * b;
  }
}
#endif
Select File > Save All or press Ctrl+Shift+S to save the files.
To configure and build the DLL project:
In the Visual Studio toolbar, select Debug configuration and x86 or x64 platform. If your calling app will be .NET Core, which always runs in 64-bit mode, select x64 as the platform.
In Solution Explorer, select the Mixed_Mode_Debugging project node and select the Properties icon, or right-click the project node and select Properties.
At the top of the Properties pane, make sure the Configuration is set to Active(Debug) and the Platform is the same as what you set in the toolbar: x64, or Win32 for x86 platform.
Important
If you switch platform from x86 to x64 or vice versa, you must reconfigure the properties for the new platform.
Under Configuration Properties in the left pane, select Linker > Advanced, and in the dropdown next to No Entry Point, select No. If you had to change it to No, select Apply.
Under Configuration Properties, select General, and in the dropdown next to Configuration Type, select Dynamic Library (.dll). Select Apply, and then select OK.

Select the project in Solution Explorer and then select Build > Build Solution, press F7, or right-click the project and select Build.
The project should build with no errors.
Create a simple managed app to call the DLL
Open Visual Studio and create a new project.
Press Esc to close the start window. Type Ctrl + Q to open the search box, type console, choose Templates, and then choose Console App for .NET Core or Console App (.NET Framework) for C#. In the dialog box that appears, choose Next.
Then, type a name like Mixed_Mode_Calling_App and click Next or Create, whichever option is available.
For .NET Core, choose either the recommended target framework or .NET 8, and then choose Create.
If you don't see the correct project template, go to Tools > Get Tools and Features..., which opens the Visual Studio Installer. Choose the correct .NET workload as described in the prerequisites, and then choose Modify.
Note
You could also add the new managed project to your existing C++ solution. We are creating the project in a new solution to make the mixed-mode debugging task more difficult.
Visual Studio creates the empty project and displays it in Solution Explorer.
Replace all the code in Program.cs with the following code:
using System;
using System.Runtime.InteropServices;

namespace Mixed_Mode_Calling_App
{
    public class Program
    {
        // Replace the file path shown here with the
        // file path on your computer. For .NET Core, the typical (default) path
        // for a 64-bit DLL might look like this:
        // C:\Users\username\source\repos\Mixed_Mode_Debugging\x64\Debug\Mixed_Mode_Debugging.dll
        // Here, we show a typical path for a DLL targeting the **x86** option.
        [DllImport(@"C:\Users\username\source\repos\Mixed_Mode_Debugging\Debug\Mixed_Mode_Debugging.dll", EntryPoint =
        "mixed_mode_multiply", CallingConvention = CallingConvention.StdCall)]
        public static extern int Multiply(int x, int y);
        public static void Main(string[] args)
        {
            int result = Multiply(7, 7);
            Console.WriteLine("The answer is {0}", result);
            Console.ReadKey();
        }
    }
}
In the new code, replace the file path in
[DllImport]with your file path to the Mixed_Mode_Debugging.dll you just created. See the code comment for hints. Make sure to replace the username placeholder.Select File > Save Program.cs or press Ctrl+S to save the file.
Configure mixed-mode debugging
In Solution Explorer, select the Mixed_Mode_Calling_App project node and select the Properties icon, or right-click the project node and select Properties.
Enable native code debugging in the properties.
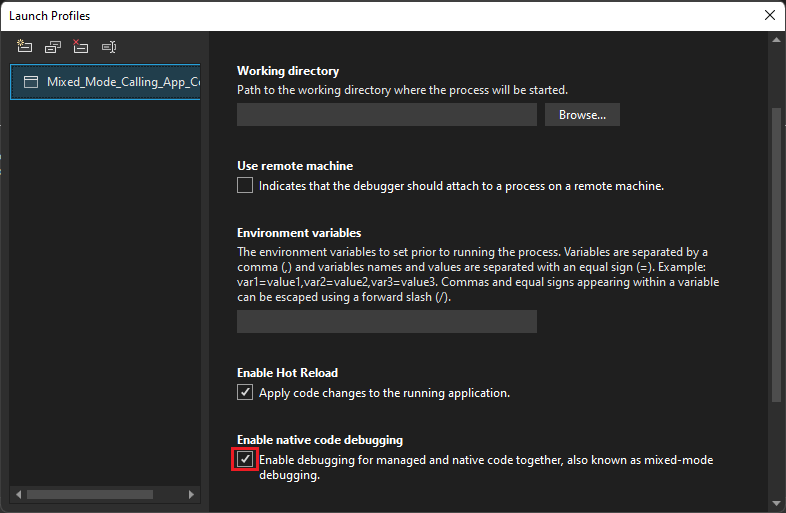
Select Debug in the left pane, select Open debug launch profiles UI, then select the Enable native code debugging check box, and then close the properties page to save the changes.
Select Debug in the left pane, select the Enable native code debugging check box, and then close the properties page to save the changes.

If you are targeting an x64 DLL from a .NET Framework app, change the platform target from Any CPU to x64. To do this, you may need to select Configuration Manager from the Debug toolbar's Solution Platform drop-down. Then, if you can't switch to x64 directly, create a New Configuration that targets x64.
Set a breakpoint and start debugging
In the C# project, open Program.cs. Set a breakpoint on the following line of code by clicking in the far left margin, selecting the line and pressing F9, or right-clicking the line and selecting Breakpoint > Insert Breakpoint.
int result = Multiply(7, 7);A red circle appears in the left margin where you set the breakpoint.
Press F5, select the green arrow in the Visual Studio toolbar, or select Debug > Start Debugging to start debugging.
The debugger pauses on the breakpoint that you set. A yellow arrow indicates where the debugger is currently paused.
Step in and out of native code
While debugging is paused in the managed app, press F11, or select Debug > Step Into.
The Mixed_Mode.h native header file opens, and you see the yellow arrow where the debugger is paused.

Now, you can set and hit breakpoints and inspect variables in the native or managed code.
Hover over variables in the source code to see their values.
Look at variable and their values in the Autos and Locals windows.
While paused in the debugger, you can also use the Watch windows and the Call Stack window.
Press F11 again to advance the debugger one line.
Press Shift+F11 or select Debug > Step Out to continue execution and pause again in the managed app.
Press F5 or select the green arrow to continue debugging the app.
Congratulations! You have completed the tutorial on mixed-mode debugging.
Next step
In this tutorial, you learned how to debug native code from a managed app by enabling mixed-mode debugging. For an overview of other debugger features, see:
Feedback
Coming soon: Throughout 2024 we will be phasing out GitHub Issues as the feedback mechanism for content and replacing it with a new feedback system. For more information see: https://aka.ms/ContentUserFeedback.
Submit and view feedback for