Tutorial: Create a Node.js and Express app in Visual Studio
In this article, you will learn how to use Visual Studio to build a simple Node.js web app that uses the Express framework.
Before you begin, here's a quick FAQ to introduce you to some key concepts:
What is Node.js?
Node.js is a server-side JavaScript runtime environment that executes JavaScript code.
What is npm?
A package manager makes it easier to use and share Node.js source code libraries. The default package manager for Node.js is npm. The npm package manager simplifies the installation, updating, and uninstallation of libraries.
What is Express?
Express is a server web application framework that Node.js uses to build web apps. With Express, there are many different ways to create a user interface. The implementation provided in this tutorial uses the Express application generator's default template engine, called Pug, to render the front-end.
Prerequisites
Make sure to install the following:
- Visual Studio 2022 version 17.4 or later with the ASP.NET and web development workload installed. Go to the Visual Studio downloads page to install it for free. If you need to install the workload and already have Visual Studio, go to Tools > Get Tools and Features..., which opens the Visual Studio Installer. Choose the ASP.NET and web development workload, then choose Modify.
- npm (
https://www.npmjs.com/), which is included with Node.js - npx (
https://www.npmjs.com/package/npx)
Create your app
In the Start window (choose File > Start Window to open), select Create a new project.

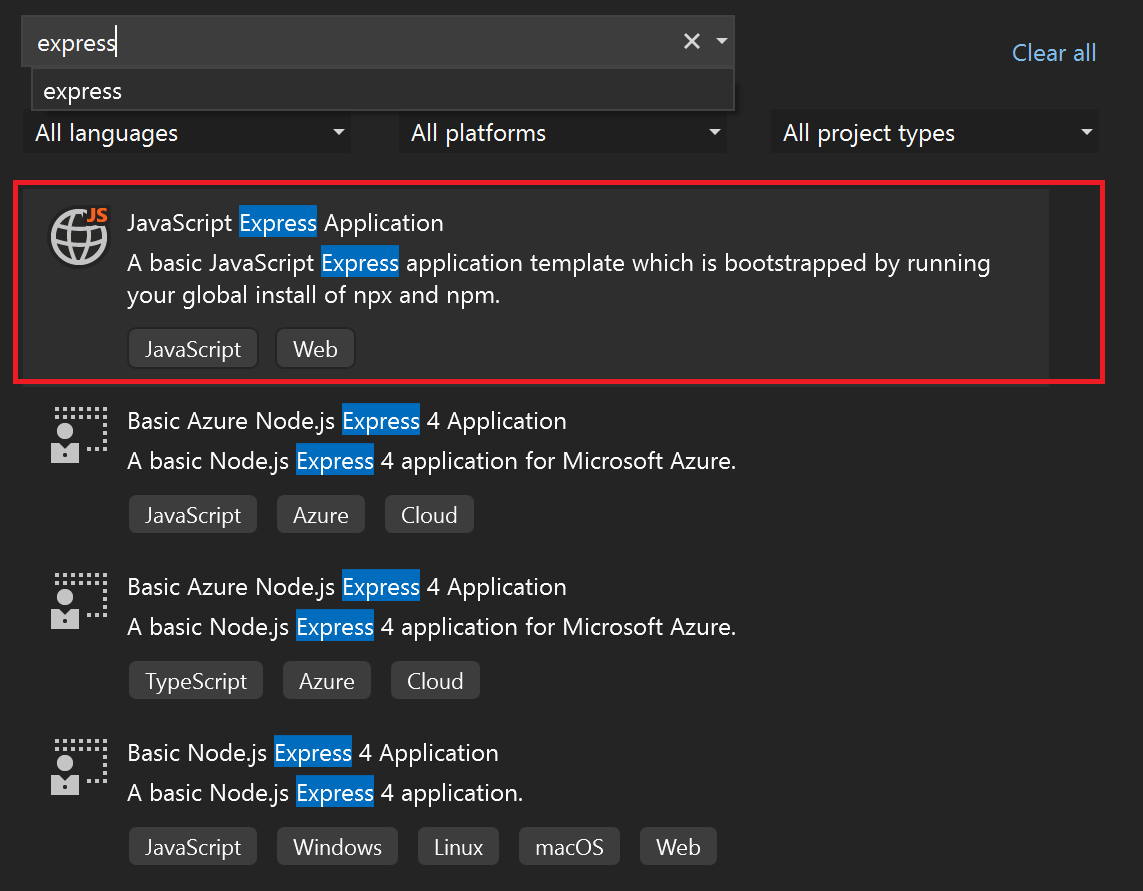
Search for Express in the search bar at the top and then select JavaScript Express Application.
Give your project and solution a name.
View the project properties
The default project settings allow you to build and debug the project. But, if you need to change settings, right-click the project in Solution Explorer, select Properties, and then go the Build or Debugging section.
Note
launch.json stores the startup settings associated with the Start button in the Debug toolbar. Currently, launch.json must be located under the .vscode folder.
Build your project
Choose Build > Build Solution to build the project.
Start your app
Press F5 or select the Start button at the top of the window, and you'll see a command prompt:
- npm running the node ./bin/www command
Note
Check console output for messages, such as a message instructing you to update your version of Node.js.
Next, you should see the base Express app appear!
Debug your app
We will now go through a couple of ways you can debug your app.
First, if your app is still running, press Shift + F5 or select the red stop button at the top of the window in order to stop the current session. You might notice that stopping the session closes the browser showing your app, but leaves behind the command prompt window running the Node process. For now, go ahead and close any lingering command prompts. Later in this article, we describe why you might want to leave the Node process running.
Debugging the Node process
In the dropdown next to the Start button, you should see the following start options:
- localhost (Edge)
- localhost (Chrome)
- Debug Dev Env
- Launch Node and Browser
Go ahead and select the Launch Node and Browser option. Now, before pressing F5 or selecting the Start button again, set a breakpoint in index.js (in the routes folder) by selecting the left gutter before the following line of code: res.render('index', { title: 'Express' });
Tip
You can also put your cursor on a line of code and hit F9 to toggle the breakpoint for that line.
Then, press F5 or select Debug > Start Debugging to debug your app.
You should see the debugger pause at the breakpoint you just set. While it is paused, you can inspect your app state. Hovering over variables will let you examine their properties.
When you're finished inspecting the state, hit F5 to continue, and your app should load as expected.
This time, if you hit stop, you will notice that both the browser and the command prompt windows close. To see why, take a closer look at the launch.json.
Understanding the launch.json
The launch.json is currently located in the .vscode folder. If you cannot see the .vscode folder in Solution Explorer, select Show All Files.
If you have worked with Visual Studio Code before, the launch.json file will look familiar. The launch.json here works in much the same way as it does in Visual Studio Code to denote launch configurations used for debugging. Each entry specifies one or more targets to be debugged.
The first two entries are browser entries, and they should look something like this:
    {
      "name": "localhost (Edge)",
      "type": "edge",
      "request": "launch",
      "url": "http://localhost:3000",
      "webRoot": "${workspaceFolder}\\public"
    },
    {
      "name": "localhost (Chrome)",
      "type": "chrome",
      "request": "launch",
      "url": "http://localhost:3000",
      "webRoot": "${workspaceFolder}\\public"
    }
You can see in the above entries that the type is set to a browser type. If you launch with only a browser type as the sole debug target, Visual Studio will debug only the frontend browser process, and the Node process will be started without a debugger attached, meaning that any breakpoints that are set in the Node process will not bind.
Upon stopping the session, the Node process will also continue to run. It is intentionally left running when a browser is the debug target, because if work is solely being done on the frontend, having the backend process continuously running eases the development workflow.
At the start of this section, you closed the lingering command prompt window in order to set breakpoints in the Node process. For the Node process to be debuggable, it must be restarted with the debugger attached. If a non-debuggable Node process is left running, attempting to launch the Node process in debug mode (without reconfiguring the port) will fail.
Note
Currently, edge and chrome are the only supported browser types for debugging.
The third entry in the launch.json specifies node as the debug type, and it should look something like this:
    {
      "name": "Debug Dev Env",
      "type": "node",
      "request": "launch",
      "cwd": "${workspaceFolder}/bin",
      "program": "${workspaceFolder}/bin/www",
      "stopOnEntry": true
    }
This entry will launch only the Node process in debug mode. No browser will be launched.
The fourth entry provided in the "launch.json* is the following compound launch configuration.
    {
      "name": "Launch Node and Browser",
      "configurations": [
        "Debug Dev Env",
        "localhost (Edge)"
      ]
    }
This compound configuration is the same as a vscode compound launch configuration, and selecting it allows you to debug both the frontend and backend. You can see that it simply references the individual launch configurations for the Node and browser processes.
There are many other attributes you can use in a launch configuration. For example, you can hide a configuration from the dropdown, but still have it be referenceable, by setting the hidden attribute in the presentation object to true.
    {
      "name": "localhost (Chrome)",
      "type": "chrome",
      "request": "launch",
      "url": "http://localhost:3000",
      "webRoot": "${workspaceFolder}\\public",
      "presentation": {
        "hidden": true
      }
    }
Click Options for a list of attributes you can use to enhance your debugging experience. Please note that at the moment, only launch configurations are supported. Any attempt to use an attach configuration will result in a deployment failure.
Feedback
Coming soon: Throughout 2024 we will be phasing out GitHub Issues as the feedback mechanism for content and replacing it with a new feedback system. For more information see: https://aka.ms/ContentUserFeedback.
Submit and view feedback for