Profile Python code in Visual Studio
Visual Studio provides profiling features for Python applications when you debug your code. The Visual Studio Debugger lets you step through your code to check variables, analyze program state, resolve potential issues, and so on. Visual Studio profiling features provide information about execution times for your program. You can use this information to help identify performance issues in your code.
Profiling is available for Python 3.9 and earlier when you use a CPython-based interpreter.
Prerequisites
Visual Studio on Windows installed with support for Python workloads. For more information, see Install Python support in Visual Studio.
A CPython-based interpreter. CPython is the "native" and most commonly used interpreter and is available in 32-bit and 64-bit versions (32-bit recommended). For more information, see Install Python interpreters.
A Python project with code or a folder with Python code.
Visual Studio for Mac isn't currently supported. For more information, see What's happening to Visual Studio for Mac? Visual Studio Code on Windows, Mac, and Linux works well with Python through available extensions.
Use profiler with CPython-based interpreter
When you profile a Python application, Visual Studio collects data for the lifetime of the process.
Follow these steps to start working with the profiling features in Visual Studio:
In Visual Studio, open your Python code file.
Confirm the current environment for your Python code is a CPython-based interpreter. You can check the selected interpreter in the Python Environments window.
On the main toolbar, select Debug > Launch Python Profiling. Visual Studio opens the Profiling Settings dialog:
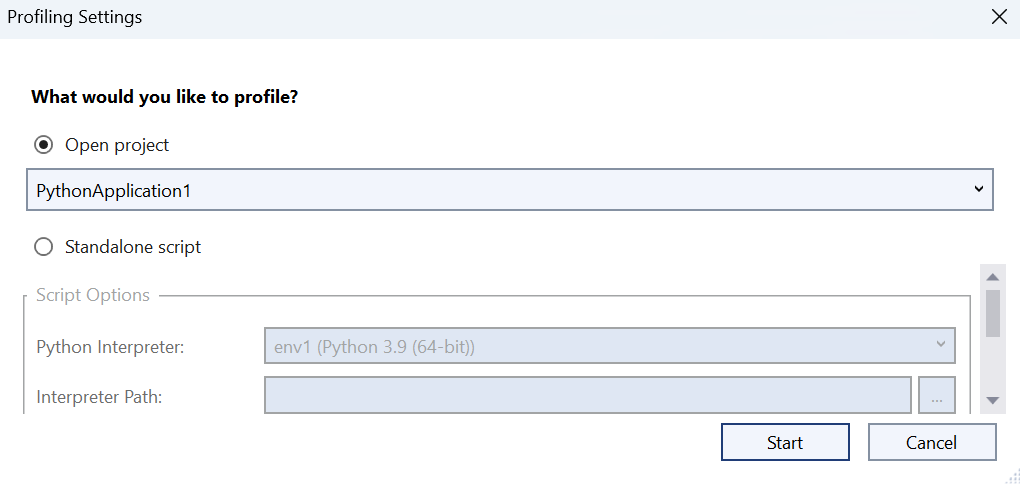
In the Profiling Settings dialog, choose the code file or project code that you want to profile:
To profile all project code:
Select Open project.
Select the project from the dropdown list. The list shows all projects in the current Visual Studio solution.
To profile a specific file:
Select Standalone script.
Select the Python Interpreter from the dropdown list or browse to the location. To specify an unlisted interpreter, choose Other in the dropdown list and then specify the Interpreter Path.
Identify the Script file or browse to the location.
Specify the Working Directory or browse to the location.
Specify any Command Line Arguments for the script.
Select Start.

The profiler runs and opens a performance report in Visual Studio. You can review the report to explore how time is spent in your application:


Use profiler with IronPython
IronPython is a .NET implementation of Python that's available in 32-bit and 64-bit versions. IronPython isn't a CPython-based interpreter. Visual Studio supports standard Python debugging for IronPython, but not the profiling features.
For IronPython projects, you can use the Visual Studio .NET profiler. Run the ipy.exe command directly as the target application with the appropriate arguments to launch your startup script. On the command line, include the -X:Debug argument to ensure all your Python code can be debugged and profiled. This argument generates a performance report that includes time spent in the IronPython runtime and your code. Your code is identified by using mangled names.
IronPython offers some built-in profiling, but there's currently no workable visualizer. For more information, see An IronPython Profiler (blog) and Debugging and Profiling in the IronPython documentation.
Related content
Feedback
Coming soon: Throughout 2024 we will be phasing out GitHub Issues as the feedback mechanism for content and replacing it with a new feedback system. For more information see: https://aka.ms/ContentUserFeedback.
Submit and view feedback for