Connect to the Microsoft Copilot Dashboard for Microsoft 365 customers
Note
The Microsoft Copilot Dashboard in Viva Insights is available to any customer with a Microsoft 365 or Office 365 subscription for business or enterprise. A paid Viva Insights license is not required.
Copilot for Microsoft 365 works alongside you to unleash your creativity and help you perform tasks faster. It helps summarize key points and action items in Microsoft Teams, draft new documents in Word, jumpstart replies in Outlook, and more.
The Microsoft Copilot Dashboard in Viva Insights helps organizations maximize the value of Copilot for Microsoft 365. It provides actionable insights to help your organization get ready to deploy AI, drive adoption based on how AI is transforming workplace behavior, and measure the impact of Copilot.
The dashboard covers the following categories of metrics: Readiness, adoption, impact, and sentiment. Metrics are aggregated at the tenant level.

Note
The Microsoft Copilot Dashboard is currently not available for national/regional cloud deployments including but not limited to Microsoft’s U.S. Government clouds and Office 365 operated by 21Vianet.
Access the dashboard in Viva Insights
Applies to: Employee users
If you have access to the Copilot Dashboard, you can find it in the Teams or web app.
Open the Teams app on desktop or the web. If you have the Viva Insights app pinned, select it from the left bar.
If you don’t have the Viva Insight app pinned, select the ellipses on the left. Then in the search field, enter Microsoft Viva Insights, and select it.
On the left navigation panel, select Copilot Dashboard.
To learn more about the data in the dashboard, refer to Interpreting the dashboard data.
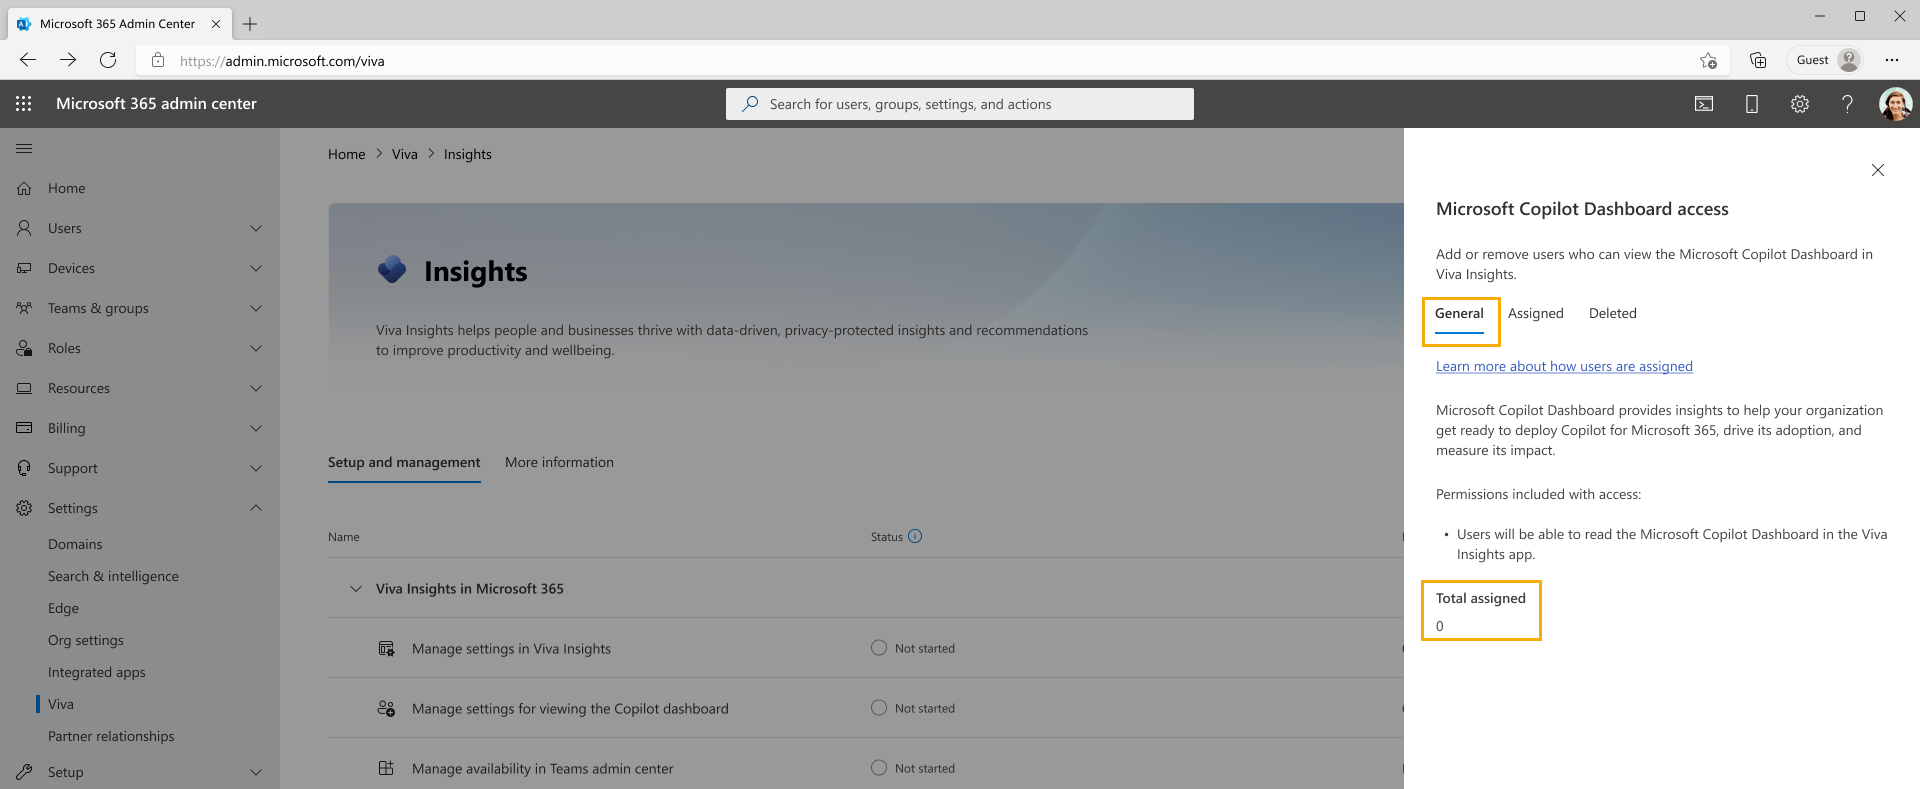
Manage user access to the dashboard in Viva Insights
Applies to: Global admins
Note
When you add or remove users to the dashboard, the change will go into effect in 24 hours.
In Viva Insights, the Copilot Dashboard is accessible in the Microsoft Teams and web app. Global admins manage access controls.
For customers who use Microsoft Entra ID (formerly known as Azure Active Directory) to manage user profile data like organization or manager data, the Copilot Dashboard is automatically available to a limited number of users. Access is based on Microsoft Entra ID Data, specifically the manager hierarchy attribute. Global admins can disable access at any time.
How default-on access is determined
Users who are senior leaders within large teams as determined by their Entra ID data manager attribute can automatically view the report. Tenants must meet all of the following criteria to qualify:
- Most users in the tenant have the Manager ID attribute assigned
- Most users in the tenant are part of a single reporting line
- The tenant has more than 2,500 seats
For those qualifying tenants, only users who meet both of the following criteria are enabled by default:
- The user’s in the top three levels in the organization
- The user has a significant portion of the organization in their reporting line
- Users who are assigned the Global administrator role also have access to the Microsoft Copilot Dashboard
The criteria above are analyzed on a weekly basis to capture any major org changes. Each week, any new users who meet the above criteria gain access to the dashboard. The Microsoft 365 Global Admin can revoke access to those users through the Microsoft 365 admin center and they are not added back unless the admin re-enables them. In addition, admins can disable access to the Copilot Dashboard for their entire organization.
Admins can also enable or disable automatic access to the dashboard using PowerShell.
To see how many employees have automatic access to the dashboard and to manage that access, use the process below.
Manage access for individual users
In the Microsoft 365 admin center:
Go to the Settings tab and select Microsoft Viva, then Viva Insights. You need to enter your credentials if you're not already signed in.
Under Viva Insights in Microsoft 365, select Manage settings for viewing the Copilot dashboard.
To see how many employees have automatic access, at the top, select General.

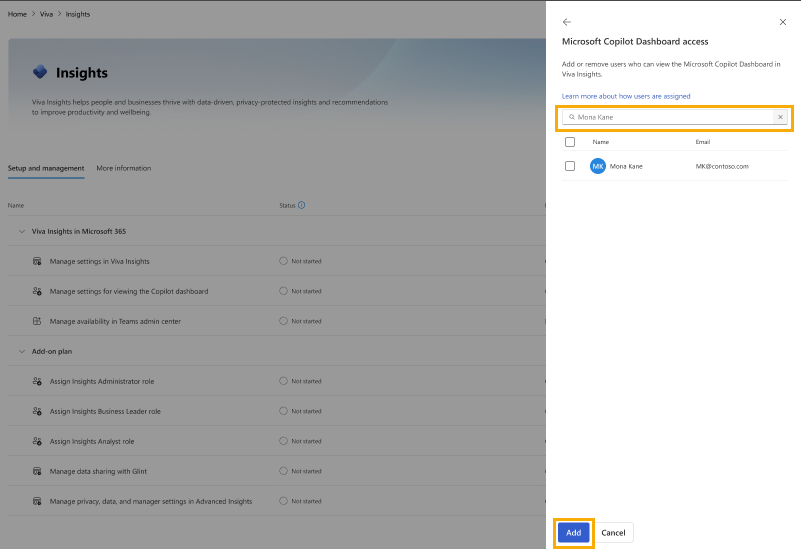
To enable access for new report users:
Select Add users.
Search for the people you'd like to add, and select them from the list.
At the bottom, select Add.
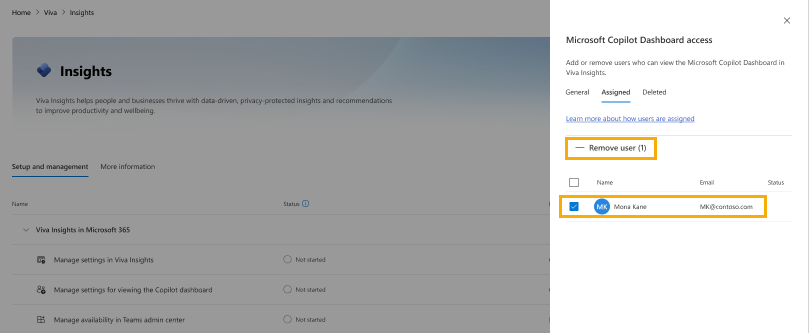
To disable access for existing report users:
At the top, select Assigned.
Select the users from the list for whom you'd like to remove access.
Select Remove user.
Note
Employees can view the dashboard in the Viva Insights Teams or web app. To install the Teams app, please use these instructions (it is on by default).
Remove access to the dashboard for the entire tenant with Powershell
You can set a policy to disable the dashboard for the tenant using Powershell cmdlets. This is a tenant-level policy, not a user or group-level policy. No users are able to access the dashboard until you remove or update the policy, even if they were added in the Microsoft 365 admin center using the process above. Before you can use the cmdlet, you need to install a module and sign in to be authenticated. Learn more about how to set these policies.
- Connect to Exchange Online and, when prompted, sign in with your admin credentials.
- After you’ve signed in, you can manage access for your tenant using the Add-VivaModuleFeaturePolicy cmdlet: Add-VivaModuleFeaturePolicy.
Example: Turn off the dashboard for all users in your tenant
 ModuleId : VivaInsights
 FeatureId : CopilotDashboard
 Name : DisableFeatureForAll
 IsFeatureEnabled : false
 Everyone
Turn dashboard auto-enablement on or off with Powershell
This granular feature access control allows admins to enable or disable the auto-enablement feature for the Copilot Dashboard for Viva Insights users in their tenant. This is a tenant-level policy, not a user or group-level policy. You can set tenant polices using Powershell cmdlets. Learn more about how to set these policies.
Default state: Enabled, meaning that Viva Insights licensed users will be auto-enabled for access to the dashboard based on the identification criteria.
Disable or enable: Admins can disable or enable the dashboard auto-enablement control using Viva feature access management (VFAM) cmdlets. Disabling the control prevents users from getting auto-enabled for access to the dashboard.
Connect to Exchange Online and, when prompted, sign in with your admin credentials.
After you’ve signed in, you can manage access for your tenant using the Add-VivaModuleFeaturePolicy cmdlet: Add-VivaModuleFeaturePolicy.
Example: Turn off dashboard auto-enablement for your tenant
 ModuleId : VivaInsights
 FeatureId : AutoCxoIdentification
 Name : DisableFeatureForAll
 IsFeatureEnabled : false
 Everyone
Important
The Copilot Dashboard in the Power BI app is no longer available to download. Customers who previously installed it can still use it for the time being but there will be no new version releases. Data refreshes will stop on April 1. Going forward, we recommend you access the dashboard in the Viva Insights app. The Microsoft Copilot Dashboard in Viva Insights is available to any customer with a Microsoft 365 or Office 365 subscription for business or enterprise. A paid Viva Insights license is not required.
If you previously downloaded the Power BI app, see the FAQs below to troubleshoot any issues.
Interpreting the data
Readiness
The information in this tab helps you assess your organization’s overall readiness for Copilot for Microsoft 365. The tab does not provide a comprehensive summary of all readiness and eligibility requirements. For a full set of requirements see this page: Microsoft 365 Copilot requirements.
Copilot activation progress
The metrics in this section summarize your organization’s progress towards activating Copilot for Microsoft 365 for your users. See detailed definitions in the table.
| Metric | Definition | More information |
|---|---|---|
| Total Microsoft 365 licenses | Number of prerequisite Microsoft 365 and Office 365 licenses purchased by your company. | Users must be assigned a prerequisite Microsoft 365 or Office 365 license in order to be assigned a Copilot for Microsoft 365 license. See the full list here. This metric represents a license count, not a user count, so the value shown here may be smaller or larger than your total employee count. The metric includes Microsoft 365 E3 and E5 Extra Features licenses in addition to standard Office 365 and Microsoft 365 licenses. |
| Total Copilot licenses | Number of Copilot for Microsoft 365 licenses purchased by your company. | This number may be smaller than the “Copilot licenses assigned” figure below because it's limited to Copilot for Microsoft 365 licenses, whereas the metric below may include users enabled for Copilot for Microsoft 365 service plans via other license types, like Copilot for Sales. |
| Copilot licenses assigned | Number of employees in your company who have been assigned a Copilot license. | This definition is consistent with the "assigned licenses" metric in the Copilot Readiness report in the Microsoft 365 Admin Center. This number may be larger than the number above (see explanation in row above). |
| Active Copilot users | Number of employees in your company who have completed at least one Copilot action over the previous 28 days. | A user is considered active if they performed an intentional action for an AI-powered capability in Copilot within Microsoft Teams, Copilot with Graph-grounded chat, Outlook, Word, Excel, PowerPoint, OneNote, or Loop. This is consistent with the definition used in Usage reports in the Microsoft 365 Admin Center. This number may exceed the number above because it counts all active users over the past 28 days, including users who have had their license removed after completing an action in Copilot, whereas the metric above is a snapshot of employees currently licensed to use Copilot for Microsoft 365. |
How Copilot can transform your work
This section of the tab summarizes how Copilot can benefit Microsoft 365 users in your organization based on Microsoft’s research on Copilot users. The list displayed on this page does not include all Microsoft 365 apps with Copilot capabilities; more will be added over time. Metric definitions are provided in the table.
| Metric | Definition |
|---|---|
| Count of Teams meeting users | Count of unique active users of Microsoft Teams meetings over the past 28 days. |
| Count of Teams chat users | Count of unique active users of Microsoft Teams chats over the past 28 days. |
| Count of Outlook email users | Count of unique active users of Outlook email capabilities over the past 28 days. |
| Count of Office app users | Count of unique active users of Word, Excel, PowerPoint, and OneNote over the past 28 days. |
Microsoft 365 admins can use the Copilot Readiness report in the Microsoft 365 Admin Center to create a licensing plan for users based on Microsoft 365 app usage and other readiness info.
Adoption
After you deploy Copilot in your organization, this page allows you to track user adoption trends per Microsoft 365 app and Copilot feature. Information is consistent with data points displayed in the Microsoft 365 admin center including the Copilot Usage report and Microsoft Adoption Score.
All metrics on this page represent aggregations over the past 28 days with a typical delay of 2-3 days. (For example, if you're viewing the report on a Monday, the data shown would represent the 28-day period ending on the most recent Friday or Saturday).
| Metric | Definition |
|---|---|
| User count per application | Count of active Copilot users per Microsoft 365 application over the past 28 days. An active user is someone who completed any intentional action in Copilot (for example, sending a prompt or generating a Word document) at least once during that timeframe. The applications included here are currently limited to Teams, Outlook, Word, Excel, PowerPoint, and OneNote. Microsoft Copilot is not yet included in the report. |
| User count per feature | Count of unique active users per Copilot feature. These counts are currently limited to activities in Teams, Word, PowerPoint, and Outlook. More features will be added over time. Feature definitions: • Summarize a Teams meeting: user used Copilot to summarize a Teams meeting. Learn more about this feature. • Summarize a Teams conversation: user used Copilot to summarize a Microsoft Teams chat or channel conversation. Learn more about this feature. • Summarize an Outlook email thread: user used Copilot to summarize an Outlook email thread. Learn more about this feature. • Summarize a Word document: user used Copilot to summarize a Word document. Learn more about this feature. • Draft a Word document: user used Copilot to create a new Word document. Learn more about this feature. • Create a PowerPoint presentation: user used Copilot to create a new PowerPoint presentation. Learn more about this feature. • Generate an Outlook email draft: user used Copilot to generate an email draft in Outlook. Learn more about this feature. • Rewrite a Word document: user used Copilot to rewrite text in a Word document. Learn more about this feature. |
| Actions per user per feature | Average number of actions completed per active user over the past 28 days for each of the features above. This metric only counts the initial step of prompting Copilot to complete some action; it does not include any post-prompt actions such as copying a meeting summary or inserting drafted email text into an email body. This metric helps you assess the intensity of use of each Copilot feature and the degree to which users have come to rely on Copilot for key productivity workflows. For example, if you have 100 users for the “Summarize a Teams meeting” feature and an actions per user value of 10, that means that on average each of those 100 users prompted Copilot in Teams meetings 10 times over the past 28 days (amounting to 1,000 prompts overall). |
Impact
Located within the Impact page, the Sentiment section provides information that helps you assess Copilot impact from the perspective of users' subjective experiences. In the main table on this page, you’ll see a list of Microsoft’s recommended Copilot survey questions along with the results from your own organization’s latest survey (if an admin chooses to upload results for visualization here) and Microsoft’s own benchmark results from a study of early Copilot users.
Suggested Copilot survey questions
To measure Copilot user sentiment in your organization, we recommend delivering a survey to users in which you ask them to indicate the extent to which they agree with the following four statements:
- Using Copilot helps improve the quality of my work or output
- Using Copilot helps me spend less mental effort on mundane or repetitive tasks
- Using Copilot allows me to complete tasks faster
- When using Copilot I am more productive
For each of these, we recommend allowing users to indicate whether or not they Strongly Disagree, Disagree, Neither Agree Nor Disagree, Agree, or Strongly Agree with the statement. You can then combine the “Agree” and “Strongly Agree” responses to compute the % of users who agreed with each statement and compare results with the Microsoft benchmarks shown in this tab.
Your user survey does not need to be limited to these four statements, but we recommend including them at a minimum for easy comparison with Microsoft’s benchmark results.
Upload survey results through the Microsoft 365 admin center
Microsoft 365 admins can upload survey results through Adoption Score in the Microsoft 365 admin center. The results then appear in the Microsoft Copilot Dashboard. Learn how to upload survey data.
News & research
Under the Learning tab, here you find research around the impacts of AI on workplace productivity. Use this page to stay up to speed on the latest findings from Microsoft’s own AI research teams.
FAQs
Do I need a paid Viva Insights subscription in order to access the report's aggregated, tenant-level insights?
No, a Viva Insights subscription is not required. The report's aggregated, tenant-level insights are available to any customer with a Microsoft 365 or Office 365 subscription for business or enterprise. However, the dashboard includes other advanced features for customers who do have a Viva Insights subscription.
Does the report use Viva Insights data to create any of the metrics?
No, the report does not use any Viva Insights data in the process of computing the metrics shown. The report is based on your Microsoft 365 tenant’s usage and licensing data and is made available to you as part of your Microsoft 365 or Office 365 subscription.
In the Sentiment section I only see metrics related to changes in employee behavior after using Copilot, but no survey responses. Why?
Your Microsoft 365 admin has not uploaded any survey data for your organization. Use the steps above to upload it.
What is the time frame for the data in the Microsoft Copilot Dashboard?
The dashboard displays data for a rolling 28-day period.
I’m receiving an error at the time of connecting my data with the dashboard in Power BI. What should I do?
First, check in the Microsoft 365 admin center that you have one of these roles:
- Global Administrator
- Exchange Administrator
- SharePoint Administrator
- Teams Communications Administrator
- Teams Administrator
- Usage Summary Reports Reader
- Office Apps Administrator
- Global Reader
- Report Reader
If you don’t, request this access from your administrator. Then, ensure you’re using the correct Microsoft 365 tenant ID.
I’m having issues with the dataset refresh/app update during the update process in Power BI. What should I do?
Use these steps to refresh the dataset and make sure your dataset configurations are set correctly:
Go to the workspace panel and open the app workspace.
In the dataset settings, select Scheduled Refresh.
Open the Parameters section and configure the data source again in the Data Source section with the credentials for your Tenant ID with valid permissions.
Once you complete the above steps, go back to the app workspace and select Refresh.
Once the dataset has refreshed successfully, select Update App at the top-right of the app workspace.
Feedback
Coming soon: Throughout 2024 we will be phasing out GitHub Issues as the feedback mechanism for content and replacing it with a new feedback system. For more information see: https://aka.ms/ContentUserFeedback.
Submit and view feedback for