WinDbg - File Menu
![]()
This topic describes how to how to use the file menu.
Start debugging
When you first open the file menu, you'll see Start debugging and your recent debugger targets. Use Start debugging to configure new and open previous debugger sessions.
Recent
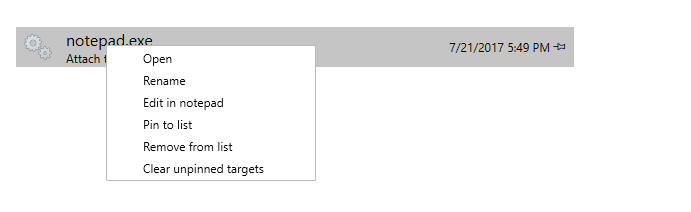
The recent list contains a list of your recent workspaces and debugger connections. For more information on working settings an workspaces see WinDbg Setup – Settings and workspaces.
You can use the right click menu to manage your workspaces, like pinning, renaming and moving them. As well as editing them in notepad.
Start a new session
Use the other tabs in the Start debugging section to start a new debugger session, like attaching or launching a process. For more information on starting a new session see WinDbg - Start a user-mode session and WinDbg - Start a kernel mode session
Save workspace
Use Save workspace to save the current workspace.
Session connection information is stored in workspace configuration files. Workspace files are stored with a .debugTarget file extension.
The default location for workspace files is:
C:\Users\*UserName*\AppData\Local\DBG\targets
Open source file
Use Open source file to open a source file. Do this when you want to work with additional source files that have not been loaded because of code execution. For more information on working with source files, see Source Code Debugging in WinDbg (Classic)
Open script
Use Open script to open an existing Javascript or NatVis script. For more information on working with scripts see WinDbg - Scripting Menu.
Settings
Use the settings menu to set the source and symbol path as well as choose the light and dark theme for the debugger. For more information on settings see WinDbg Setup – settings and workspaces.
About
Use About to display build version information for the debugger. You can use also use this screen to view the Microsoft privacy statement.
Exit
Use Exit to exit the debugger.
See Also
Feedback
Coming soon: Throughout 2024 we will be phasing out GitHub Issues as the feedback mechanism for content and replacing it with a new feedback system. For more information see: https://aka.ms/ContentUserFeedback.
Submit and view feedback for