Pktmon command formatting
Applies to: Windows Server 2022, Windows Server 2019, Windows 10, Azure Stack Hub, Azure, Azure Stack HCI, versions 21H2 and 20H2
Packet Monitor (Pktmon) is an in-box, cross-component network diagnostics tool for Windows. It can be used for packet capture, packet drop detection, packet filtering and counting. The tool is especially helpful in virtualization scenarios, like container networking and SDN, because it provides visibility within the networking stack. Packet Monitor is available in-box via pktmon.exe command on Windows 10 and Windows Server 2019 (Version 1809 and later). You can use this topic to learn how to understand pktmon syntax, command formatting, and output. For a complete list of commands, see pktmon syntax.
Quick start
Use the following steps to get started in generic scenarios:
Identify the type of packets needed for the capture, such as specific IP addresses, ports, or protocols associated with the packet.
Check the syntax to apply capture filters, and apply the filters for the packets identified in the previous step.
C:\Test> pktmon filter add help
C:\Test> pktmon filter add <filters>
Start the capture and enable packet logging.
C:\Test> pktmon start -cReproduce the issue being diagnosed. Query counters to confirm the presence of expected traffic, and to get a high-level view of how the traffic flowed in the machine.
C:\Test> pktmon countersStop the capture and retrieve the logs in txt format for analysis.
C:\Test> pktmon stop
C:\Test> pktmon etl2txt <etl file>
See Analyze Packet Monitor output for instructions on analyzing txt output.
Capture filters
It's highly recommended to apply filters before starting any packet capture, because troubleshooting connectivity to a particular destination is easier when you focus on a single stream of packets. Capturing all the networking traffic can make the output too noisy to analyze. For a packet to be reported, it must match all conditions specified in at least one filter. Up to 32 filters are supported at once.
For example, the following set of filters will capture any ICMP traffic from or to the IP address 10.0.0.10 as well as any traffic on port 53.
C:\Test> pktmon filter add -i 10.0.0.10 -t icmp
C:\Test> pktmon filter add -p 53
Filtering capability
Packet Monitor supports filtering by MAC addresses, IP addresses, ports, EtherType, transport protocol, and VLAN ID.
Packet Monitor will not distinguish between source or destination when it comes to MAC address, IP address, or port filters.
To further filter TCP packets, an optional list of TCP flags to match can be provided. Supported flags are FIN, SYN, RST, PSH, ACK, URG, ECE, and CWR.
- For example, the following filter will capture all the SYN packets sent or received by the IP address 10.0.0.10:
C:\Test> pktmon filter add -i 10.0.0.10 -t tcp syn
- Packet Monitor can apply a filter to encapsulated inner packets, in addition to the outer packet if the [-e] flag was added to any filter. Supported encapsulation methods are VXLAN, GRE, NVGRE, and IP-in-IP. Custom VXLAN port is optional, and defaults to 4789.
For more information, see pktmon filter syntax.
Packets and general events capture
Packet Monitor can capture packets through the [-c] parameter with the start command. This will enable packet capture and logging as well as packet counters. To enable packet counters only without logging the packet, add the [-o] parameter to the start command. For more information about packet counters, see the Packet counters section below.
You can select components to monitor through the [--comp] parameter. It can be NICs only or a list of component IDs, and it defaults to all components. You can also filter by packet propagation status (dropped or flowing packets) by using the [--type] parameter.
Along with capturing packets, Packet Monitor allows the capture of general events such as ETW and WPP events by declaring the [-t] parameter and specifying the providers through the [-p] parameter. Use "pktmon stop" to stop all data collection.
For example, the following command will capture packets of only the network adapters:
C:\Test> pktmon start -c --comp nics
The following command will capture only the dropped packets that pass through components 4 and 5, and log them:
C:\Test> pktmon start -c --comp 4,5 --type drop
This command will capture packets and log events from the provider "Microsoft-Windows-TCPIP":
C:\Test> pktmon start --capture --trace -p Microsoft-Windows-TCPIP
Packet logging capability
Packet Monitor supports multiple logging modes:
- Circular: New packets overwrite the oldest ones when the maximum file size is reached. This is the default logging mode.
- Multi-file: A new log file is created when the maximum file size is reached. Log files are sequentially numbered: PktMon1.etl, PktMon2.etl, etc. Apply this logging mode to keep all the log, but be wary of storage utilization. Note: use the file creation timestamp of each log file as an indication to a specific time frame in the capture.
- Real-time: Packets are displayed on screen at real time. No log file is created. Use Ctrl+C to stop monitoring.
- Memory: Events are written to a circular memory buffer. Buffer size is specified through the [-s] parameter. Buffer contents are written to a log file after stopping the capture. Use this logging mode for very noisy scenarios to capture a huge amount of traffic in very short amount of time in the memory buffer. Using any other logging modes, some traffic might get lost.
Specify how much of the packet to log through the [-p] parameter. Log the whole packet of every packet no matter its size by setting that parameter to 0. The default is 128 bytes which should include the headers of most packets.
Specify the size of the log file through the [-s] parameter. This will be the maximum size of the file in a circular logging mode before Packet Monitor starts overwriting the older packets with the newer ones. This will also be the maximum size of each file in the multi-file logging mode before Packet Monitor creates a new file to log the next packets. You can also use this parameter to set the buffer size for the memory logging mode.
For more information, see pktmon start syntax.
Packet analysis and formatting
Packet Monitor generates log files in ETL format. There are multiple ways to format the ETL file for analysis:
- Convert the log to text format (the default option), and analyze it with text editor tool like TextAnalysisTool.NET. Packet data will be displayed in TCPDump format. Follow the guide below to learn how to analyze the output in the text file.
- Convert the log to pcapng format to analyze it using Wireshark*
- Open the ETL file with Network Monitor*
Note
*Use the hyperlinks above to learn how to parse and analyze Packet Monitor logs in Wireshark and Network Monitor.
For more information, see pktmon format syntax.
Analyze Packet Monitor output
Packet Monitor captures a snapshot of the packet by each component of the networking stack. Accordingly, there will be multiple snapshots of each packet (represented in the image below by the lines the blue box). Each of these packet snapshots is represented by a couple of lines (red and green boxes). There is at least one line that includes some data about the packet instance starting with the timestamp. Right after, there is at least one line (bolded in the image below) to show the parsed raw packet in text format (without a timestamp); it could be multiple lines if the packet is encapsulated, like the packet in the green box.
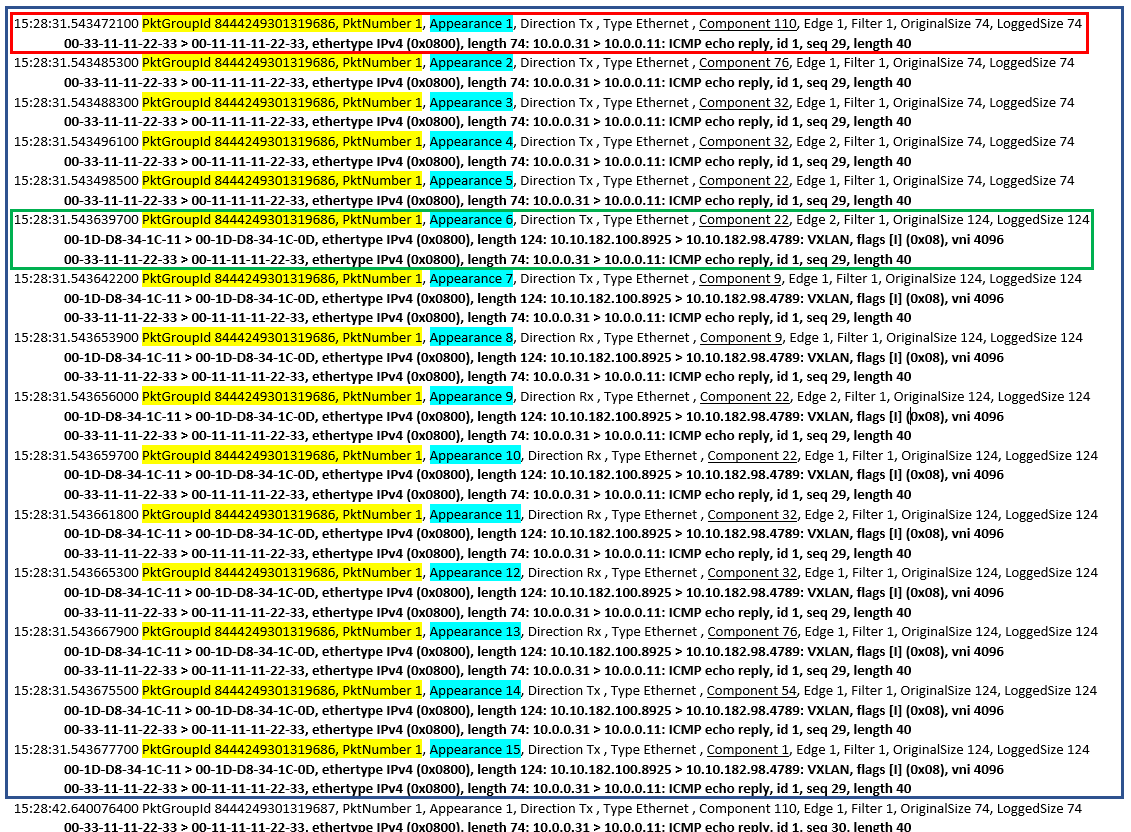
For correlating all snapshots of the same packets, monitor the PktGroupId and PktNumber values (highlighted in yellow); all snapshots of the same packet should have these 2 values in common. The Appearance value (highlighted in blue) acts as a counter for each subsequent snapshot of the same packet. For example, the first snapshot of the packet (where the packet first appeared in the networking stack) has the value 1 for appearance, the next snapshot has the value 2, and so on.
Each packet snapshot has a component ID (underlined in the image above) denoting the component associated with the snapshot. To resolve the component name, and parameters, search for this component ID in the components list at the bottom of the log file. A portion of the components table is shown in the image below highlighting "Component 1" in yellow (this was the component where the last snapshot above was captured). Components with 2 edges will report 2 snapshots at each edge (like the snapshots with the Appearance 3 and Appearance 4 for example in the image above).
At the bottom of each log file, the filters list is presented as shown in the image below (highlighted in blue). Each filter displays the parameter(s) specified (Protocol ICMP in the example below), and zeros for the rest of the parameters.

For dropped packets, the word "drop" appears before any of the lines representing the snapshot where the packet got dropped. Each dropped packet also provides a dropReason value. This dropReason parameter provides a short description of the packet drop reason; for example, MTU Mismatch, Filtered VLAN, etc.

Packet counters
Packet Monitor counters provide a high level view of the networking traffic throughout the networking stack without the need to analyze a log, which can be an expensive process. Examine traffic patterns by querying packet counters with pktmon counters after starting the Packet Monitor capture. Reset counters to zero using pktmon reset or stop monitoring all together using pktmon stop.
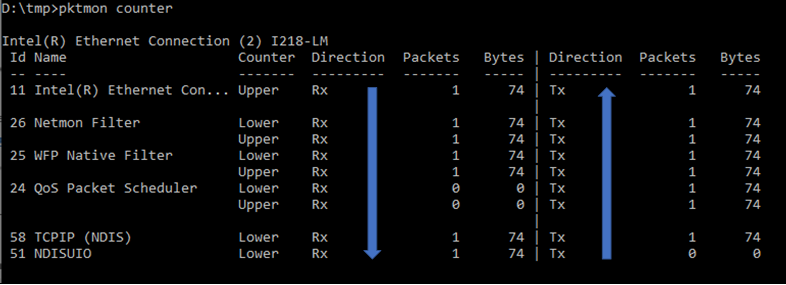
- Counters are arranged by binding stacks with network adapters on the top and protocols on the bottom.
- Tx/Rx: Counters are separated into two columns for Send (Tx) and Receive (Rx) directions.
- Edges: Components report packet propagation when a packet is crossing component boundary (edge). Each component may have one or more edges. Miniport drivers typically have single upper edge, protocols have single lower edge, and filter drivers have upper and lower edges.
- Drops: packet drop counters are being reported in the same table.
In the following example, a new capture was started, then pktmon counters command was used to query the counters before the capture was stopped. The counters show a single packet making it out of the networking stack, starting from the protocol layer all the way to the physical network adapter, and its response coming back in the other direction. If the ping or the response was missing, it's easy to detect this through the counters.
In the next example, drops are reported under the "Counter" column. Retrieve the Last Drop Reason for each component by requesting counters data in JSON format using pktmon counters --json or analyze the output log to get more detailed information.

As shown through these examples, the counters could provide a lot of information through a diagram that can be analyzed by just a quick look.
For more information, see pktmon counters syntax.
Networking stack layout
Examine the networking stack layout through the command pktmon list.

The command shows networking components (drivers) arranged by adapters bindings.
A typical binding consists of:
- A single network interface card (NIC)
- A few (possibly zero) filter drivers
- One or more protocol drivers (TCP/IP or others)
Each component is uniquely identified by a Packet Monitor component ID, which are used for targeting individual components for monitoring.
Note
IDs are not persistent and may change across reboots and as Packet Monitor's driver restarts.
Some IDs that appear in Packet Monitor's output may not appear in the component list. This is due to aggregation of some components into a single ID to make selecting and displaying them easier. To find the original IDs for these components, use pktmon list --json and look for the SecondaryId property in the output.
For more information, see pktmon list syntax.
Feedback
Coming soon: Throughout 2024 we will be phasing out GitHub Issues as the feedback mechanism for content and replacing it with a new feedback system. For more information see: https://aka.ms/ContentUserFeedback.
Submit and view feedback for