View snapshots
View a snapshot to see and understand the forecast data at the moment in time when the snapshot was taken, including underlying opportunities. Also, you can compare the data between your current forecast and the snapshot to understand how the forecast is doing.
License and role requirements
| Requirement type | You must have |
|---|---|
| License | Dynamics 365 Sales Premium More information: Dynamics 365 Sales pricing |
| Security roles | Any primary sales role, such as salesperson or sales manager More information: Primary sales roles |
Prerequisites
Your administrator must have enabled snapshots
Open and view snapshots
Sign in to the Sales Hub app, and go to Performance > Forecasts.
Select the forecast for which you want to view snapshots.
Select See forecast grid history.
Note
The See forecast grid history option is inactive if there no snapshots available for the forecast. Daily snapshots are available for weekly, monthly, and quarterly forecast periods, and weekly snapshots are available for annual periods.

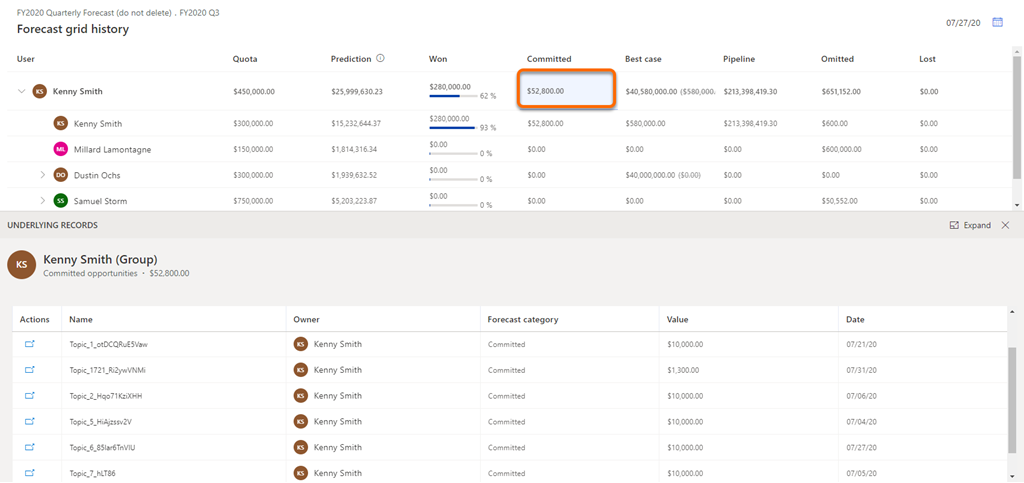
The latest snapshot for the forecast is displayed with information about forecast data at that point in time, along with name and date.
Note
The values displayed in the snapshot are based on the fields configured in your forecast. If these values don't match the values you expected, verify the fields used for aggregation.

The format of the snapshot date is based on your personal settings. In this example, the date format is MM/DD/YY (07/27/20).
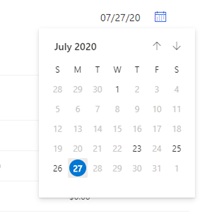
Select the calendar icon to know the dates for which snapshots are available. To view the snapshot from a specific date, select the date from the calendar.
Note
If a date is inactive, there's no snapshot available for that date.

The data displayed in the snapshot is view-only and can't be modified.
View underlying opportunities
For a snapshot, you can view the underlying opportunities of a column or the users who are influencing the displayed budget amount at that point in time. By viewing the opportunities, you can analyze and understand how they're trending.
Open a snapshot.
To see the underlying opportunities that are defining the value of a column at that point in time, select the column or user. In this example, Kenny Smith's Committed column is selected and the underlying opportunities that are contributing the value are displayed.

To view the details of an underlying opportunity, under Actions column, select the navigate icon corresponding to the opportunity.
The opportunity opens in a pop-up window. The latest information will be displayed in the opportunity, not the information as of the date of the snapshot.
Can't find the options in your app?
There are three possibilities:
- You don't have the necessary license or role.
- Your administrator hasn't turned on the feature.
- Your organization is using a custom app. Check with your administrator for exact steps. The steps described in this article are specific to the out-of-the-box Sales Hub and Sales Professional apps.
See also
About premium forecasting
Take snapshots automatically
Analyze deals flow between snapshots
Feedback
Coming soon: Throughout 2024 we will be phasing out GitHub Issues as the feedback mechanism for content and replacing it with a new feedback system. For more information see: https://aka.ms/ContentUserFeedback.
Submit and view feedback for