Remote GPU Debugging in Visual Studio 11
Hi my name is Paul Maybee and I am the architect on the Parallel and GPU debugger team, working closely with the C++ AMP team.
We covered previously how to debug C++ AMP code locally, so please read our post on “Start GPU Debugging in Visual Studio 11”. I’ll pick up from step 6 for those of you not wanting to run Windows 8 Consumer Preview on your main development machine.
This post contains the steps necessary to debug a C++ AMP program on a remote host running Windows 8 from a local machine on which you have installed Visual Studio 2012 RC.
For the purpose of these instructions I will make the following assumptions:
- The remote machine is named WIN8REMOTE.
- The local machine is running a 64 bit operating system.
- The location \\WIN8REMOTE\C$\temp is writable from the local machine.
- Visual Studio is installed at “c:\Program Files (x86)\Microsoft Visual Studio 11.0”
- The application to be debugged is HelloWorld_AMP.exe found in “%USERPROFILE%\documents\visual studio 11\projects\HelloWorld_AMP\Debug”, built for Win32.
If these assumptions don’t exactly match your setup then make corresponding changes to the instructions below.
Step 1: One time setup of WIN8REMOTE for remote debugging
- Install the Windows SDK on WIN8REMOTE.
- Copy the contents of “c:\Program Files (x86)\Microsoft Visual Studio 11.0\Common7\IDE\Remote Debugger\x86\” to \\WIN8REMOTE\c$\temp\debugger.
- Log on to WIN8REMOTE and run c:\temp\debugger\msvsmon.exe. When the firewall dialog box comes up allow it to “Configure remote debugging”.
Step 2: Configure your project properties for remote debugging
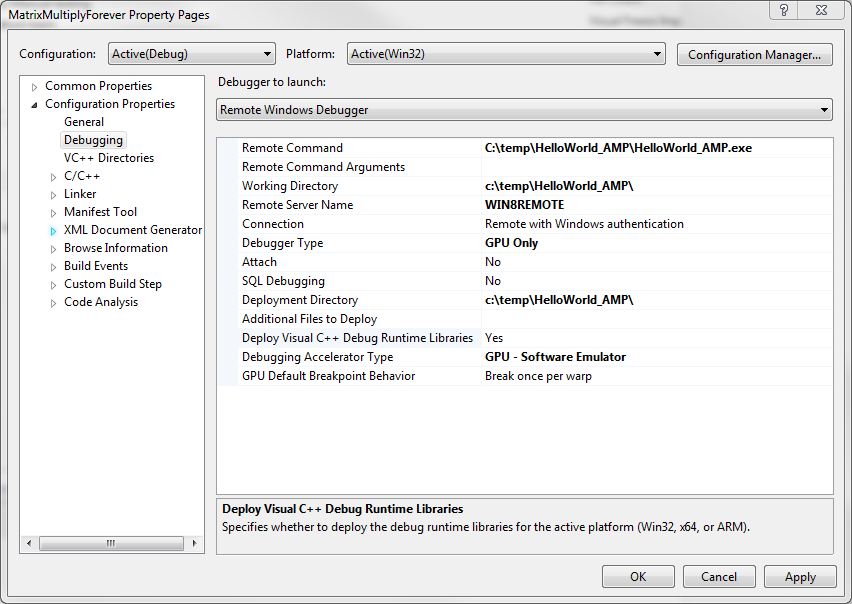
- Select Project->Properties to open the properties dialog and then Configuration Properties ->Debugging as per screenshot that follows
- Set “Debugger to launch” to “Remote Windows Debugger”
- Set “Remote Command” to “c:\temp\HelloWorld_AMP\HelloWorld_AMP.exe”
- Set “Working Directory” to “c:\temp\HelloWorld_AMP\”
- Set “Deployment Directory” to “c:\temp\HelloWorld_AMP\”
- Set “Remote Server Name” to “WIN8REMOTE”
- Set “Debugger Type” to “GPU Only”
Step 3: Start debugging
- Set a breakpoint on line 11 (“av[idx] += 1;”).
- Press F5 and enjoy
That’s all! If you have any questions, please feel free to ask in the comments section below.