Troubleshooting with Logging and Diagnostics
The various FSLogix components create comprehensive logs. These logs are found in the following three (3) log types:
- Client event logs
- Text-based Log files
- Event Trace Logging (ETL)
Reviewing or collecting logs can be a great first step in the support process before opening a support case. The FSLogix Support Tool was created to help customers collect all the necessary logs into a single zipped archive.
Client event logs
FSLogix utilizes the Windows Event Log system to provide other data during many of the operations and tasks. These event logs can be found in the Windows Event Viewer under Applications and Services Logs -> FSLogix. Most event logs data is written in either the Admin or Operational logs under Apps. Event log data specific to Cloud Cache is written to either the Admin or Operational logs under CloudCache.

Figure 7: FSLogix Event Logs
Text-based log files
Text-based log files are the first place to look when troubleshooting FSLogix and requires the logging settings have been configured.
Log file location: C:\ProgramData\FSLogix\Logs
The most common log file used when troubleshooting an issue is the Profile_%date%.log found in C:\ProgramData\FSLogix\Logs\Profile.
How to review profile logs
Note
Notepad++ is a great text editor as it provides the ability to highlight sets of keywords or phrases.
Open the latest log file from
C:\ProgramData\FSLogix\Logs\Profile\Profile_%date%.log.Take note of the following sections: Computer Name, FSLogix version(s), and service status.
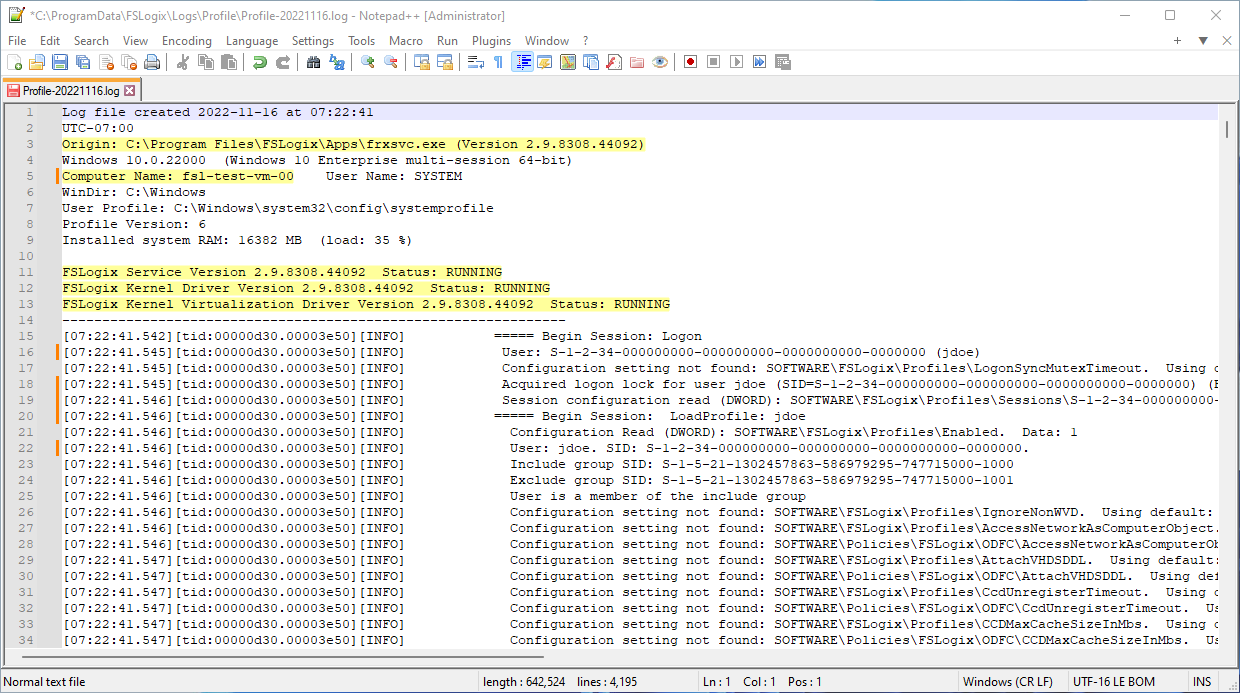
Figure 1: Profile log file
Press
Ctrl+Fto open the Find dialog and search for the sign in event for a specific user (for example, jdoe).- Find what:
LoadProfile: %samaccountname%
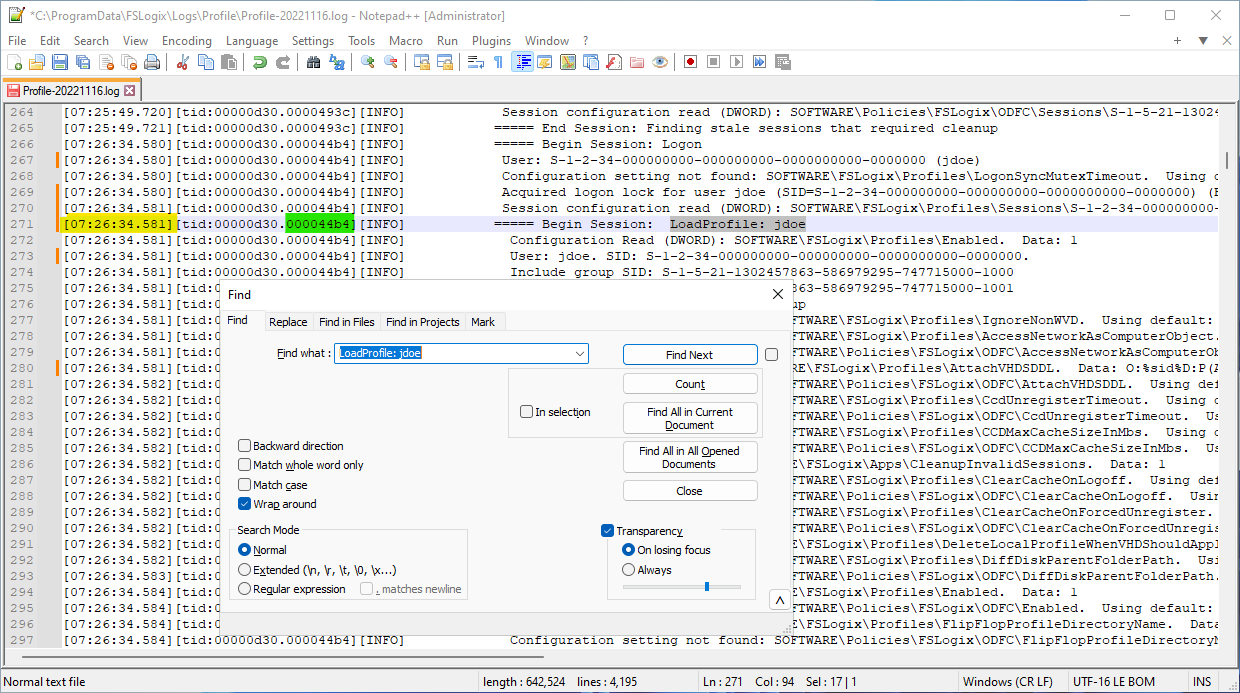
Figure 2: Profile log search dialog
- Find what:
Ensure the sign in event is in line with the time of the reported issue or problem.
Next, note the process id for this user as this ID is used during the entire sequence of the event (sign in or sign out).
Use the style feature to highlight the following sections within the log file:
Begin Session: LogonBegin Session: LogoffMillisecondsloadProfile time:unloadProfile time:

Figure 3: Profile log stylize terms
With these keywords stylized, it's easier to locate the sign in and sign out events.
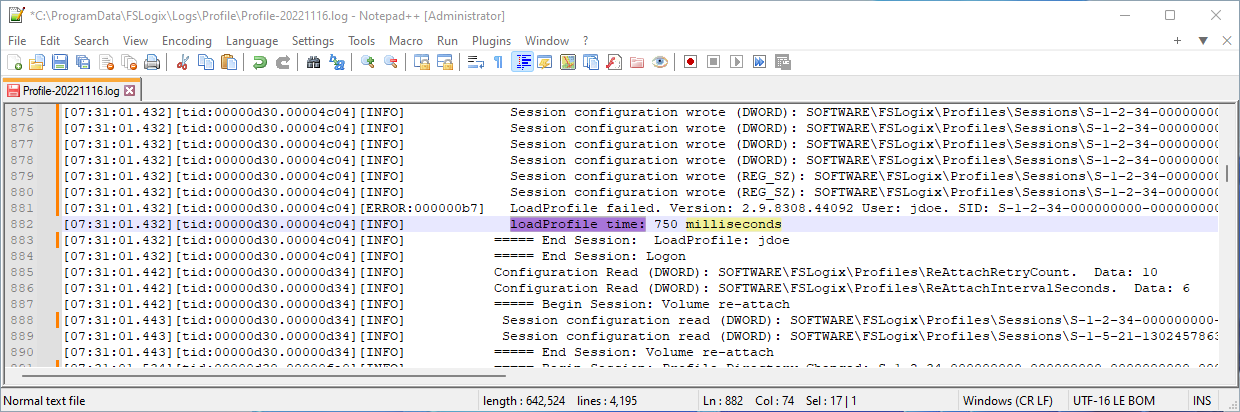
Figure 4: Example 1
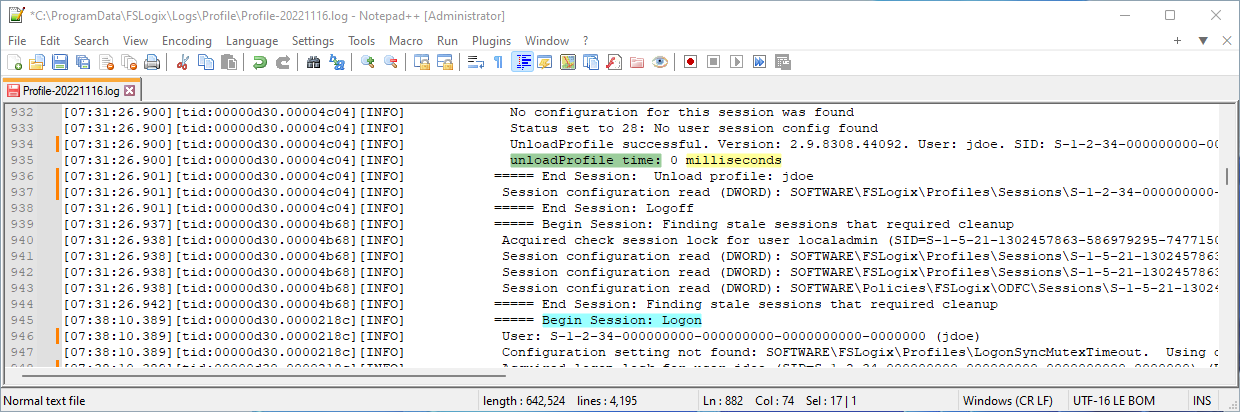
Figure 5: Example 2
Optionally, after you've stylized all the keywords, you can focus on a specific process for a user's event by selecting the process id. Notepad++ will highlight all occurrences of this process ID so you can follow its sequence as there may be other processes running for other users at the same time.
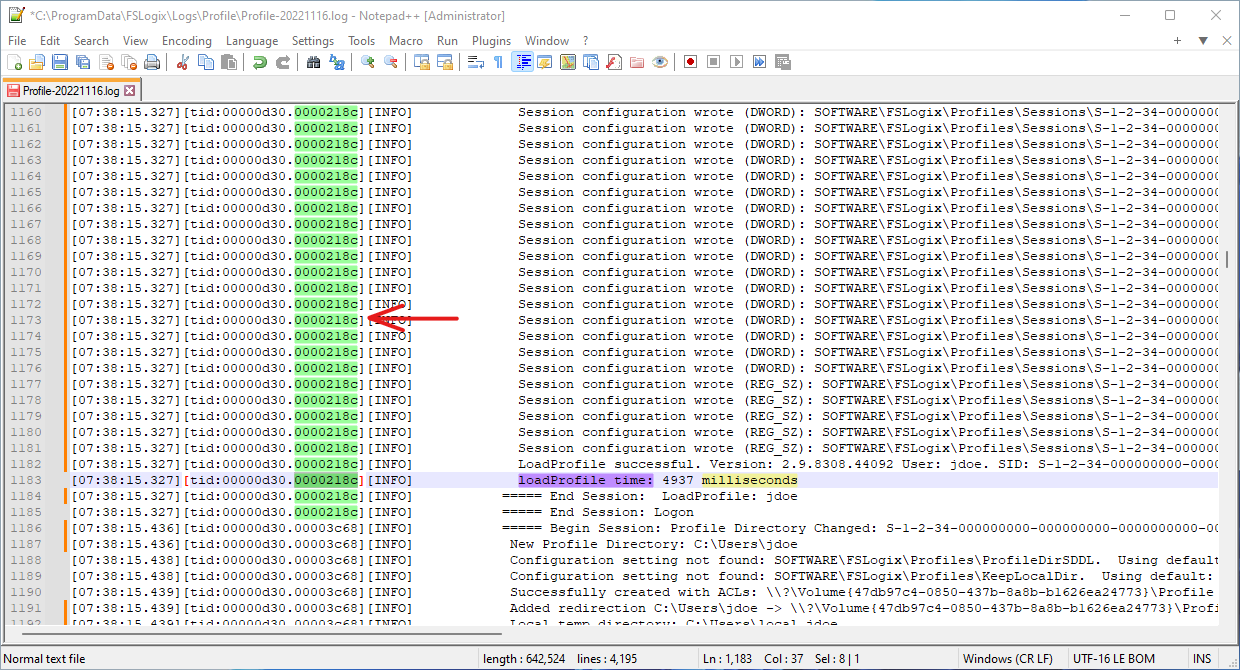
Figure 6: Profile log process ID
Important
Each action in the log file will have a prefix for the type of event. [INFO] for informational events, [WARN:xxxxxx] indicates Warnings, and [ERROR:xxxxxx] for Errors. Both Warnings and Error will have a corresponding error code.
Event Trace Logging (ETL)
FSLogix implements trace logging, which creates Event Trace Logs (ETL) files. There are two (2) ETL files, which are created and saved. The ETL files are saved to C:\ProgramData\FSLogix\Logs\, and are named trace.etl.001 and trace.etl.002. The files are rotated using round-robin, with the oldest file being replaced with a new file after two files have been created. The ETL files are capped at 100-MB maximum file size.
The FSLogix ETL files are managed by Windows autologger. Trace data is held in a buffer and written to the ETL files as needed and overwritten at the designated threshold. Each time the computer is restarted, the ETL files are rotated according to the configuration.
Note
Event Trace Logging is intended for Microsoft Internal Use only.
Feedback
Coming soon: Throughout 2024 we will be phasing out GitHub Issues as the feedback mechanism for content and replacing it with a new feedback system. For more information see: https://aka.ms/ContentUserFeedback.
Submit and view feedback for