Workbook visualizations
Workbooks provide a rich set of capabilities for visualizing Azure Monitor data. The exact set of capabilities depends on the data sources and result sets, but you can expect them to converge over time. These controls allow you to present your analysis in rich interactive reports.
Workbooks support these kinds of visual components:
- Text parameters
- Using queries:
Note
Each visualization and data source might have its own limits.
Examples
Text parameters
Charts

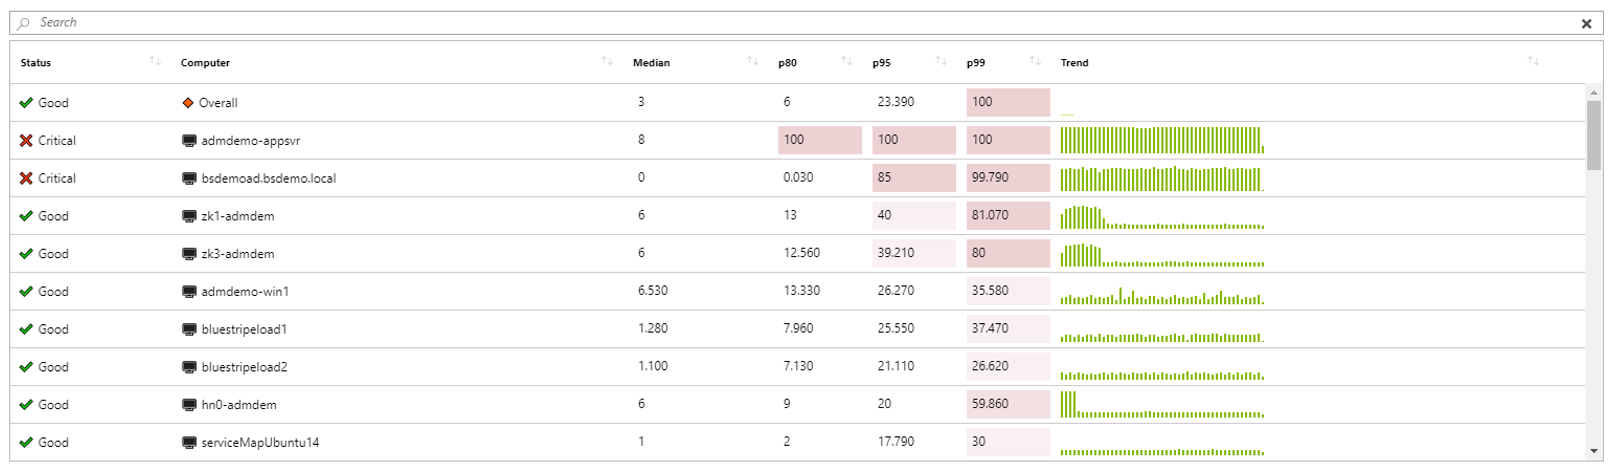
Grids
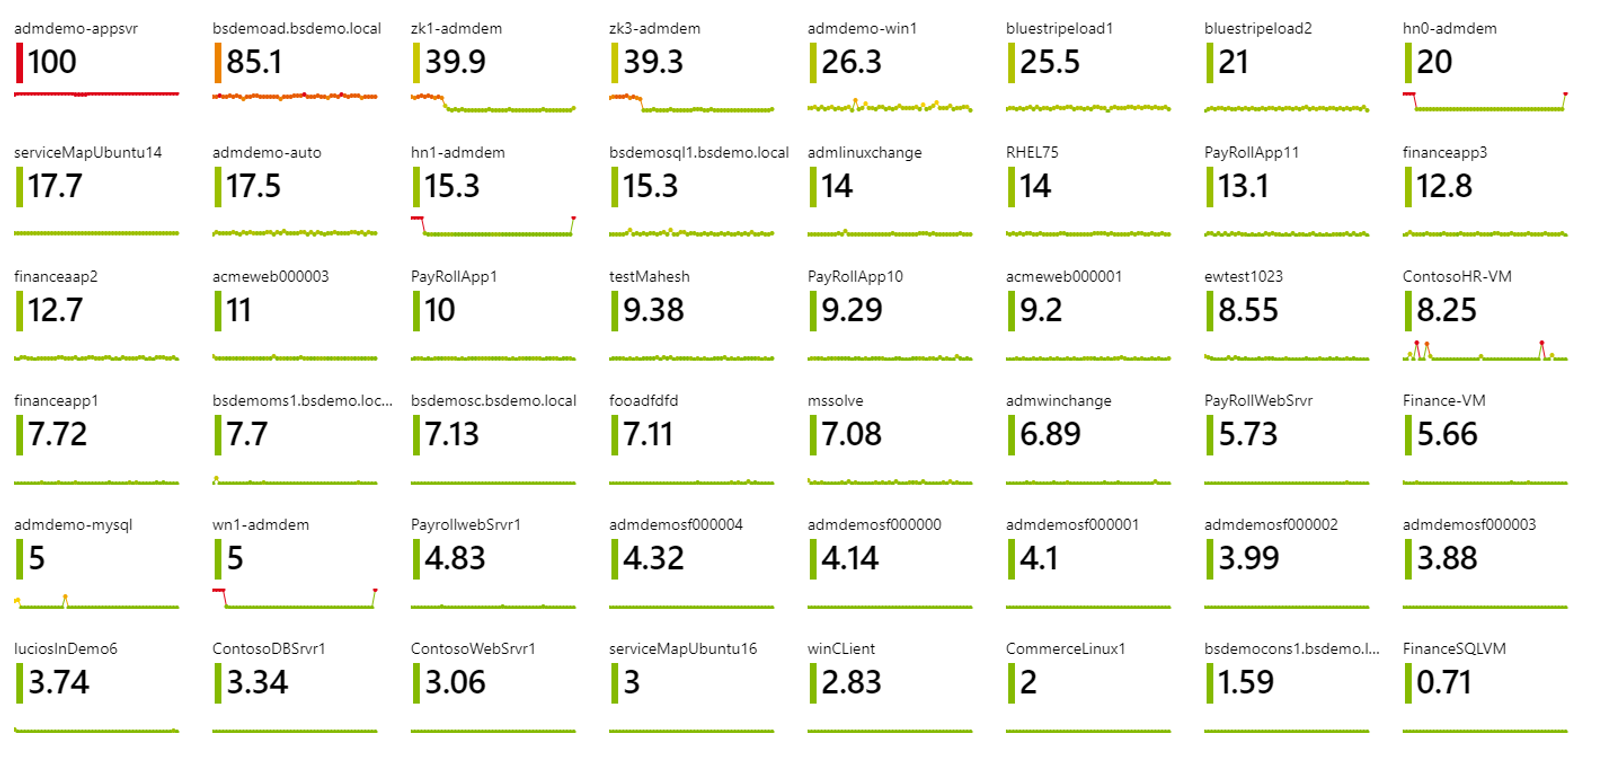
Tiles
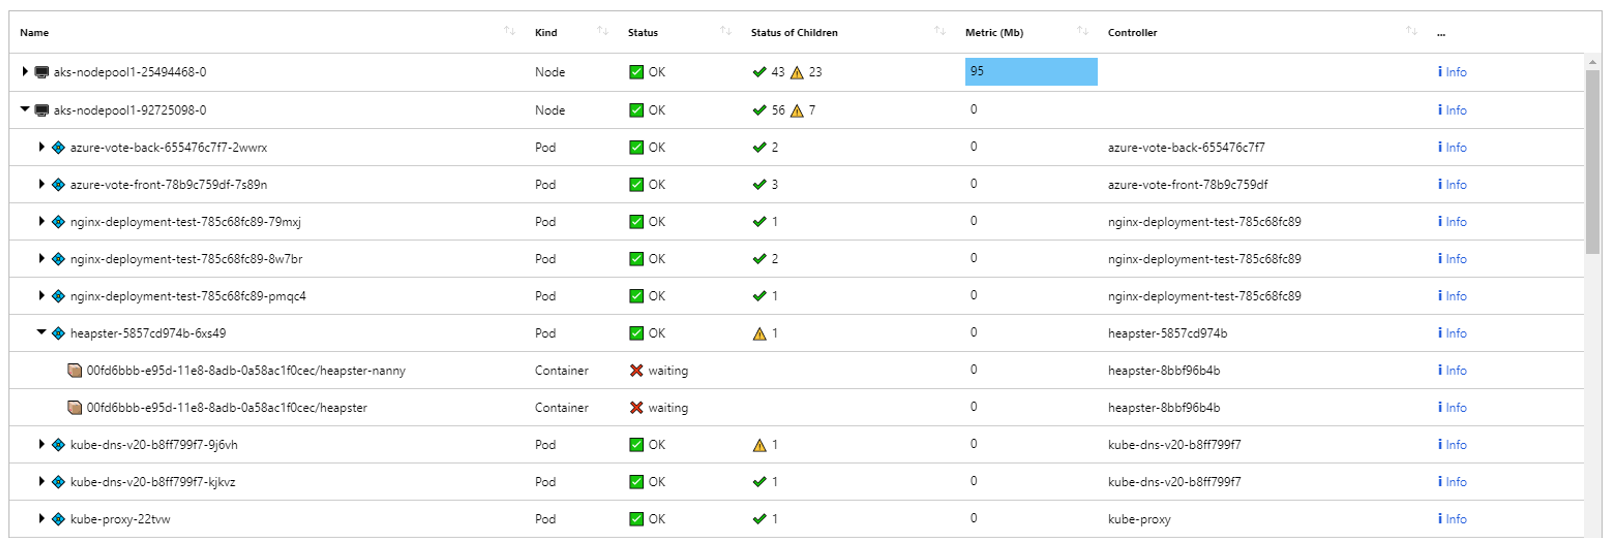
Trees
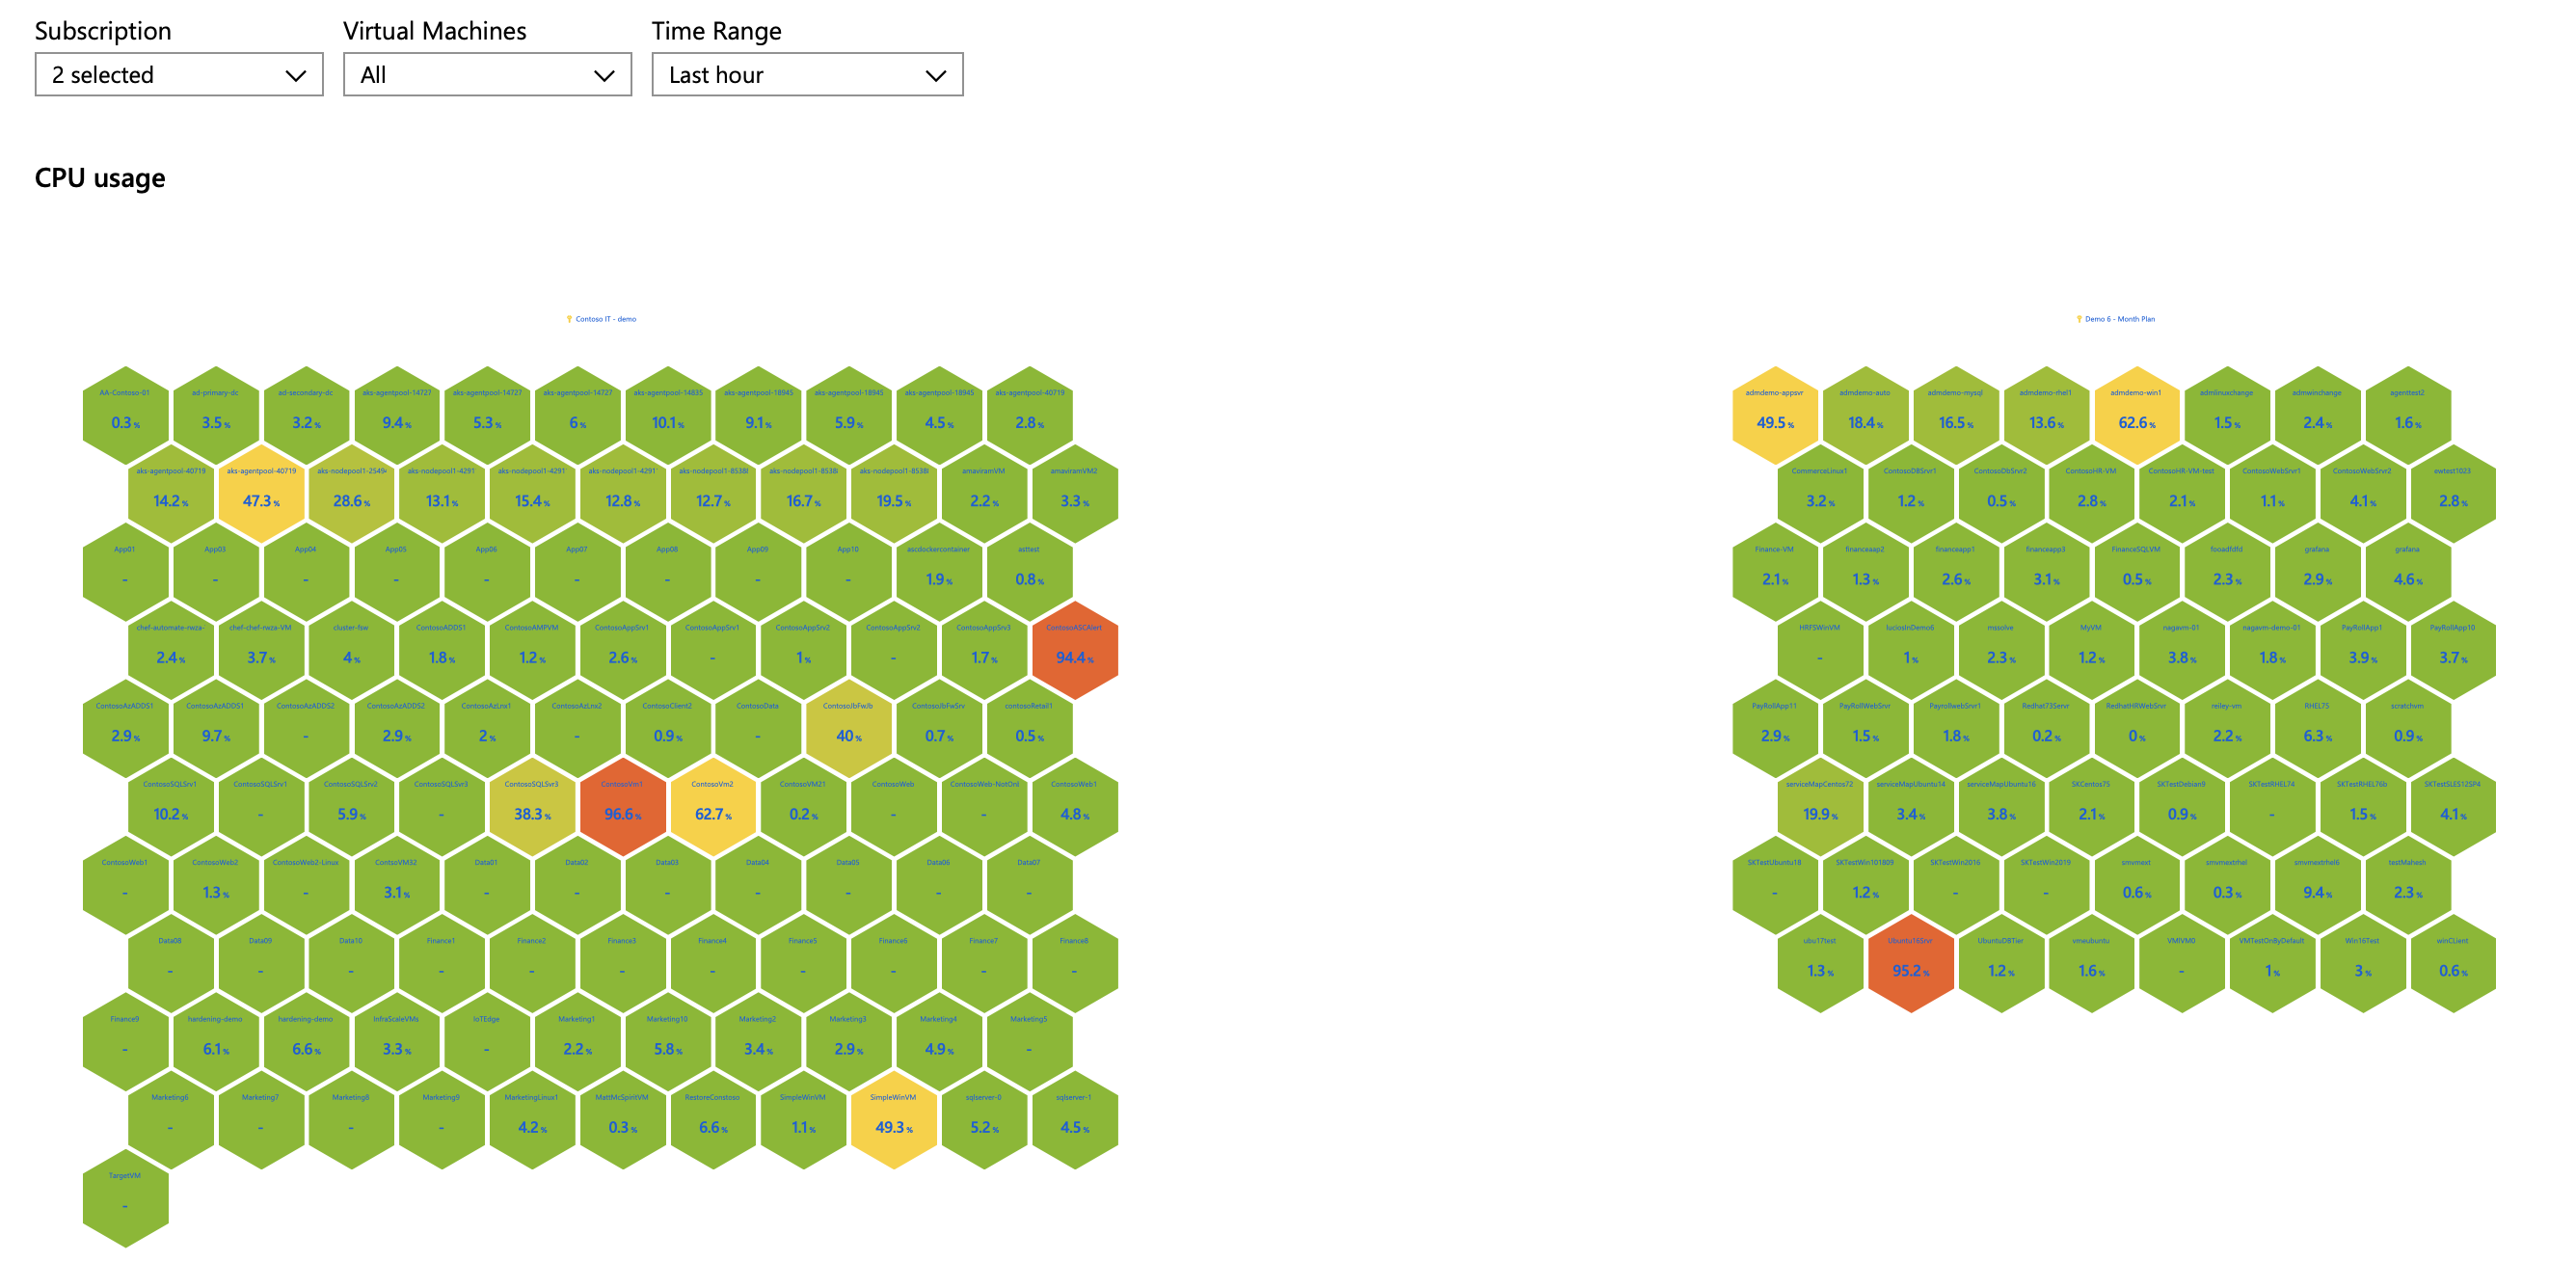
Honeycomb
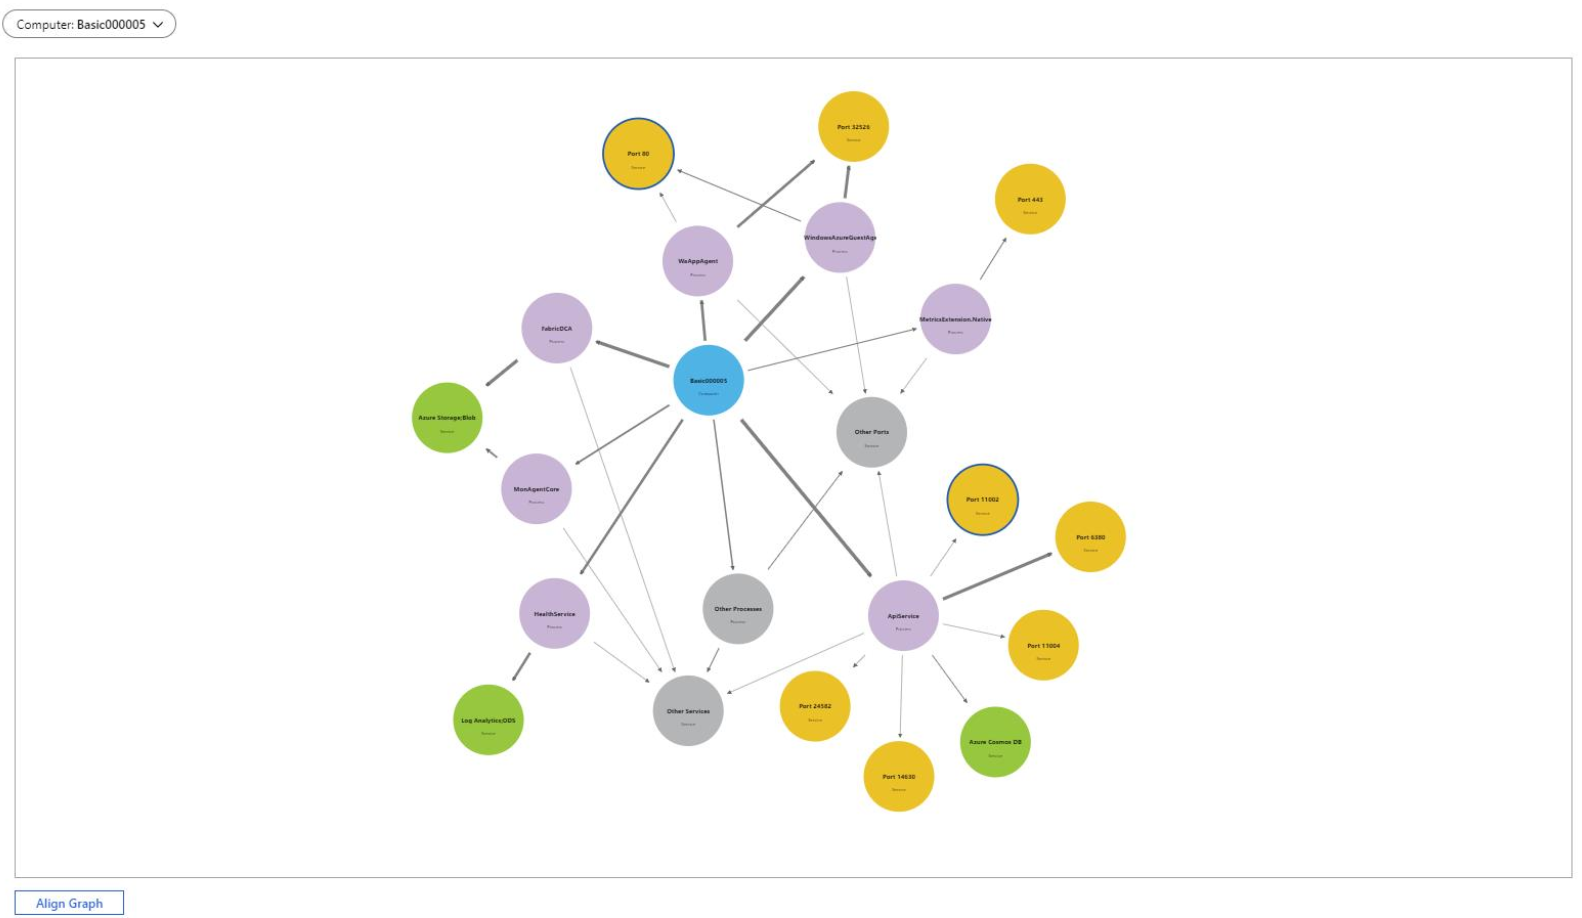
Graphs
Maps

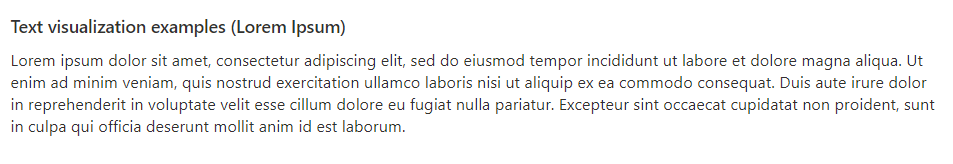
Text visualizations
Next steps
משוב
בקרוב: במהלך 2024, נפתור בעיות GitHub כמנגנון המשוב לתוכן ונחליף אותו במערכת משוב חדשה. לקבלת מידע נוסף, ראה: https://aka.ms/ContentUserFeedback.
שלח והצג משוב עבור