series_fit_poly_fl()
La funzione è una funzione series_fit_poly_fl()definita dall'utente che applica una regressione polinomiale in una serie. Questa funzione accetta una tabella contenente più serie (matrici numeriche dinamiche) e genera il polinomio di ordine elevato più adatto per ogni serie usando la regressione polinomiale. Questa funzione restituisce sia i coefficienti polinomiali che il polinomio interpolato nell'intervallo della serie.
Nota
- Usare la funzione nativa series_fit_poly() anziché la funzione descritta in questo documento. La funzione nativa offre la stessa funzionalità ed è migliore per prestazioni e scalabilità. Questo documento viene fornito solo a scopo di riferimento.
- Per la regressione lineare di una serie con spaziatura uniforme, come creato dall'operatore make-series, usare la funzione nativa series_fit_line().
Prerequisiti
- Il plug-in Python deve essere abilitato nel cluster. Questa operazione è necessaria per Python inline usato nella funzione .
- Il plug-in Python deve essere abilitato nel database. Questa operazione è necessaria per Python inline usato nella funzione .
Sintassi
T | invoke series_fit_poly_fl(, y_series, y_fit_series, fit_coeffGrado, [ x_series ], [ x_istime ])
Altre informazioni sulle convenzioni di sintassi.
Parametri
| Nome | Tipo | Obbligatoria | Descrizione |
|---|---|---|---|
| y_series | string |
✔️ | Nome della colonna della tabella di input contenente la variabile dipendente. Cioè, la serie da adattare. |
| y_fit_series | string |
✔️ | Nome della colonna in cui archiviare la serie più adatta. |
| fit_coeff | string |
✔️ | Nome della colonna in cui archiviare i coefficienti polinomiali più adatti. |
| Grado | int |
✔️ | Ordine richiesto del polinomio da adattare. Ad esempio, 1 per la regressione lineare, 2 per la regressione quadratica e così via. |
| x_series | string |
Nome della colonna contenente la variabile indipendente, ovvero l'asse x o temporale. Questo parametro è facoltativo ed è necessario solo per le serie con spaziatura non uniforme. Il valore predefinito è una stringa vuota, perché x è ridondante per la regressione di una serie a spaziatura uniforme. | |
| x_istime | bool |
Questo parametro è necessario solo se viene specificato x_series ed è un vettore di datetime. |
Definizione di funzione
È possibile definire la funzione incorporando il codice come funzione definita da query o creandola come funzione archiviata nel database, come indicato di seguito:
Definire la funzione usando l'istruzione let seguente. Non sono necessarie autorizzazioni.
Importante
Un'istruzione let non può essere eseguita autonomamente. Deve essere seguita da un'istruzione di espressione tabulare. Per eseguire un esempio funzionante di series_fit_poly_fl(), vedere Esempi.
let series_fit_poly_fl=(tbl:(*), y_series:string, y_fit_series:string, fit_coeff:string, degree:int, x_series:string='', x_istime:bool=False)
{
    let kwargs = bag_pack('y_series', y_series, 'y_fit_series', y_fit_series, 'fit_coeff', fit_coeff, 'degree', degree, 'x_series', x_series, 'x_istime', x_istime);
    let code = ```if 1:
        y_series = kargs["y_series"]
        y_fit_series = kargs["y_fit_series"]
        fit_coeff = kargs["fit_coeff"]
        degree = kargs["degree"]
        x_series = kargs["x_series"]
        x_istime = kargs["x_istime"]

        def fit(ts_row, x_col, y_col, deg):
            y = ts_row[y_col]
            if x_col == "": # If there is no x column creates sequential range [1, len(y)]
               x = np.arange(len(y)) + 1
            else: # if x column exists check whether its a time column. If so, normalize it to the [1, len(y)] range, else take it as is.
               if x_istime:
                   x = pd.to_numeric(pd.to_datetime(ts_row[x_col]))
                   x = x - x.min()
                   x = x / x.max()
                   x = x * (len(x) - 1) + 1
               else:
                   x = ts_row[x_col]
            coeff = np.polyfit(x, y, deg)
            p = np.poly1d(coeff)
            z = p(x)
            return z, coeff

        result = df
        if len(df):
           result[[y_fit_series, fit_coeff]] = df.apply(fit, axis=1, args=(x_series, y_series, degree,), result_type="expand")
    ```;
    tbl
     | evaluate python(typeof(*), code, kwargs)
};
// Write your query to use the function here.
Esempio
Negli esempi seguenti viene usato l'operatore invoke per eseguire la funzione .
Adattare il polinomio di quinto ordine a una serie temporale regolare
Per usare una funzione definita da query, richiamarla dopo la definizione della funzione incorporata.
let series_fit_poly_fl=(tbl:(*), y_series:string, y_fit_series:string, fit_coeff:string, degree:int, x_series:string='', x_istime:bool=False)
{
let kwargs = bag_pack('y_series', y_series, 'y_fit_series', y_fit_series, 'fit_coeff', fit_coeff, 'degree', degree, 'x_series', x_series, 'x_istime', x_istime);
let code = ```if 1:
y_series = kargs["y_series"]
y_fit_series = kargs["y_fit_series"]
fit_coeff = kargs["fit_coeff"]
degree = kargs["degree"]
x_series = kargs["x_series"]
x_istime = kargs["x_istime"]
def fit(ts_row, x_col, y_col, deg):
y = ts_row[y_col]
if x_col == "": # If there is no x column creates sequential range [1, len(y)]
x = np.arange(len(y)) + 1
else: # if x column exists check whether its a time column. If so, normalize it to the [1, len(y)] range, else take it as is.
if x_istime:
x = pd.to_numeric(pd.to_datetime(ts_row[x_col]))
x = x - x.min()
x = x / x.max()
x = x * (len(x) - 1) + 1
else:
x = ts_row[x_col]
coeff = np.polyfit(x, y, deg)
p = np.poly1d(coeff)
z = p(x)
return z, coeff
result = df
if len(df):
result[[y_fit_series, fit_coeff]] = df.apply(fit, axis=1, args=(x_series, y_series, degree,), result_type="expand")
```;
tbl
| evaluate python(typeof(*), code, kwargs)
};
//
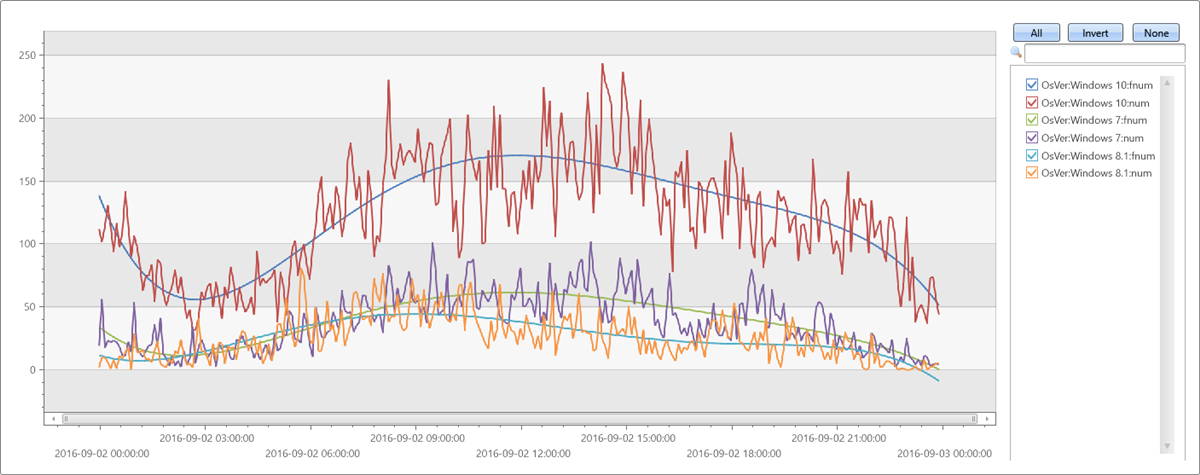
// Fit fifth order polynomial to a regular (evenly spaced) time series, created with make-series
//
let max_t = datetime(2016-09-03);
demo_make_series1
| make-series num=count() on TimeStamp from max_t-1d to max_t step 5m by OsVer
| extend fnum = dynamic(null), coeff=dynamic(null), fnum1 = dynamic(null), coeff1=dynamic(null)
| invoke series_fit_poly_fl('num', 'fnum', 'coeff', 5)
| render timechart with(ycolumns=num, fnum)
Output
Testare serie temporali irregolari
Per usare una funzione definita da query, richiamarla dopo la definizione della funzione incorporata.
let series_fit_poly_fl=(tbl:(*), y_series:string, y_fit_series:string, fit_coeff:string, degree:int, x_series:string='', x_istime:bool=False)
{
let kwargs = bag_pack('y_series', y_series, 'y_fit_series', y_fit_series, 'fit_coeff', fit_coeff, 'degree', degree, 'x_series', x_series, 'x_istime', x_istime);
let code = ```if 1:
y_series = kargs["y_series"]
y_fit_series = kargs["y_fit_series"]
fit_coeff = kargs["fit_coeff"]
degree = kargs["degree"]
x_series = kargs["x_series"]
x_istime = kargs["x_istime"]
def fit(ts_row, x_col, y_col, deg):
y = ts_row[y_col]
if x_col == "": # If there is no x column creates sequential range [1, len(y)]
x = np.arange(len(y)) + 1
else: # if x column exists check whether its a time column. If so, normalize it to the [1, len(y)] range, else take it as is.
if x_istime:
x = pd.to_numeric(pd.to_datetime(ts_row[x_col]))
x = x - x.min()
x = x / x.max()
x = x * (len(x) - 1) + 1
else:
x = ts_row[x_col]
coeff = np.polyfit(x, y, deg)
p = np.poly1d(coeff)
z = p(x)
return z, coeff
result = df
if len(df):
result[[y_fit_series, fit_coeff]] = df.apply(fit, axis=1, args=(x_series, y_series, degree,), result_type="expand")
```;
tbl
| evaluate python(typeof(*), code, kwargs)
};
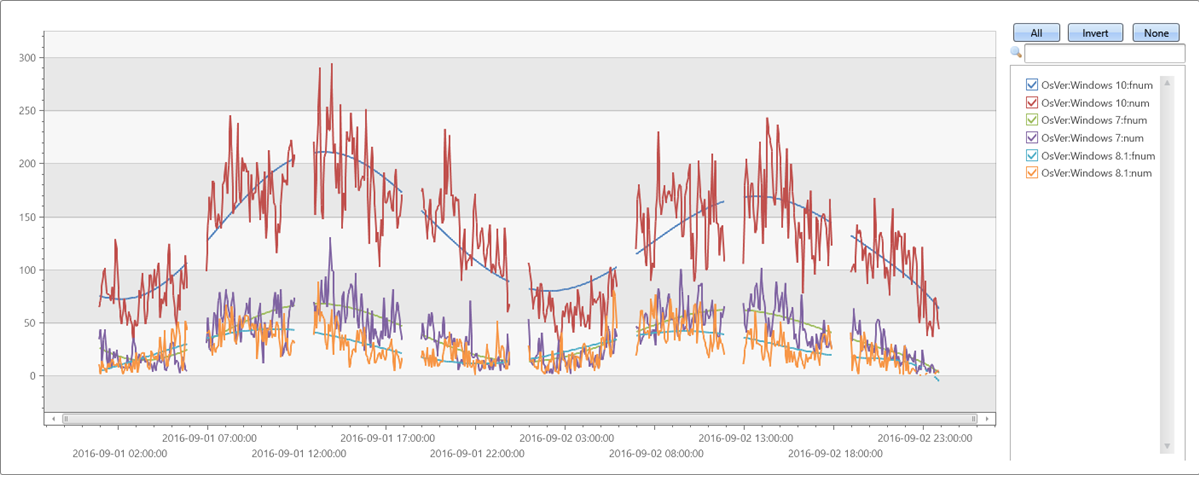
let max_t = datetime(2016-09-03);
demo_make_series1
| where TimeStamp between ((max_t-2d)..max_t)
| summarize num=count() by bin(TimeStamp, 5m), OsVer
| order by TimeStamp asc
| where hourofday(TimeStamp) % 6 != 0 // delete every 6th hour to create unevenly spaced time series
| summarize TimeStamp=make_list(TimeStamp), num=make_list(num) by OsVer
| extend fnum = dynamic(null), coeff=dynamic(null)
| invoke series_fit_poly_fl('num', 'fnum', 'coeff', 8, 'TimeStamp', True)
| render timechart with(ycolumns=num, fnum)
Output
Polinomio di quinto ordine con rumore su assi x & y
Per usare una funzione definita da query, richiamarla dopo la definizione della funzione incorporata.
let series_fit_poly_fl=(tbl:(*), y_series:string, y_fit_series:string, fit_coeff:string, degree:int, x_series:string='', x_istime:bool=False)
{
let kwargs = bag_pack('y_series', y_series, 'y_fit_series', y_fit_series, 'fit_coeff', fit_coeff, 'degree', degree, 'x_series', x_series, 'x_istime', x_istime);
let code = ```if 1:
y_series = kargs["y_series"]
y_fit_series = kargs["y_fit_series"]
fit_coeff = kargs["fit_coeff"]
degree = kargs["degree"]
x_series = kargs["x_series"]
x_istime = kargs["x_istime"]
def fit(ts_row, x_col, y_col, deg):
y = ts_row[y_col]
if x_col == "": # If there is no x column creates sequential range [1, len(y)]
x = np.arange(len(y)) + 1
else: # if x column exists check whether its a time column. If so, normalize it to the [1, len(y)] range, else take it as is.
if x_istime:
x = pd.to_numeric(pd.to_datetime(ts_row[x_col]))
x = x - x.min()
x = x / x.max()
x = x * (len(x) - 1) + 1
else:
x = ts_row[x_col]
coeff = np.polyfit(x, y, deg)
p = np.poly1d(coeff)
z = p(x)
return z, coeff
result = df
if len(df):
result[[y_fit_series, fit_coeff]] = df.apply(fit, axis=1, args=(x_series, y_series, degree,), result_type="expand")
```;
tbl
| evaluate python(typeof(*), code, kwargs)
};
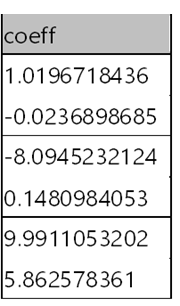
range x from 1 to 200 step 1
| project x = rand()*5 - 2.3
| extend y = pow(x, 5)-8*pow(x, 3)+10*x+6
| extend y = y + (rand() - 0.5)*0.5*y
| summarize x=make_list(x), y=make_list(y)
| extend y_fit = dynamic(null), coeff=dynamic(null)
| invoke series_fit_poly_fl('y', 'y_fit', 'coeff', 5, 'x')
|fork (project-away coeff) (project coeff | mv-expand coeff)
| render linechart
Output

Questa funzionalità non è supportata.
Commenti e suggerimenti
Presto disponibile: Nel corso del 2024 verranno gradualmente disattivati i problemi di GitHub come meccanismo di feedback per il contenuto e ciò verrà sostituito con un nuovo sistema di feedback. Per altre informazioni, vedere https://aka.ms/ContentUserFeedback.
Invia e visualizza il feedback per