Application Insights による Azure Batch .NET アプリケーションの監視とデバッグ
Application Insights には、Azure サービスにデプロイされたアプリケーションを開発者が監視およびデバッグできる洗練された強力な方法が用意されています。 Application Insights を使用してパフォーマンス カウンターと例外を監視し、カスタム メトリックとトレースでコードをインストルメント化します。 Application Insights を Azure Batch アプリケーションと統合すると、動作をよく理解し、問題をほぼリアルタイムで調査できます。
この記事では、Azure Batch .NET ソリューションに Application Insights ライブラリを追加して構成し、アプリケーション コードをインストルメント化する方法を示します。 Azure Portal 経由でアプリケーションを監視し、カスタム ダッシュボードを構築する方法も示します。 他の言語での Application Insights のサポートについては、言語、プラットフォーム、統合に関するドキュメントをご覧ください。
この記事に付属するサンプル C# ソリューションとコードは、GitHub にあります。 この例では、Application Insights インストルメンテーション コードを TopNWords の例に追加します。 この例をよく理解していない場合は、最初に TopNWords を構築し、実行してみてください。 そうすることで、複数のコンピューティング ノードで一連の入力 BLOB を並列に処理する基本的な Batch ワークフローを理解できます。
ヒント
VM パフォーマンス カウンターなどの Application Insights データを Batch Explorer で表示するように Batch ソリューションを構成する方法もあります。 Batch Explorer は、Azure Batch アプリケーションの作成、デバッグ、および監視を支援する、豊富な機能を備えた無料のスタンドアロン クライアント ツールです。 Mac、Linux、または Windows 用のインストール パッケージをダウンロードしてください。 Application Insights のデータを Batch Explorer で有効にする簡単な手順については、batch-insights リポジトリを参照してください。
前提条件
Application Insights リソース。 Azure Portal を使用して、Application Insights の "リソース" を作成します。 [アプリケーションの種類] として [全般] を選択します。
Azure portal からインストルメンテーション キーをコピーします。 この値は後で必要になります。
Note
Application Insights に格納されているデータは課金されることがあります。 この記事で説明する診断データと監視データも対象となります。
アプリケーションの正常性と利用状況の監視
プロジェクトには、Microsoft.ApplicationInsights.WindowsServer NuGet パッケージおよびその依存関係が必要です。 アプリケーションのプロジェクトに追加または復元します。 パッケージをインストールするには、Install-Package コマンドまたは NuGet パッケージ マネージャーを使用します。
Install-Package Microsoft.ApplicationInsights.WindowsServer
Microsoft.ApplicationInsights 名前空間を使用して、.NET アプリケーションから Application Insights を参照します。
コードをインストルメント化する
コードをインストルメント化するには、ソリューションで Application Insights TelemetryClient を作成する必要があります。 例では、TelemetryClient はその構成を ApplicationInsights.config ファイルから読み込みます。 Application Insights インストルメンテーション キー Microsoft.Azure.Batch.Samples.TelemetryStartTask と TopNWordsSample を使用して、次のプロジェクトの ApplicationInsights.config を更新してください。
<InstrumentationKey>YOUR-IKEY-GOES-HERE</InstrumentationKey>
また、TopNWords.cs ファイルのインストルメンテーション キーを追加します。
TopNWords.cs の例では、Application Insights API から次のインストルメンテーション呼び出しを使用します。
TrackMetric()- コンピューティング ノードが必要なテキスト ファイルのダウンロードに要した時間の平均を追跡します。TrackTrace()- デバッグ呼び出しをコードに追加します。TrackEvent()- キャプチャする対象イベントを追跡します。
この例では、例外処理を意図的に省略しています。 代わりに、ハンドルされない例外が Application Insights によって自動的にレポートされるので、デバッグ エクスペリエンスが大幅に向上します。
次のスニペットに、これらのメソッドを使用する方法を示します。
public void CountWords(string blobName, int numTopN, string storageAccountName, string storageAccountKey)
{
    // simulate exception for some set of tasks
    Random rand = new Random();
    if (rand.Next(0, 10) % 10 == 0)
    {
        blobName += ".badUrl";
    }

    // log the url we are downloading the file from
    insightsClient.TrackTrace(new TraceTelemetry(string.Format("Task {0}: Download file from: {1}", this.taskId, blobName), SeverityLevel.Verbose));

    // open the cloud blob that contains the book
    var storageCred = new StorageCredentials(storageAccountName, storageAccountKey);
    CloudBlockBlob blob = new CloudBlockBlob(new Uri(blobName), storageCred);
    using (Stream memoryStream = new MemoryStream())
    {
        // calculate blob download time
        DateTime start = DateTime.Now;
        blob.DownloadToStream(memoryStream);
        TimeSpan downloadTime = DateTime.Now.Subtract(start);

        // track how long the blob takes to download on this node
        // this will help debug timing issues or identify poorly performing nodes
        insightsClient.TrackMetric("Blob download in seconds", downloadTime.TotalSeconds, this.CommonProperties);

        memoryStream.Position = 0; //Reset the stream
        var sr = new StreamReader(memoryStream);
        var myStr = sr.ReadToEnd();
        string[] words = myStr.Split(' ');

        // log how many words were found in the text file
        insightsClient.TrackTrace(new TraceTelemetry(string.Format("Task {0}: Found {1} words", this.taskId, words.Length), SeverityLevel.Verbose));
        var topNWords =
            words.
                Where(word => word.Length > 0).
                GroupBy(word => word, (key, group) => new KeyValuePair<String, long>(key, group.LongCount())).
                OrderByDescending(x => x.Value).
                Take(numTopN).
                ToList();
        foreach (var pair in topNWords)
        {
            Console.WriteLine("{0} {1}", pair.Key, pair.Value);
        }

        // emit an event to track the completion of the task
        insightsClient.TrackEvent("Done counting words");
    }
}
Azure Batch テレメトリの初期化子ヘルパー
特定のサーバーとインスタンスのテレメトリをレポートする際に、Application Insights は既定値に Azure VM ロールと VM 名を使用します。 Azure Batch のコンテキストで、例ではプール名とコンピューティング ノードを代わりに使用する方法を示しています。 テレメトリ初期化子を使用して既定値をオーバーライドします。
using Microsoft.ApplicationInsights.Channel;
using Microsoft.ApplicationInsights.Extensibility;
using System;
using System.Threading;

namespace Microsoft.Azure.Batch.Samples.TelemetryInitializer
{
    public class AzureBatchNodeTelemetryInitializer : ITelemetryInitializer
    {
        // Azure Batch environment variables
        private const string PoolIdEnvironmentVariable = "AZ_BATCH_POOL_ID";
        private const string NodeIdEnvironmentVariable = "AZ_BATCH_NODE_ID";

        private string roleInstanceName;
        private string roleName;

        public void Initialize(ITelemetry telemetry)
        {
            if (string.IsNullOrEmpty(telemetry.Context.Cloud.RoleName))
            {
                // override the role name with the Azure Batch Pool name
                string name = LazyInitializer.EnsureInitialized(ref this.roleName, this.GetPoolName);
                telemetry.Context.Cloud.RoleName = name;
            }

            if (string.IsNullOrEmpty(telemetry.Context.Cloud.RoleInstance))
            {
                // override the role instance with the Azure Batch Compute Node name
                string name = LazyInitializer.EnsureInitialized(ref this.roleInstanceName, this.GetNodeName);
                telemetry.Context.Cloud.RoleInstance = name;
            }
        }

        private string GetPoolName()
        {
            return Environment.GetEnvironmentVariable(PoolIdEnvironmentVariable) ?? string.Empty;
        }

        private string GetNodeName()
        {
            return Environment.GetEnvironmentVariable(NodeIdEnvironmentVariable) ?? string.Empty;
        }
    }
}
テレメトリ初期化子を有効にするために、TopNWordsSample プロジェクトの ApplicationInsights.config ファイルには次の内容が含まれています。
<TelemetryInitializers>
    <Add Type="Microsoft.Azure.Batch.Samples.TelemetryInitializer.AzureBatchNodeTelemetryInitializer, Microsoft.Azure.Batch.Samples.TelemetryInitializer"/>
</TelemetryInitializers>
ジョブとタスクを更新して Application Insights バイナリを含める
Application Insights をコンピューティング ノードで正常に実行するためには、バイナリが正しく配置されていることを確認します。 タスクのリソース ファイル コレクションに必要なバイナリを追加して、タスクの実行時にそれらがダウンロードされるようにします。 次のスニペットは、Job.cs 内のコードに似ています。
最初に、アップロードする Application Insights ファイルの静的リストを作成します。
private static readonly List<string> AIFilesToUpload = new List<string>()
{
    // Application Insights config and assemblies
    "ApplicationInsights.config",
    "Microsoft.ApplicationInsights.dll",
    "Microsoft.AI.Agent.Intercept.dll",
    "Microsoft.AI.DependencyCollector.dll",
    "Microsoft.AI.PerfCounterCollector.dll",
    "Microsoft.AI.ServerTelemetryChannel.dll",
    "Microsoft.AI.WindowsServer.dll",

    // custom telemetry initializer assemblies
    "Microsoft.Azure.Batch.Samples.TelemetryInitializer.dll",
 };
...
次に、タスクによって使用されるステージング ファイルを作成します。
...
// create file staging objects that represent the executable and its dependent assembly to run as the task.
// These files are copied to every node before the corresponding task is scheduled to run on that node.
FileToStage topNWordExe = new FileToStage(TopNWordsExeName, stagingStorageAccount);
FileToStage storageDll = new FileToStage(StorageClientDllName, stagingStorageAccount);

// Upload Application Insights assemblies
List<FileToStage> aiStagedFiles = new List<FileToStage>();
foreach (string aiFile in AIFilesToUpload)
{
    aiStagedFiles.Add(new FileToStage(aiFile, stagingStorageAccount));
}
...
FileToStage メソッドは、コード サンプルのヘルパー関数で、ローカル ディスクから Azure Storage Blob にファイルを簡単にアップロードできるようにします。 各ファイルは後でコンピューティング ノードにダウンロードされ、タスクによって参照されます。
最後に、タスクをジョブに追加し、必要な Application Insights バイナリを含めます。
...
// initialize a collection to hold the tasks that will be submitted in their entirety
List<CloudTask> tasksToRun = new List<CloudTask>(topNWordsConfiguration.NumberOfTasks);
for (int i = 1; i <= topNWordsConfiguration.NumberOfTasks; i++)
{
    CloudTask task = new CloudTask("task_no_" + i, String.Format("{0} --Task {1} {2} {3} {4}",
        TopNWordsExeName,
        string.Format("https://{0}.blob.core.windows.net/{1}",
            accountSettings.StorageAccountName,
            documents[i]),
        topNWordsConfiguration.TopWordCount,
        accountSettings.StorageAccountName,
        accountSettings.StorageAccountKey));

    //This is the list of files to stage to a container -- for each job, one container is created and
    //files all resolve to Azure Blobs by their name (so two tasks with the same named file will create just 1 blob in
    //the container).
    task.FilesToStage = new List<IFileStagingProvider>
                        {
                            // required application binaries
                            topNWordExe,
                            storageDll,
                        };
    foreach (FileToStage stagedFile in aiStagedFiles)
   {
        task.FilesToStage.Add(stagedFile);
   }
    task.RunElevated = false;
    tasksToRun.Add(task);
}
Azure Portal でデータを表示する
これで、Application Insights を使用するジョブとタスクを構成したので、プール内のサンプル ジョブを実行します。 Azure Portal に移動し、プロビジョニングした Application Insights リソースを開きます。 プールがプロビジョニングされると、データが流れてログに記録され始めるのがわかります。 この記事の残りの部分ではいくつかの Application Insights 機能についてのみ説明しますが、完全な機能セットを自由に探索してください。
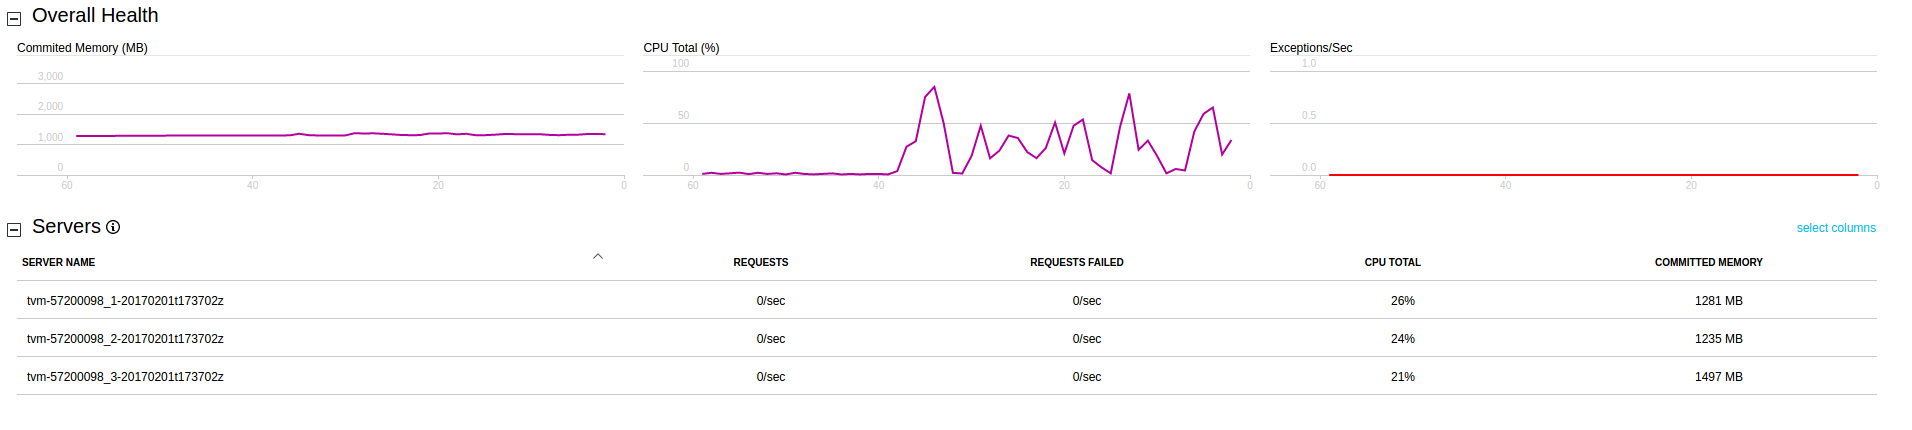
ライブ ストリーム データの表示
Application Insights リソースのトレース ログを表示するには、[ライブ ストリーム] をクリックします。 次のスクリーンショットは、コンピューティング ノードあたりの CPU 使用率など、プール内のコンピューティング ノードから取得したライブ データを表示する方法を示しています。
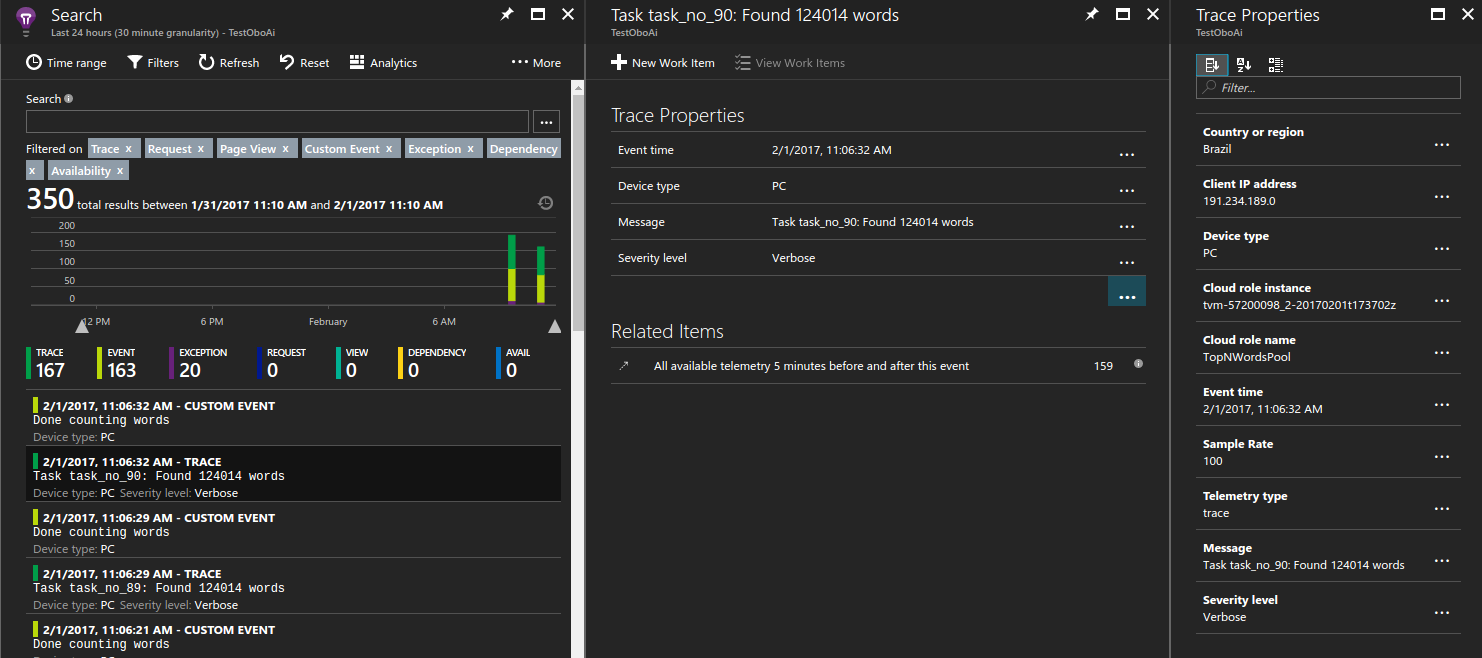
トレース ログの表示
Application Insights リソースのトレース ログを表示するには、[検索] をクリックします。 このビューには、トレース、イベント、例外など、Application Insights によってキャプチャされた診断データの一覧が表示されます。
次のスクリーンショットは、タスクの 1 つのトレースがどのようにログに記録され、その後デバッグを目的としたクエリがどのように実行されるかを示しています。
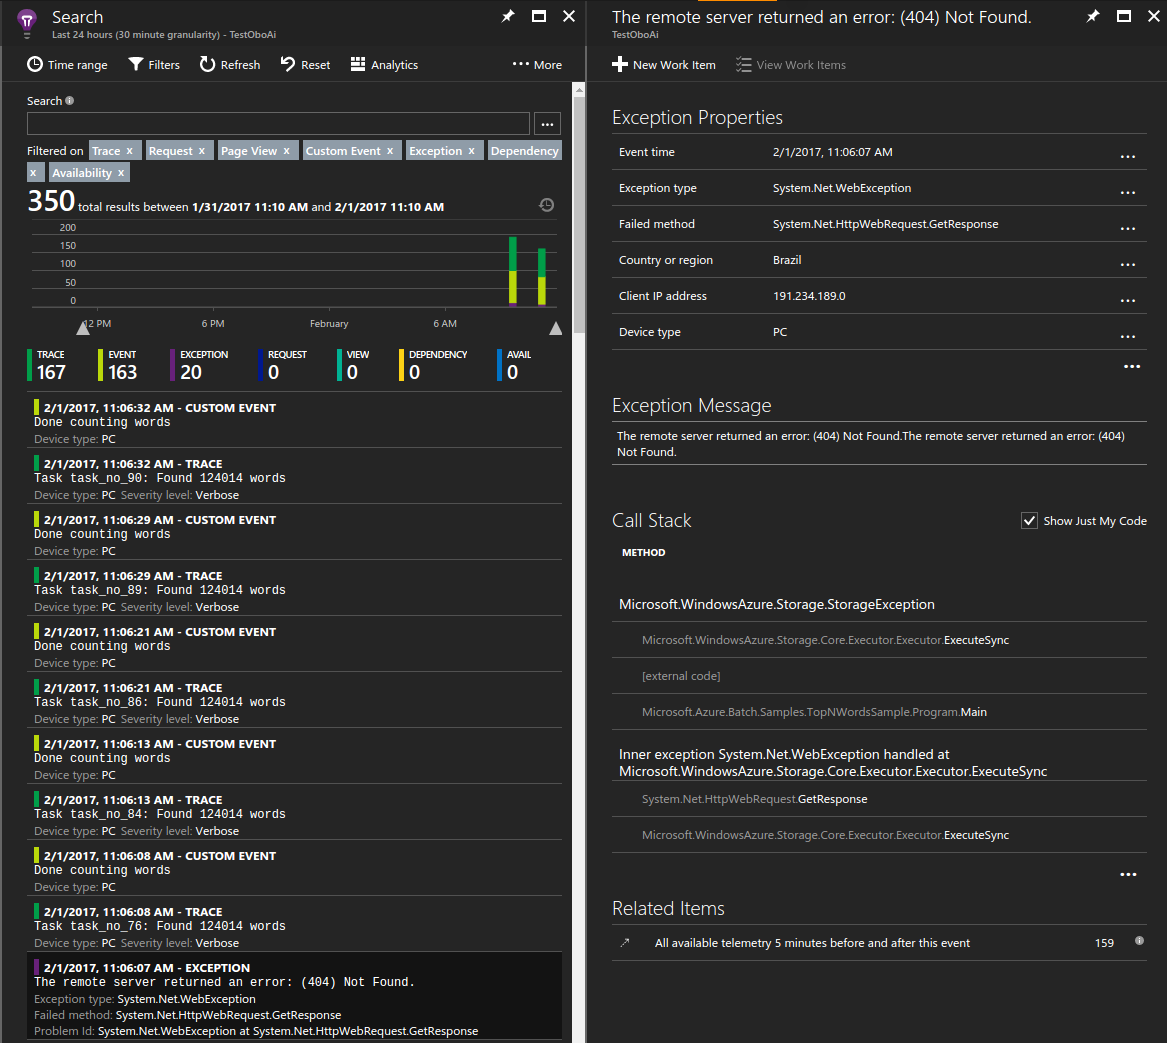
ハンドルされない例外の表示
Application Insights はアプリケーションからスローされる例外を記録します。 この場合、アプリケーションが例外をスローしてから数秒以内に、特定の例外の詳細を確認して問題を診断できます。
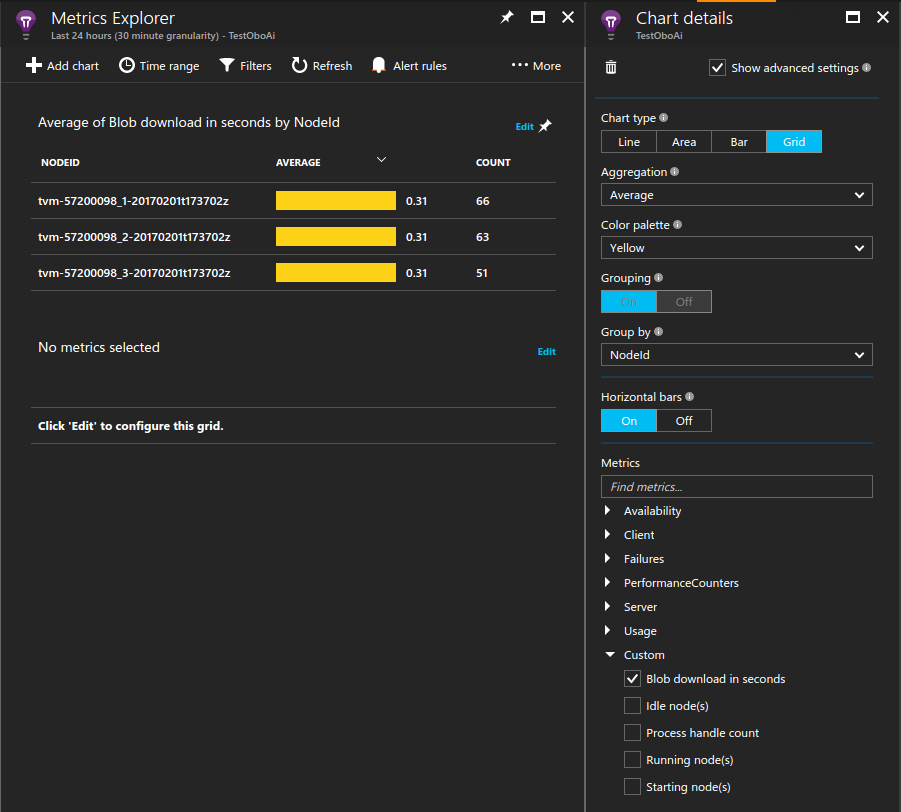
BLOB ダウンロード時間の測定
カスタム メトリックも、ポータルの重要なツールです。 たとえば、各コンピューティング ノードが処理する必須テキスト ファイルのダウンロードに要した平均時間を表示できます。
サンプル グラフを作成するには:
- Application Insights リソースで、 [メトリックス エクスプローラー]>[グラフの追加] をクリックします。
- 追加されたグラフで [編集] をクリックします。
- グラフの詳細を次のように更新します。
- [グラフの種類] を [グリッド] に設定します。
- [集計] を [平均] に設定します。
- [グループ化] を [NodeId] に設定します。
- [メトリック] で、[カスタム]>[Blob download in seconds]\(秒単位の BLOB ダウンロード\) を選択します。
- [カラー パレット] の表示を任意に調整します。
コンピューティング ノードの継続的な監視
パフォーマンス カウンターを含むすべてのメトリックはタスクの実行時にのみログに記録されることにお気付きでしょう。 この動作は、Application Insights でログに記録されるデータ量を制限するので便利です。 ただし、コンピューティング ノードを常に監視するのが望ましい場合があります。 たとえば、Batch サービスを介してスケジュール設定されたものではないバックグラウンド作業が実行されることがあります。 この場合、コンピューティング ノードの存続期間にわたって実行されるように監視プロセスを設定します。
この動作を実現する 1 つの方法は、Application Insights ライブラリを読み込むプロセスを生成し、バックグラウンドで実行することです。 例では、開始タスクはマシン上でバイナリを読み込み、プロセスを無期限に実行します。 パフォーマンス カウンターなどの必要な追加データを出力するように、このプロセス用の Application Insights 構成ファイルを構成します。
...
 // Batch start task telemetry runner
private const string BatchStartTaskFolderName = "StartTask";
private const string BatchStartTaskTelemetryRunnerName = "Microsoft.Azure.Batch.Samples.TelemetryStartTask.exe";
private const string BatchStartTaskTelemetryRunnerAIConfig = "ApplicationInsights.config";
...
CloudPool pool = client.PoolOperations.CreatePool(
    topNWordsConfiguration.PoolId,
    targetDedicated: topNWordsConfiguration.PoolNodeCount,
    virtualMachineSize: "standard_d1_v2",
    VirtualMachineConfiguration: new VirtualMachineConfiguration(
    imageReference: new ImageReference(
                        publisher: "MicrosoftWindowsServer",
                        offer: "WindowsServer",
                        sku: "2019-datacenter-core",
                        version: "latest"),
    nodeAgentSkuId: "batch.node.windows amd64");
...

// Create a start task which will run a dummy exe in background that simply emits performance
// counter data as defined in the relevant ApplicationInsights.config.
// Note that the waitForSuccess on the start task was not set so the Compute Node will be
// available immediately after this command is run.
pool.StartTask = new StartTask()
{
    CommandLine = string.Format("cmd /c {0}", BatchStartTaskTelemetryRunnerName),
    ResourceFiles = resourceFiles
};
...
ヒント
ソリューションの管理の容易性を向上させるために、アプリケーション パッケージにアセンブリをバンドルすることができます。 さらに、プールにアプリケーション パッケージを自動的にデプロイするには、プール構成にアプリケーション パッケージの参照を追加します。
スロットルとサンプル データ
運用環境で実行される Azure Batch アプリケーションは大規模となる性質があるため、コストを管理するために Application Insights によって収集されるデータ量を制限することが必要な場合があります。 これを実現するいくつかのメカニズムについては、「Application Insights におけるサンプリング」をご覧ください。
次のステップ
- Application Insights についてさらに学習します。
- 他の言語での Application Insights のサポートについては、言語、プラットフォーム、統合に関するドキュメントをご覧ください。