System Center Operations Manager REST API リファレンス
System Center Operations Manager REST API リファレンスへようこそ。
Representational State Transfer (REST) API のこのリファレンスは、System Center Operations Manager 1801 以降のバージョンに適用されます。 このプログラムでは、新しい System Center Operations Manager 1801 Web コンソールのカスタム ダッシュボード ウィジェットを使用して、運用データへのアクセスを作成、取得、更新、または削除するための一連の HTTP 操作 (メソッド) がサポートされています。
新しい HTML5 ベースのダッシュボードには、この REST API で使用できるメソッドを使用してさまざまな視覚化で目的の出力を視覚化する HTML コードを実行するカスタム ウィジェットのサポートが含まれています。 Operations Manager HTLM5 ダッシュボードの詳細については、「 HTML5 Web コンソールとダッシュボードの概要」を参照してください。 カスタム ウィジェットの使用方法の詳細については、「 Web コンソールでカスタム ウィジェットを使用してダッシュボードを作成する方法」を参照してください。
注意
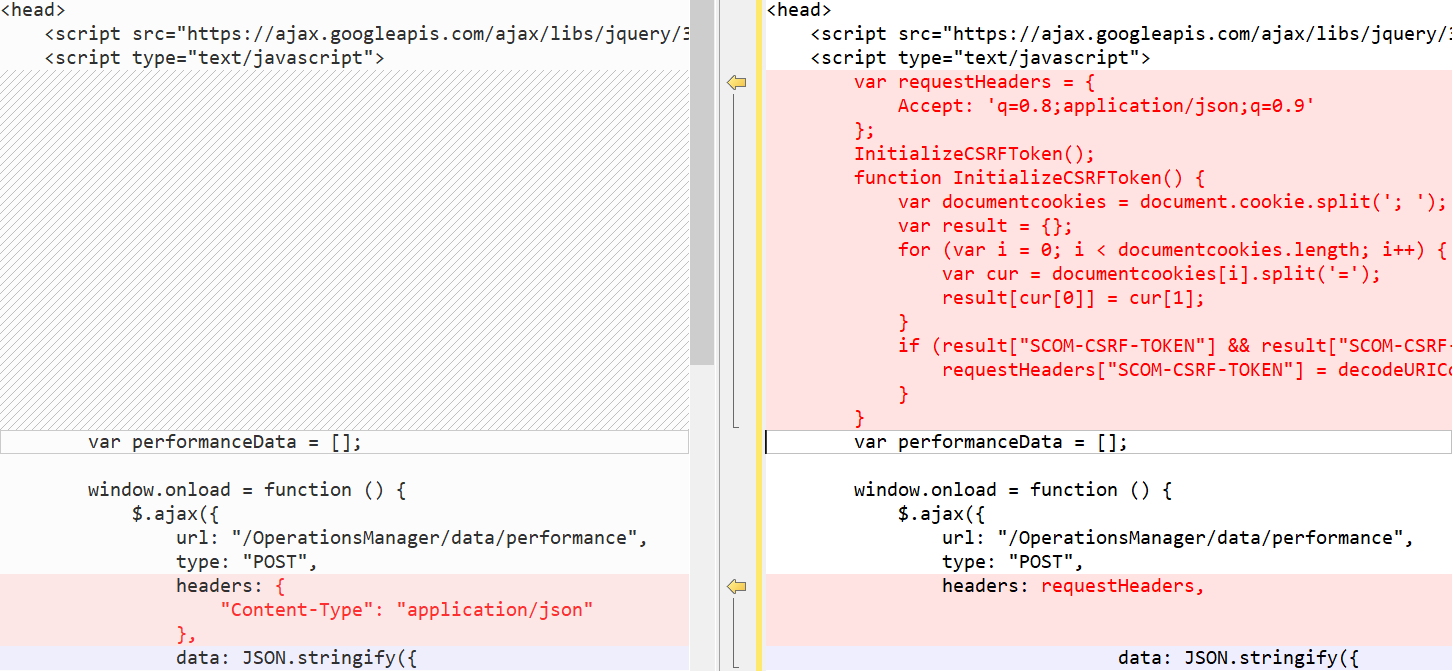
Operations Manager 2019 UR1 では、クロスサイト リクエスト フォージェリ (CSRF) 攻撃を防止するための CSRF トークンがサポートされています。 Operations Manager 2019 UR1 を使用している場合は、CSRF トークンを初期化する必要があります。 CSRF トークンが初期化されていない場合、HTML スクリプトは機能しません。
CSRF トークンを初期化する
Operations Manager 2019 UR1 に適用される必須のアクションです。
- ダッシュボードの HTML ヘッダーに、次のコードを追加します。
            Accept: 'q=0.8;application/json;q=0.9',
            "Content-Type": "application/json"
        };
        InitializeCSRFToken();
        function InitializeCSRFToken() {
            var documentcookies = document.cookie.split('; ');
            var result = {};
            for (var i = 0; i < documentcookies.length; i++) {
                var cur = documentcookies[i].split('=');
                result[cur[0]] = cur[1];
            }
            if (result["SCOM-CSRF-TOKEN"] && result["SCOM-CSRF-TOKEN"] != null) {
                requestHeaders["SCOM-CSRF-TOKEN"] = decodeURIComponent(result["SCOM-CSRF-TOKEN"]);
            }
        }
- onload 関数で、ヘッダー値を requestHeaders に変更します。 ヘッダー値が存在しない場合は、次のように追加します。
例:
例
次の例では、カスタム ウィジェットを使用して Operations Manager REST API を呼び出す方法を示します。
横棒グラフ
次の HTML コードは、アラート データに基づく横棒グラフのレンダリングの例です。
<html>

<head>
    <script src="https://ajax.googleapis.com/ajax/libs/jquery/3.2.1/jquery.min.js"></script>
    <script type="text/javascript">
        var criticalCounter = 0;
        var informationCounter = 0;
        var warningCounter = 0;

        window.onload = function () {
            $.ajax({
                url: "/OperationsManager/data/alert",
                type: "POST",
                data: JSON.stringify ({
                    "classId": null,
                    "objectIds": { "3c8ac4f3-475e-44dd-4163-8a97af363705": -1 },
                    "criteria": "((Severity = '0') OR (Severity = '1') OR (Severity = '2') OR (Severity = '3')) AND ((Priority = '2') OR (Priority = '1') OR (Priority = '0')) AND ((ResolutionState = '0') OR (ResolutionState = '247') OR (ResolutionState = '248') OR (ResolutionState = '249') OR (ResolutionState = '250') OR (ResolutionState = '254') OR (ResolutionState = '255'))",
                    "displayColumns":
                    [
                        "severity","monitoringobjectdisplayname","name","age","repeatcount","lastModified"
                    ]
                }),
                success: function (result) {
                    for (var i = 0; i < result.rows.length; i++) {
            switch(result.rows[i].severity)
            {
                case "Error":
                    criticalCounter++;
                    break;
                case "Information":
                    informationCounter++;
                    break;
                case "Warning":
                                    warningCounter++
                    break;
            }
                    }
                    renderChart();
                }
            });
        }

        function renderChart() {
            var chart = new CanvasJS.Chart("chartContainer", {
                title: {
                    text: "Alerts representation in bar chart"
                },
                data: [{
                    type: "column",
                    dataPoints: [
                        { y: criticalCounter, label: "Critical" },
                        { y: warningCounter, label: "Warning" },
                        { y: informationCounter, label: "Information" }
                    ]
                }]
            });
            chart.render();
        }
    </script>
    <script src="https://cdnjs.cloudflare.com/ajax/libs/canvasjs/1.7.0/canvasjs.min.js"></script>
    <title>CanvasJS Example</title>
</head>

<body>
    <div id="chartContainer" style="height: 400px; width: 100%;"></div>
</body>

</html>
円グラフ
次の HTML コードは、アラート データに基づく円グラフのレンダリングの例です。
<html>

<head>
    <script src="https://ajax.googleapis.com/ajax/libs/jquery/3.2.1/jquery.min.js"></script>
    <script type="text/javascript">
        var criticalCounter = 0;
        var informationCounter = 0;
        var warningCounter = 0;

        window.onload = function () {
            $.ajax({
                url: "/OperationsManager/data/alert",
                type: "POST",
                data: JSON.stringify ({
                    "classId": null,
                    "objectIds": { "3c8ac4f3-475e-44dd-4163-8a97af363705": -1 },
                    "criteria": "((Severity = '0') OR (Severity = '1') OR (Severity = '2') OR (Severity = '3')) AND ((Priority = '2') OR (Priority = '1') OR (Priority = '0')) AND ((ResolutionState = '0') OR (ResolutionState = '247') OR (ResolutionState = '248') OR (ResolutionState = '249') OR (ResolutionState = '250') OR (ResolutionState = '254') OR (ResolutionState = '255'))",
                    "displayColumns":
                    [
                        "severity","monitoringobjectdisplayname","name","age","repeatcount","lastModified"
                    ]
                }),
                success: function (result) {
                    for (var i = 0; i < result.rows.length; i++) {
            switch(result.rows[i].severity)
            {
                case "Error":
                    criticalCounter++;
                    break;
                case "Information":
                    informationCounter++;
                    break;
                case "Warning":
                                    warningCounter++
                    break;
            }
                    }
                    renderChart();
                }
            });
        }

        function renderChart() {
            var chart = new CanvasJS.Chart("chartContainer",
                {
                    theme: "theme2",
                    title: {
                        text: "Alerts representation in Pie chart"
                    },
                    data: [
                        {
                            type: "pie",
                            showInLegend: true,
                            toolTipContent: "{y} - #percent %",
                            legendText: "{indexLabel}",
                            dataPoints: [
                                { y: criticalCounter, indexLabel: "Critical" },
                                { y: warningCounter, indexLabel: "Warning" },
                                { y: informationCounter, indexLabel: "Information" }
                            ]
                        }
                    ]
                });
            chart.render();
        }
    </script>
    <script src="https://cdnjs.cloudflare.com/ajax/libs/canvasjs/1.7.0/canvasjs.min.js"></script>
    <title>CanvasJS Example</title>
</head>

<body>
    <div id="chartContainer" style="height: 400px; width: 100%;"></div>
</body>

</html>
3D 円グラフ
次の HTML コードは、アラート データに基づく 3D 円グラフのレンダリングの例です。
<html>

<head>
    <script src="https://ajax.googleapis.com/ajax/libs/jquery/3.2.1/jquery.min.js"></script>
    <script type="text/javascript">
        var criticalCounter = 0;
        var informationCounter = 0;
        var warningCounter = 0;

        window.onload = function () {
            $.ajax({
                url: "/OperationsManager/data/alert",
                type: "POST",
                data: JSON.stringify ({
                    "classId": null,
                    "objectIds": { "3c8ac4f3-475e-44dd-4163-8a97af363705": -1 },
                    "criteria": "((Severity = '0') OR (Severity = '1') OR (Severity = '2') OR (Severity = '3')) AND ((Priority = '2') OR (Priority = '1') OR (Priority = '0')) AND ((ResolutionState = '0') OR (ResolutionState = '247') OR (ResolutionState = '248') OR (ResolutionState = '249') OR (ResolutionState = '250') OR (ResolutionState = '254') OR (ResolutionState = '255'))",
                    "displayColumns":
                    [
                        "severity","monitoringobjectdisplayname","name","age","repeatcount","lastModified"
                    ]
                }),
                success: function (result) {
                    for (var i = 0; i < result.rows.length; i++) {
            switch(result.rows[i].severity)
            {
                case "Error":
                    criticalCounter++;
                    break;
                case "Information":
                    informationCounter++;
                    break;
                case "Warning":
                                    warningCounter++
                    break;
            }
                    }
                    renderChart();
                }
            });
        }

        function renderChart() {
            var chart = new Highcharts.chart('container', {
    chart: {
        type: 'pie',
        options3d: {
            enabled: true,
            alpha: 45,
            beta: 0
        }
    },
    title: {
        text: 'Alerts share per severity'
    },
    tooltip: {
        pointFormat: '{series.name}: <b>{point.percentage:.1f}%</b>'
    },
    plotOptions: {
        pie: {
            allowPointSelect: true,
            cursor: 'pointer',
            depth: 35,
            dataLabels: {
                enabled: true,
                format: '{point.name}'
            }
        }
    },
    series: [{
        type: 'pie',
        name: 'Alerts share',
        data: [
            {
                name: 'Critical',
                y: 48,
                sliced: true,
                selected: true
            },
            ['Warning', 39],
            ['Information', 13],
        ]
    }]
});

            chart.render();
        }
    </script>
   <script src="https://code.highcharts.com/highcharts.js"></script>
<script src="https://code.highcharts.com/highcharts-3d.js"></script>
<script src="https://code.highcharts.com/modules/exporting.js"></script>

<div id="container" style="height: 400px"></div>
</head>

<body>
    <div id="chartContainer" style="height: 400px; width: 100%;"></div>
</body>

</html>
ドーナツ グラフ
次の HTML コードは、アラート データに基づくドーナツ グラフのレンダリングの例です。
<html>

<head>
    <script src="https://ajax.googleapis.com/ajax/libs/jquery/3.2.1/jquery.min.js"></script>
    <script type="text/javascript">
        var criticalCounter = 0;
        var informationCounter = 0;
        var warningCounter = 0;

        window.onload = function () {
            $.ajax({
                url: "/OperationsManager/data/alert",
                type: "POST",
                data: JSON.stringify ({
                    "classId": null,
                    "objectIds": { "3c8ac4f3-475e-44dd-4163-8a97af363705": -1 },
                    "criteria": "((Severity = '0') OR (Severity = '1') OR (Severity = '2') OR (Severity = '3')) AND ((Priority = '2') OR (Priority = '1') OR (Priority = '0')) AND ((ResolutionState = '0') OR (ResolutionState = '247') OR (ResolutionState = '248') OR (ResolutionState = '249') OR (ResolutionState = '250') OR (ResolutionState = '254') OR (ResolutionState = '255'))",
                    "displayColumns":
                    [
                        "severity","monitoringobjectdisplayname","name","age","repeatcount","lastModified"
                    ]
                }),
                success: function (result) {
                    for (var i = 0; i < result.rows.length; i++) {
            switch(result.rows[i].severity)
            {
                case "Error":
                    criticalCounter++;
                    break;
                case "Information":
                    informationCounter++;
                    break;
                case "Warning":
                                    warningCounter++
                    break;
            }
                    }
                    renderChart();
                }
            });
        }

        function renderChart() {
            var chart = new CanvasJS.Chart("chartContainer",
                {
                    theme: "theme2",
animationEnabled: true,
                    title: {
                        text: "Alerts representation in doughnut"
                    },
                    data: [
                        {
                            type: "doughnut",
                indexLabelFontFamily: "Garamond",
                indexLabelFontSize: 20,
                startAngle:0,
                indexLabelFontColor: "dimgrey",
                indexLabelLineColor: "darkgrey",
                toolTipContent: "{y} %",
                            dataPoints: [
                                { y: criticalCounter, indexLabel: "Critical" },
                                { y: warningCounter, indexLabel: "Warning" },
                                { y: informationCounter, indexLabel: "Information" }
                            ]
                        }
                    ]
                });
            chart.render();
        }
    </script>
    <script src="https://cdnjs.cloudflare.com/ajax/libs/canvasjs/1.7.0/canvasjs.min.js"></script>
    <title>CanvasJS Example</title>
</head>

<body>
    <div id="chartContainer" style="height: 400px; width: 100%;"></div>
</body>

</html>
3D ドーナツ グラフ
次の HTML コードは、アラート データに基づく 3D ドーナツ グラフのレンダリングの例です。
<html>

<head>
    <script src="https://ajax.googleapis.com/ajax/libs/jquery/3.2.1/jquery.min.js"></script>
    <script type="text/javascript">
        var criticalCounter = 0;
        var informationCounter = 0;
        var warningCounter = 0;

        window.onload = function () {
            $.ajax({
                url: "/OperationsManager/data/alert",
                type: "POST",
                data: JSON.stringify ({
                    "classId": null,
                    "objectIds": { "3c8ac4f3-475e-44dd-4163-8a97af363705": -1 },
                    "criteria": "((Severity = '0') OR (Severity = '1') OR (Severity = '2') OR (Severity = '3')) AND ((Priority = '2') OR (Priority = '1') OR (Priority = '0')) AND ((ResolutionState = '0') OR (ResolutionState = '247') OR (ResolutionState = '248') OR (ResolutionState = '249') OR (ResolutionState = '250') OR (ResolutionState = '254') OR (ResolutionState = '255'))",
                    "displayColumns":
                    [
                        "severity","monitoringobjectdisplayname","name","age","repeatcount","lastModified"
                    ]
                }),
                success: function (result) {
                    for (var i = 0; i < result.rows.length; i++) {
            switch(result.rows[i].severity)
            {
                case "Error":
                    criticalCounter++;
                    break;
                case "Information":
                    informationCounter++;
                    break;
                case "Warning":
                                    warningCounter++
                    break;
            }
                    }
                    renderChart();
                }
            });
        }

        function renderChart() {
            var chart = Highcharts.chart('container', {
    chart: {
        type: 'pie',
        options3d: {
            enabled: true,
            alpha: 45
        }
    },
    title: {
        text: 'Alerts representation in 3D donut'
    },
    subtitle: {
        text: ''
    },
    plotOptions: {
        pie: {
            innerSize: 100,
            depth: 45
        }
    },
    series: [{
        name: 'Number of alerts',
        data: [
        ['Critical', criticalCounter],
                                ['Warning', warningCounter ],
                                ['Information',  informationCounter]

        ]
    }]
});
            chart.render();
        }
    </script>
    <script src="https://code.highcharts.com/highcharts.js"></script>
<script src="https://code.highcharts.com/highcharts-3d.js"></script>
<script src="https://code.highcharts.com/modules/exporting.js"></script>

<div id="container" style="height: 400px">
</div>
</head>

<body>
    <div id="chartContainer" style="height: 400px; width: 100%;"></div>
</body>

</html>
複合グラフ
次の HTML コードは、円およびスプライン グラフにアラートを表示するために複合グラフを作成する例です。
<html>

<head>
    <script src="https://ajax.googleapis.com/ajax/libs/jquery/3.2.1/jquery.min.js"></script>
    <script type="text/javascript">
        var criticalCounter = 0;
        var informationCounter = 0;
        var warningCounter = 0;
var totalCounter =0;

        window.onload = function () {
            $.ajax({
                url: "/OperationsManager/data/alert",
                type: "POST",
                data: JSON.stringify ({
                    "classId": null,
                    "objectIds": { "3c8ac4f3-475e-44dd-4163-8a97af363705": -1 },
                    "criteria": "((Severity = '0') OR (Severity = '1') OR (Severity = '2') OR (Severity = '3')) AND ((Priority = '2') OR (Priority = '1') OR (Priority = '0')) AND ((ResolutionState = '0') OR (ResolutionState = '247') OR (ResolutionState = '248') OR (ResolutionState = '249') OR (ResolutionState = '250') OR (ResolutionState = '254') OR (ResolutionState = '255'))",
                    "displayColumns":
                    [
                        "severity","monitoringobjectdisplayname","name","age","repeatcount","lastModified"
                    ]
                }),
                success: function (result) {
                    for (var i = 0; i < result.rows.length; i++) {
            switch(result.rows[i].severity)
            {
                case "Error":
                    criticalCounter++;
                    break;
                case "Information":
                    informationCounter++;
                    break;
                case "Warning":
                                    warningCounter++
                    break;
            }
                    }
                    renderChart();
                }
            });
        }

        function renderChart() {
            var chart = new Highcharts.chart('container', {
    title: {
        text: 'Alerts representation in combination chart'
    },
    xAxis: {
        categories: ['Critical', 'Warning', 'Information']
    },
    labels: {
        items: [{
            html: 'Total alerts generated',
            style: {
                left: '50px',
                top: '0px',
                color: (Highcharts.theme && Highcharts.theme.textColor) || 'black'
            }
        }]
    },
    series: [{
        type: 'column',
        name: 'Critical',
        data: [criticalCounter, 0, 0]
    }, {
        type: 'column',
        name: 'Warning',
        data: [0, warningCounter, 0]
    }, {
        type: 'column',
        name: 'Information',
        data: [0, 0, informationCounter]
    }, {
        type: 'spline',
        name: 'Spline chart',
        data: [criticalCounter, warningCounter, informationCounter],
        marker: {
            lineWidth: 2,
            lineColor: Highcharts.getOptions().colors[3],
            fillColor: 'white'
        }
    }, {
        type: 'pie',
        name: 'Total consumption',
        data: [{
            name: 'Critical',
            y: criticalCounter,
            color: Highcharts.getOptions().colors[0] // Jane's color
        }, {
            name: 'Warning',
            y: warningCounter,
            color: Highcharts.getOptions().colors[1] // John's color
        }, {
            name: 'Information',
            y: informationCounter,
            color: Highcharts.getOptions().colors[2] // Joe's color
        }],
        center: [150, 100],
        size: 100,
        showInLegend: false,
        dataLabels: {
            enabled: false
        }
    }]
});


            chart.render();
        }
    </script>
    <script src="https://code.highcharts.com/highcharts.js"></script>
<script src="https://code.highcharts.com/modules/exporting.js"></script>

<div id="container" style="min-width: 310px; height: 400px; margin: 0 auto"></div>

</head>

<body>
    <div id="chartContainer" style="height: 400px; width: 100%;"></div>
</body>

</html>