What's new archive for in Microsoft Defender for IoT for organizations
Note
Azure Defender for IoT has been renamed to Microsoft Defender for IoT.
This article serves as an archive for features and enhancements released for Microsoft Defender for IoT for organizations more than nine months ago.
For more recent updates, see What's new in Microsoft Defender for IoT?.
Noted features listed below are in PREVIEW. The Azure Preview Supplemental Terms include other legal terms that apply to Azure features that are in beta, preview, or otherwise not yet released into general availability.
December 2021
Sensor software version: 10.5.4
Enhanced integration with Microsoft Sentinel (Preview)
The new IoT OT Threat Monitoring with Defender for IoT solution is available and provides enhanced capabilities for Microsoft Defender for IoT integration with Microsoft Sentinel. The IoT OT Threat Monitoring with Defender for IoT solution is a set of bundled content, including analytics rules, workbooks, and playbooks, configured specifically for Defender for IoT data. This solution currently supports only Operational Networks (OT/ICS).
For information on integrating with Microsoft Sentinel, see Tutorial: Integrate Defender for IoT and Sentinel
Apache Log4j vulnerability
Version 10.5.4 of Microsoft Defender for IoT mitigates the Apache Log4j vulnerability. For details, see the security advisory update.
Alerting
Version 10.5.4 of Microsoft Defender for IoT delivers important alert enhancements:
- Alerts for certain minor events or edge-cases are now disabled.
- For certain scenarios, similar alerts are minimized in a single alert message.
These changes reduce alert volume and enable more efficient targeting and analysis of security and operational events.
For more information, see OT monitoring alert types and descriptions.
Alerts permanently disabled
The alerts listed below are permanently disabled with version 10.5.4. Detection and monitoring are still supported for traffic associated with the alerts.
Policy engine alerts
- RPC Procedure Invocations
- Unauthorized HTTP Server
- Abnormal usage of MAC Addresses
Alerts disabled by default
The alerts listed below are disabled by default with version 10.5.4. You can re-enable the alerts from the Support page of the sensor console, if necessary.
Anomaly engine alert
- Abnormal Number of Parameters in HTTP Header
- Abnormal HTTP Header Length
- Illegal HTTP Header Content
Operational engine alerts
- HTTP Client Error
- RPC Operation Failed
Policy engine alerts
Disabling these alerts also disables monitoring of related traffic. Specifically, this traffic won't be reported in Data Mining reports.
- Illegal HTTP Communication alert and HTTP Connections Data Mining traffic
- Unauthorized HTTP User Agent alert and HTTP User Agents Data Mining traffic
- Unauthorized HTTP SOAP Action and HTTP SOAP Actions Data Mining traffic
Updated alert functionality
Unauthorized Database Operation alert Previously, this alert covered DDL and DML alerting and Data Mining reporting. Now:
- DDL traffic: alerting and monitoring are supported.
- DML traffic: Monitoring is supported. Alerting isn't supported.
New Asset Detected alert This alert is disabled for new devices detected in IT subnets. The New Asset Detected alert is still triggered for new devices discovered in OT subnets. OT subnets are detected automatically and can be updated by users if necessary.
Minimized alerting
Alert triggering for specific scenarios has been minimized to help reduce alert volume and simplify alert investigation. In these scenarios, if a device performs repeated activity on targets, an alert is triggered once. Previously, a new alert was triggered each time the same activity was carried out.
This new functionality is available on the following alerts:
- Port Scan Detected alerts, based on activity of the source device (generated by the Anomaly engine)
- Malware alerts, based on activity of the source device. (generated by the Malware engine).
- Suspicion of Denial of Service Attack alerts, based on activity of the destination device (generated by the Malware engine)
November 2021
Sensor software version: 10.5.3
The following feature enhancements are available with version 10.5.3 of Microsoft Defender for IoT.
The on-premises management console has a new API to support our ServiceNow integration. For more information, see Integration API reference for on-premises management consoles (Public preview).
Enhancements have been made to the network traffic analysis of multiple OT and ICS protocol dissectors.
As part of our automated maintenance, archived alerts that are over 90 days old will now be automatically deleted.
Many enhancements have been made to the exporting of alert metadata based on customer feedback.
October 2021
Sensor software version: 10.5.2
The following feature enhancements are available with version 10.5.2 of Microsoft Defender for IoT.
PLC operating mode detections (Public Preview)
Users can now view PLC operating mode states, changes, and risks. The PLC Operating mode consists of the PLC logical Run state and the physical Key state, if a physical key switch exists on the PLC.
This new capability helps improve security by detecting unsecure PLCs, and as a result prevents malicious attacks such as PLC Program Downloads. The 2017 Triton attack on a petrochemical plant illustrates the effects of such risks. This information also provides operational engineers with critical visibility into the operational mode of enterprise PLCs.
What is an unsecure mode?
If the Key state is detected as Program or the Run state is detected as either Remote or Program the PLC is defined by Defender for IoT as unsecure.
Visibility and risk assessment
Use the Device Inventory to view the PLC state of organizational PLCs, and contextual device information. Use the Device Inventory Settings dialog box to add this column to the Inventory.
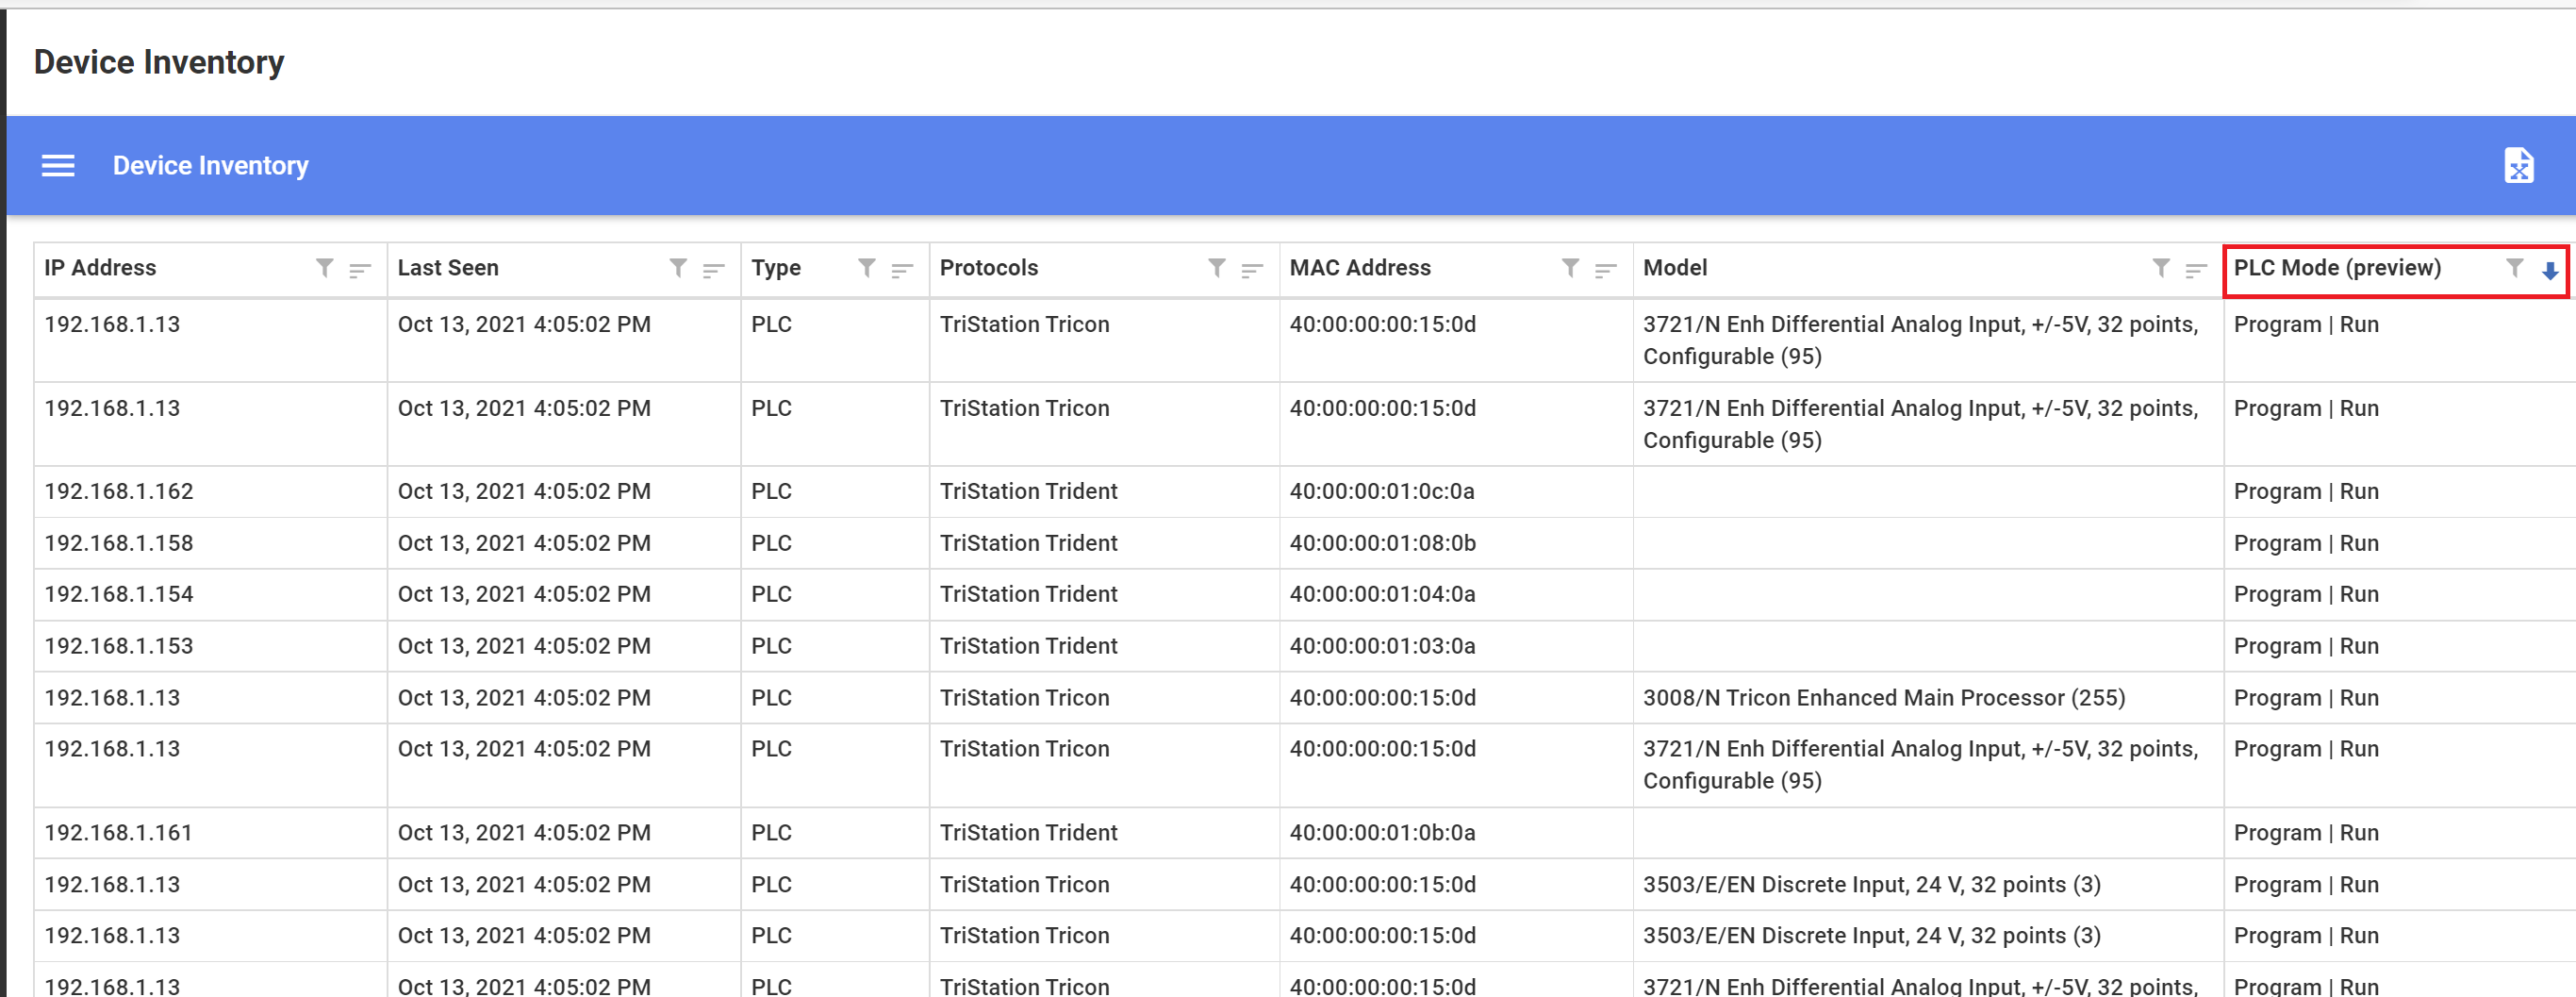
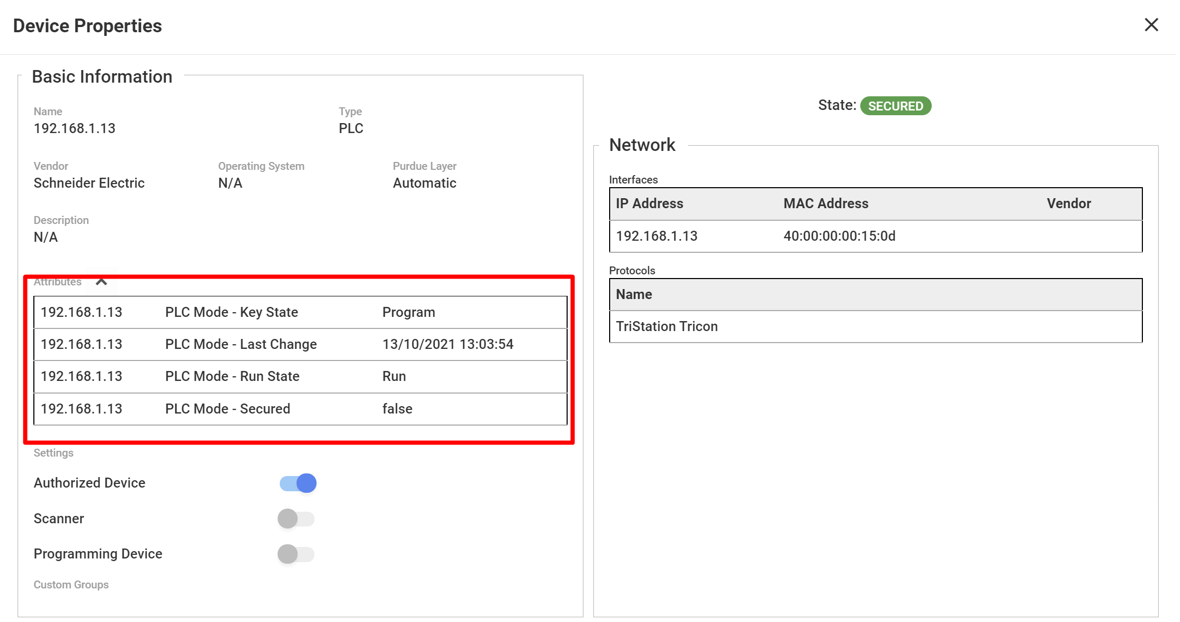
View PLC secure status and last change information per PLC in the Attributes section of the Device Properties screen. If the Key state is detected as Program or the Run state is detected as either Remote or Program the PLC is defined by Defender for IoT as unsecure. The Device Properties PLC Secured option will read false.
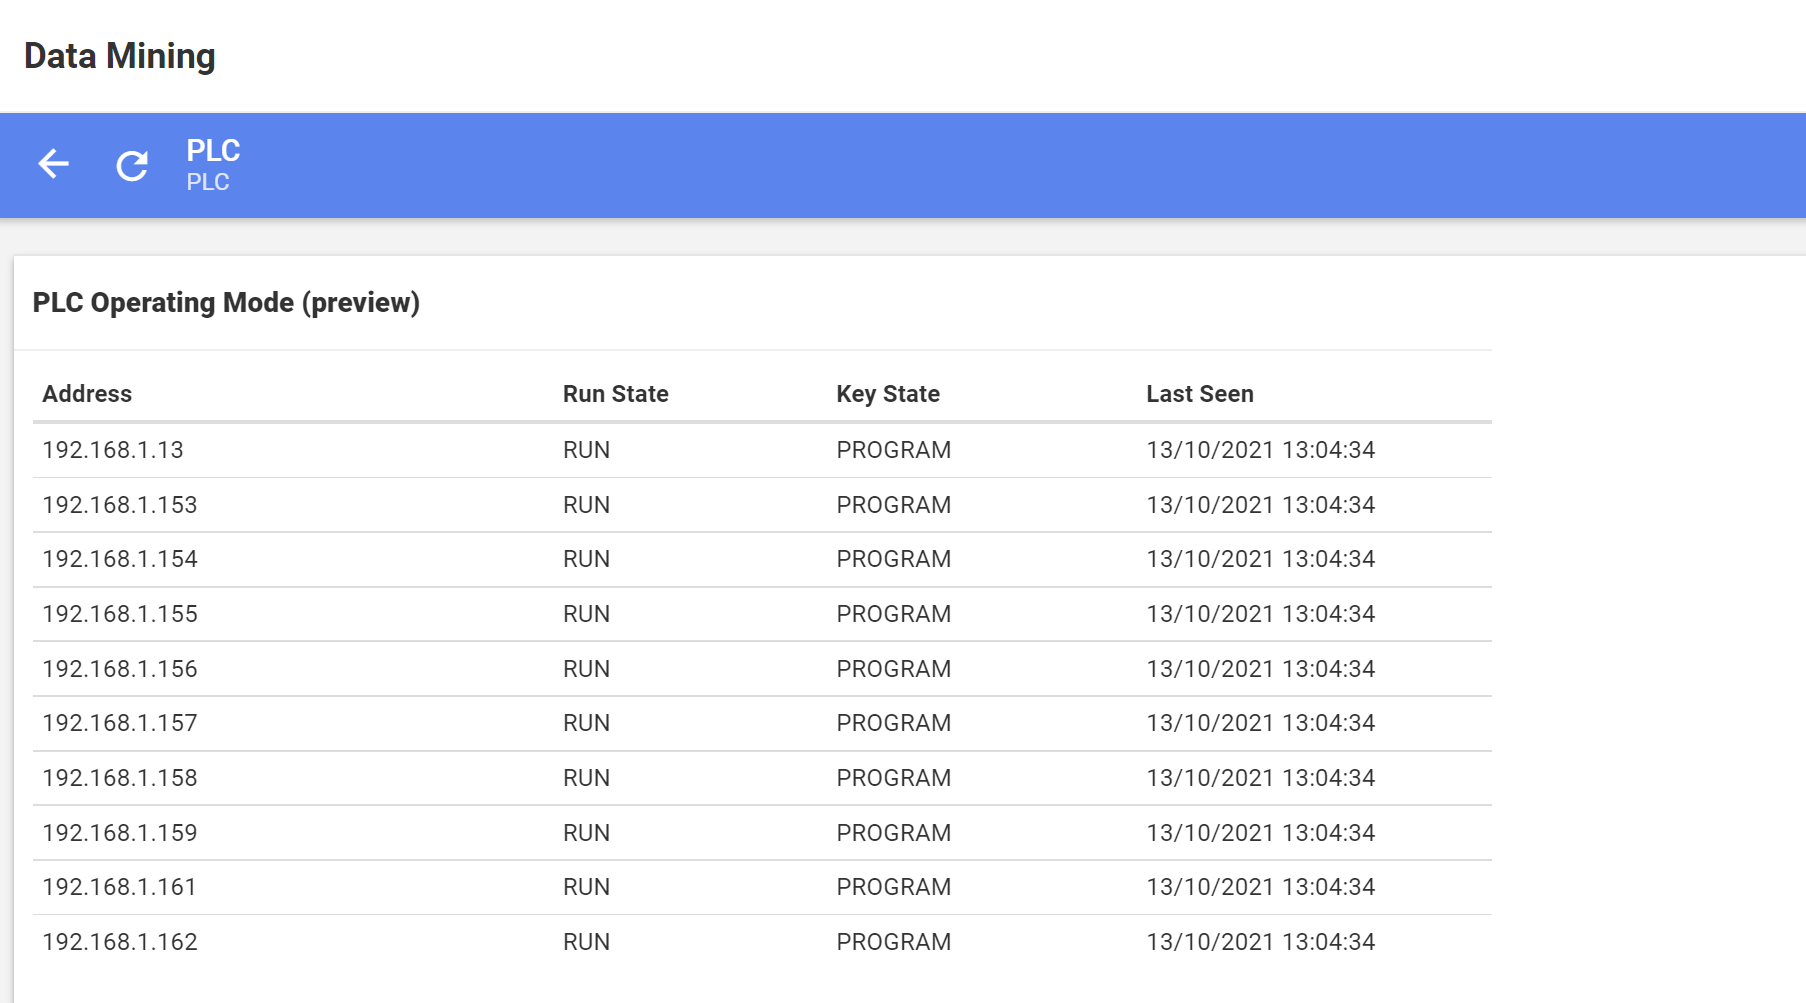
View all network PLC Run and Key State statuses by creating a Data Mining with PLC operating mode information.
Use the Risk Assessment Report to review the number of network PLCs in the unsecure mode, and additional information you can use to mitigate unsecure PLC risks.
PCAP API
The new PCAP API lets the user retrieve PCAP files from the sensor via the on-premises management console with, or without direct access to the sensor itself.
On-premises Management Console audit
Audit logs for the on-premises management console can now be exported to facilitate investigations into what changes were made, and by who.
Webhook extended
Webhook extended can be used to send extra data to the endpoint. The extended feature includes all of the information in the Webhook alert and adds the following information to the report:
- sensorID
- sensorName
- zoneID
- zoneName
- siteID
- siteName
- sourceDeviceAddress
- destinationDeviceAddress
- remediationSteps
- handled
- additionalInformation
Unicode support for certificate passphrases
Unicode characters are now supported when working with sensor certificate passphrases. For more information, see Prepare CA-signed certificates.
April 2021
Work with automatic threat Intelligence updates (Public Preview)
New threat intelligence packages can now be automatically pushed to cloud connected sensors as they're released by Microsoft Defender for IoT. This is in addition to downloading threat intelligence packages and then uploading them to sensors.
Working with automatic updates helps reduce operational efforts and ensure greater security. Enable automatic updating by onboarding your cloud connected sensor on the Defender for IoT portal with the Automatic Threat Intelligence Updates toggle turned on.
If you would like to take a more conservative approach to updating your threat intelligence data, you can manually push packages from the Microsoft Defender for IoT portal to cloud connected sensors only when you feel it's required. This gives you the ability to control when a package is installed, without the need to download and then upload it to your sensors. Manually push updates to sensors from the Defender for IoT Sites and Sensors page.
You can also review the following information about threat intelligence packages:
- Package version installed
- Threat intelligence update mode
- Threat intelligence update status
View cloud connected sensor information (Public Preview)
View important operational information about cloud connected sensors on the Sites and Sensors page.
- The sensor version installed
- The sensor connection status to the cloud.
- The last time the sensor was detected connecting to the cloud.
Alert API enhancements
New fields are available for users working with alert APIs.
On-premises management console
- Source and destination address
- Remediation steps
- The name of sensor defined by the user
- The name of zone associated with the sensor
- The name of site associated with the sensor
Sensor
- Source and destination address
- Remediation steps
API version 2 is required when working with the new fields.
Features delivered as Generally Available (GA)
The following features were previously available for Public Preview, and are now Generally Available (GA) features:
- Sensor - enhanced custom alert rules
- On-premises management console - export alerts
- Add second network interface to On-premises management console
- Device builder - new micro agent
March 2021
Sensor - enhanced custom alert rules (Public Preview)
You can now create custom alert rules based on the day, group of days and time-period network activity was detected. Working with day and time rule conditions is useful, for example in cases where alert severity is derived by the time the alert event takes place. For example, create a custom rule that triggers a high severity alert when network activity is detected on a weekend or in the evening.
This feature is available on the sensor with the release of version 10.2.
On-premises management console - export alerts (Public Preview)
Alert information can now be exported to a .csv file from the on-premises management console. You can export information of all alerts detected or export information based on the filtered view.
This feature is available on the on-premises management console with the release of version 10.2.
Add second network interface to On-premises management console (Public Preview)
You can now enhance the security of your deployment by adding a second network interface to your on-premises management console. This feature allows your on-premises management to have its connected sensors on one secure network, while allowing your users to access the on-premises management console through a second separate network interface.
This feature is available on the on-premises management console with the release of version 10.2.
January 2021
Security
Certificate and password recovery enhancements were made for this release.
Certificates
This version lets you:
- Upload TLS/SSL certificates directly to the sensors and on-premises management consoles.
- Perform validation between the on-premises management console and connected sensors, and between a management console and a High Availability management console. Validation is based on expiration dates, root CA authenticity, and Certificate Revocation Lists. If validation fails, the session won't continue.
For upgrades:
- There's no change in TLS/SSL certificate or validation functionality during the upgrade.
- After you update your sensors and on-premises management consoles, administrative users can replace TLS/SSL certificates, or activate TLS/SSL certificate validation from the System Settings, TLS/SSL Certificate window.
For Fresh Installations:
- During first-time sign-in, users are required to either use an TLS/SSL Certificate (recommended) or a locally generated self-signed certificate (not recommended)
- Certificate validation is turned on by default for fresh installations.
Password recovery
Sensor and on-premises management console Administrative users can now recover passwords from the Microsoft Defender for IoT portal. Previously password recovery required intervention by the support team.
Onboarding
On-premises management console - committed devices
Following initial sign-in to the on-premises management console, users are now required to upload an activation file. The file contains the aggregate number of devices to be monitored on the organizational network. This number is referred to as the number of committed devices. Committed devices are defined during the onboarding process on the Microsoft Defender for IoT portal, where the activation file is generated. First-time users and users upgrading are required to upload the activation file. After initial activation, the number of devices detected on the network might exceed the number of committed devices. This event might happen, for example, if you connect more sensors to the management console. If there's a discrepancy between the number of detected devices and the number of committed devices, a warning appears in the management console. If this event occurs, you should upload a new activation file.
Pricing page options
Pricing page lets you onboard new subscriptions to Microsoft Defender for IoT and define committed devices in your network.
Additionally, the Pricing page now lets you manage existing subscriptions associated with a sensor and update device commitment.
View and manage onboarded sensors
A new Site and Sensors portal page lets you:
- Add descriptive information about the sensor. For example, a zone associated with the sensor, or free-text tags.
- View and filter sensor information. For example, view details about sensors that are cloud connected or locally managed or view information about sensors in a specific zone.
Usability
Azure Sentinel new connector page
The Microsoft Defender for IoT data connector page in Azure Sentinel has been redesigned. The data connector is now based on subscriptions rather than IoT Hubs; allowing customers to better manage their configuration connection to Azure Sentinel.
Azure portal permission updates
Security Reader and Security Administrator support has been added.
Other updates
Access group - zone permissions
The on-premises management console Access Group rules won't include the option to grant access to a specific zone. There's no change in defining rules that use sites, regions, and business units. Following upgrade, Access Groups that contained rules allowing access to specific zones will be modified to allow access to its parent site, including all its zones.
Terminology changes
The term asset has been renamed device in the sensor and on-premises management console, reports, and other solution interfaces. In sensor and on-premises management console Alerts, the term Manage this Event has been named Remediation Steps.
Next steps
Atsiliepimai
Jau greitai: 2024 m. palaipsniui atsisakysime „GitHub“ problemų, kaip turiniui taikomo atsiliepimų mechanizmo, ir pakeisime jį nauja atsiliepimų sistema. Daugiau informacijos žr. https://aka.ms/ContentUserFeedback.
Pateikti ir peržiūrėti atsiliepimą, skirtą