STEP 3: Verify client connectivity to Microsoft Defender for Endpoint service URLs
Applies to:
- Microsoft Defender for Endpoint Plan 1
- Microsoft Defender for Endpoint Plan 2
- Microsoft Defender XDR
Want to experience Defender for Endpoint? Sign up for a free trial.
Check that clients are able to connect to the Defender for Endpoint service URLs using the Defender for Endpoint Client Analyzer to ensure that endpoints are able to communicate telemetry to the service.
For more information on the Defender for Endpoint Client Analyzer, see Troubleshoot sensor health using Microsoft Defender for Endpoint Client Analyzer.
Note
You can run the Defender for Endpoint Client Analyzer on devices prior to onboarding and after onboarding.
- When testing on a device onboarded to Defender for Endpoint, the tool will use the onboarding parameters.
- When testing on a device not yet onboarded to Defender for Endpoint, the tool will use the defaults of US, UK, and EU.
For the consolidated service URLs provided by streamlined connectivity (default for new tenants), when testing devices not yet onboarded to Defender for Endpoint, runmdeclientanalyzer.cmdwith-o <path to MDE onboarding package >. The command will use geo parameters from the onboarding script to test connectivity. Otherwise, the default pre-onboarding test runs against the standard URL set. See the following section for more details.
Verify that the proxy configuration is completed successfully. The WinHTTP can then discover and communicate through the proxy server in your environment, and then the proxy server allows traffic to the Defender for Endpoint service URLs.
Download the Microsoft Defender for Endpoint Client Analyzer tool where Defender for Endpoint sensor is running on.
Extract the contents of MDEClientAnalyzer.zip on the device.
Open an elevated command line:
- Go to Start and type cmd.
- Right-click Command prompt and select Run as administrator.
Enter the following command and press Enter:
HardDrivePath\MDEClientAnalyzer.cmdReplace HardDrivePath with the path, where the MDEClientAnalyzer tool was downloaded. For example:
C:\Work\tools\MDEClientAnalyzer\MDEClientAnalyzer.cmdThe tool creates and extracts the MDEClientAnalyzerResult.zip file in the folder to use in the HardDrivePath.
Open MDEClientAnalyzerResult.txt and verify that you've performed the proxy configuration steps to enable server discovery and access to the service URLs.
The tool checks the connectivity of Defender for Endpoint service URLs. Ensure the Defender for Endpoint client is configured to interact. The tool prints the results in the MDEClientAnalyzerResult.txt file for each URL that can potentially be used to communicate with the Defender for Endpoint services. For example:
Testing URL : https://xxx.microsoft.com/xxx
1 - Default proxy: Succeeded (200)
2 - Proxy auto discovery (WPAD): Succeeded (200)
3 - Proxy disabled: Succeeded (200)
4 - Named proxy: Doesn't exist
5 - Command line proxy: Doesn't exist
If any one of the connectivity options returns a (200) status, then the Defender for Endpoint client can communicate with the tested URL properly using this connectivity method.
However, if the connectivity check results indicate a failure, an HTTP error is displayed (see HTTP Status Codes). You can then use the URLs in the table shown in Enable access to Defender for Endpoint service URLs in the proxy server. The URLs available for use depend on the region selected during the onboarding procedure.
Note
The Connectivity Analyzer tool's cloud connectivity checks are not compatible with Attack Surface Reduction rule Block process creations originating from PSExec and WMI commands. You will need to temporarily disable this rule, to run the connectivity tool. Alternatively, you can temporarily add ASR exclusions when running the analyzer.
When the TelemetryProxyServer is set in Registry or via Group Policy, Defender for Endpoint will fall back, it fails to access the defined proxy.
Testing connectivity to the streamlined onboarding method
If you're testing connectivity on a device that hasn't yet been onboarded to Defender for Endpoint using the streamlined approach (relevant for both new and migrating devices):
Download the streamlined onboarding package for relevant OS.
Extract the .cmd from onboarding package.
Follow the instructions in the previous section to download the Client Analyzer.
Run
mdeclientanalyzer.cmd -o <path to onboarding cmd file>from within the MDEClientAnalyzer folder. The command uses geo parameters from the onboarding script to test connectivity.
If you're testing connectivity on a device onboarded to Defender for Endpoint using the streamlined onboarding package, run the Defender for Endpoint Client Analyzer as normal. The tool uses the configured onboarding parameters to test connectivity.
For more info on how to access streamlined onboarding script, see Onboarding devices using streamlined device connectivity.
Microsoft Monitoring Agent (MMA) Service URL connections
See the following guidance to eliminate the wildcard (*) requirement for your specific environment when using the Microsoft Monitoring Agent (MMA) for previous versions of Windows.
Onboard a previous operating system with the Microsoft Monitoring Agent (MMA) into Defender for Endpoint (for more information, see Onboard previous versions of Windows on Defender for Endpoint and Onboard Windows servers).
Ensure the machine is successfully reporting into the Microsoft Defender portal.
Run the TestCloudConnection.exe tool from
C:\Program Files\Microsoft Monitoring Agent\Agentto validate the connectivity, and to get the required URLs for your specific workspace.Check the Microsoft Defender for Endpoint URLs list for the complete list of requirements for your region (refer to the Service URLs Spreadsheet).
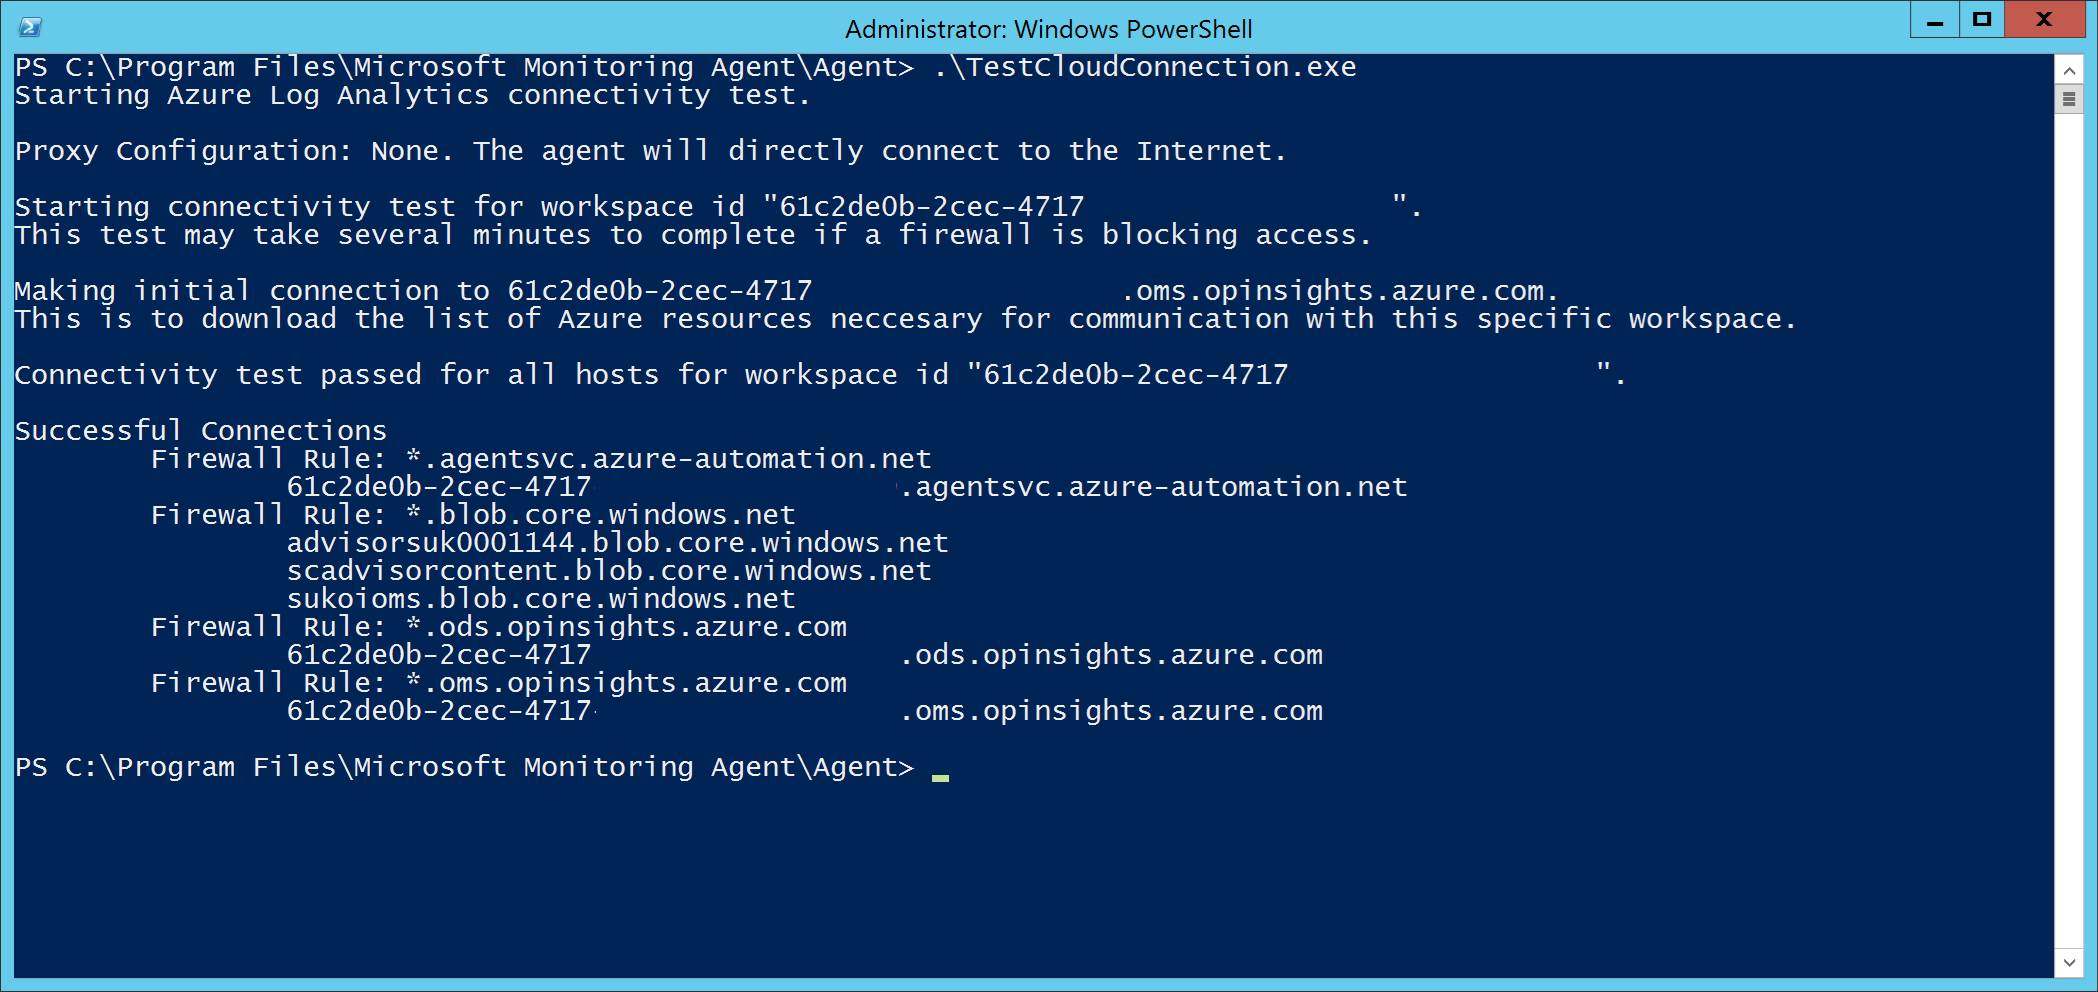
The wildcards (*) used in *.ods.opinsights.azure.com, *.oms.opinsights.azure.com, and *.agentsvc.azure-automation.net URL endpoints can be replaced with your specific Workspace ID. The Workspace ID is specific to your environment and workspace. It can be found in the Onboarding section of your tenant within the Microsoft Defender portal.
The *.blob.core.windows.net URL endpoint can be replaced with the URLs shown in the "Firewall Rule: *.blob.core.windows.net" section of the test results.
Note
In the case of onboarding via Microsoft Defender for Cloud, multiple workspaces can be used. You will need to perform the TestCloudConnection.exe procedure on the onboarded machine from each workspace (to determine, if there are any changes to the *.blob.core.windows.net URLs between the workspaces).
Next step
Onboard Windows Client Onboard Windows Server Onboard non-Windows devices
Atsauksmes
Drīzumā: 2024. gada laikā mēs pakāpeniski pārtrauksim izmantot “GitHub problēmas” kā atsauksmju par saturu mehānismu un aizstāsim to ar jaunu atsauksmju sistēmu. Papildinformāciju skatiet: https://aka.ms/ContentUserFeedback.
Iesniegt un skatīt atsauksmes par