Get started debugging JavaScript
This article teaches you the basic workflow for debugging any JavaScript issue using DevTools.
Step 1: Reproduce the bug
The first step in debugging is to find a sequence of actions that consistently reproduce a bug.
Open the demo webpage Get Started Debugging JavaScript in a new window or tab. To open the webpage, right-click the link and select "Open link in new tab" or "Open link in new Window" on the popup window. Alternatively you can press and hold Ctrl (for Windows, Linux) or Command (for macOS), and then click the link.
Tip: Open Microsoft Edge in InPrivate Mode, to ensure that Microsoft Edge runs in a clean state. For more information, see Browse InPrivate in Microsoft Edge
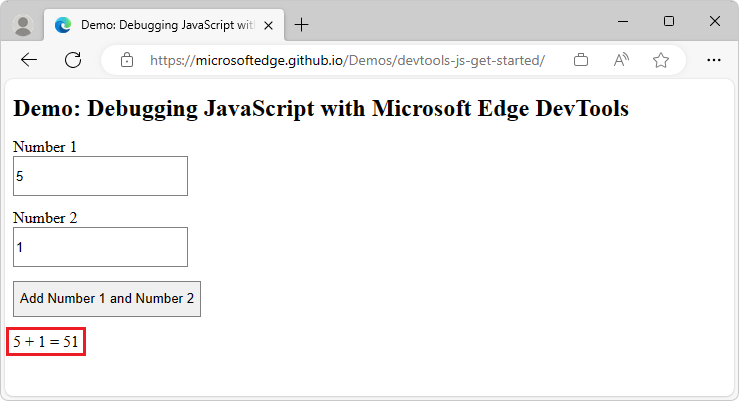
Enter 5 in the Number 1 text box.
Enter 1 in the Number 2 text box.
Click Add Number 1 and Number 2. The label below the button says 5 + 1 = 51, instead of the expected result of 6:
Step 2: Get familiar with the Sources tool UI
DevTools provides several tools for different tasks. These tasks include changing CSS, profiling page-load performance, and monitoring network requests. The Sources tool is where you debug JavaScript.
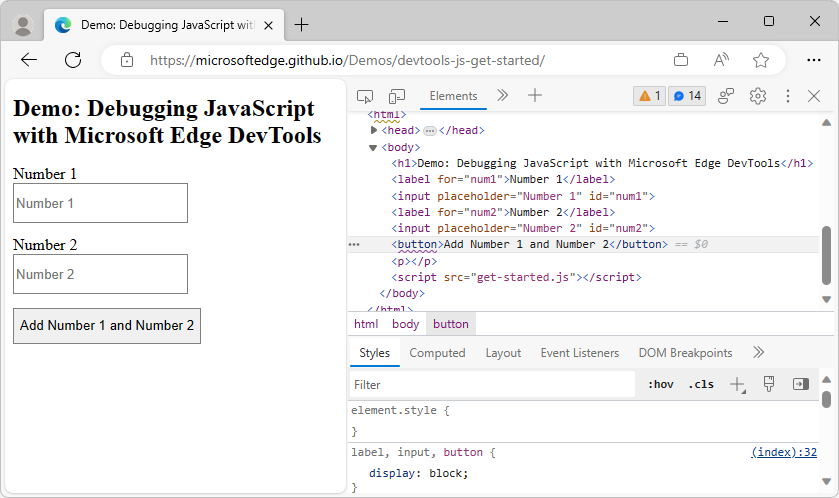
To open DevTools, right-click the webpage, and then select Inspect. Or, press Ctrl+Shift+I (Windows, Linux) or Command+Option+I (macOS). DevTools opens:
Select the Sources tool. Select the Page tab, and then select the JavaScript file,
get-started.js: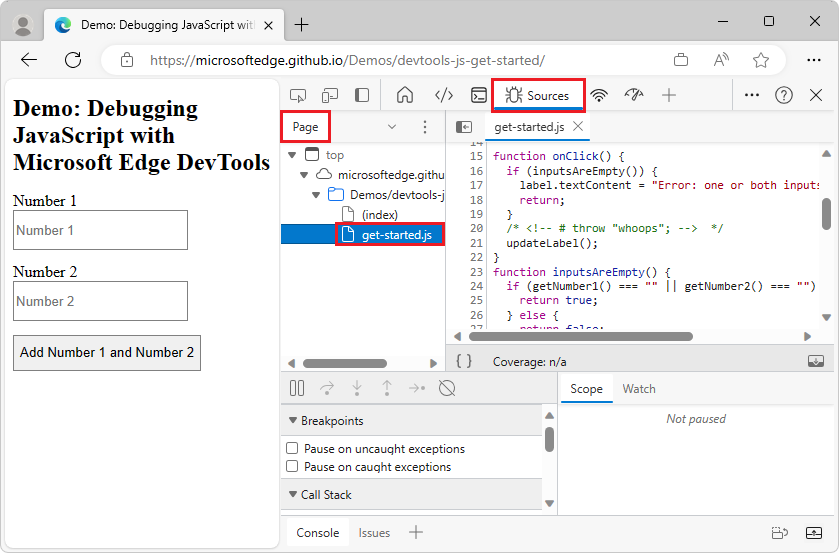
The Sources tool UI has three parts:
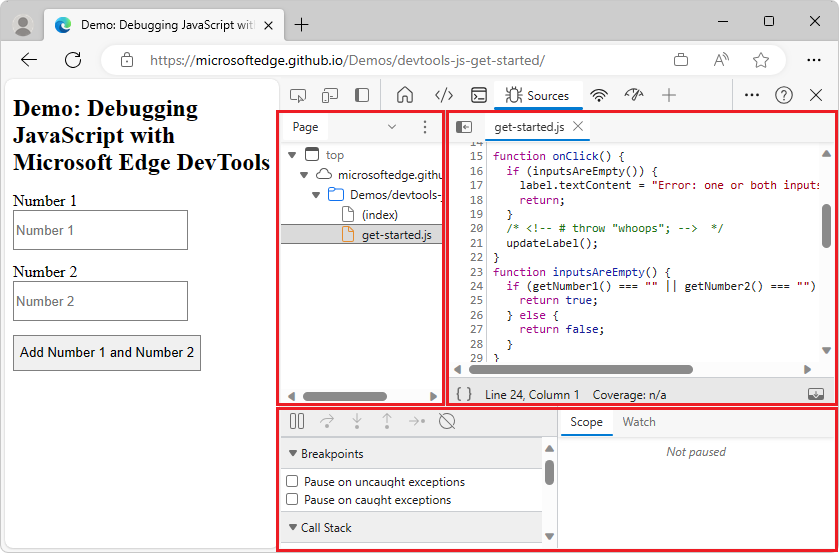
The Navigator pane (in the upper left corner). Every file that the webpage requests is listed here.
The Editor pane (in the upper right corner). After you select a file in the Navigator pane, this pane displays the contents of the file.
The Debugger pane (at the bottom). This pane provides tools for inspecting the JavaScript for the webpage. If your DevTools window is wide, this pane is displayed to the right of the Editor pane.
Step 3: Pause the code with a breakpoint
A common method for debugging this type of problem is to insert several console.log() statements into the code and then to inspect values as the script runs. For example:
function updateLabel() {
    var addend1 = getNumber1();
    console.log('addend1:', addend1);
    var addend2 = getNumber2();
    console.log('addend2:', addend2);
    var sum = addend1 + addend2;
    console.log('sum:', sum);
    label.textContent = addend1 + ' + ' + addend2 + ' = ' + sum;
}
The console.log() method might get the job done, but breakpoints get it done faster. A breakpoint allows you to pause your code in the middle of the runtime, and examine all values at that moment in time. Breakpoints have the following advantages over the console.log() method.
With
console.log(), you need to manually open the source code, find the relevant code, insert theconsole.log()statements, and then refresh the webpage to display the messages in the Console. With breakpoints, you can pause on the relevant code without having to know how the code is structured.In your
console.log()statements, you need to explicitly specify each value that you want to inspect. With breakpoints, DevTools shows you the values of all variables at that moment in time. Sometimes variables that affect your code are hidden and obfuscated.
In short, breakpoints can help you find and fix bugs faster than the console.log() method.
Event listener breakpoints
If you step back and think about how the app works, you might make an educated guess that the incorrect sum (5 + 1 = 51) is computed in the click event listener associated with the Add Number 1 and Number 2 button. So, you probably want to pause the code around the time that the click listener runs. Event Listener Breakpoints let you do that:
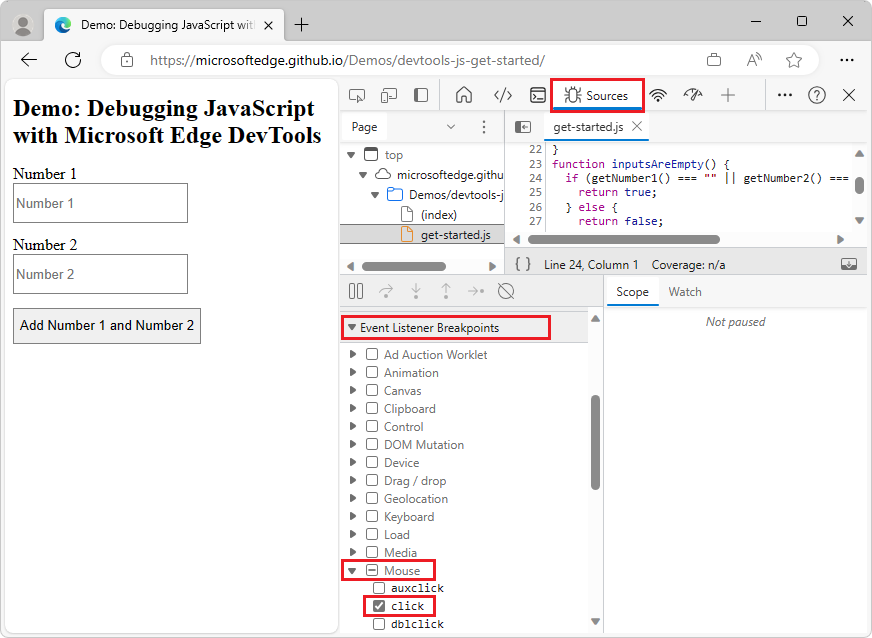
In the Navigator pane,
(index)is selected by default. Clickget-started.js.In the Debugger pane, click Event Listener Breakpoints to expand the section. DevTools reveals a list of event categories, such as Animation and Clipboard.
Click Expand (
 ) by the Mouse event open that category. DevTools reveals a list of mouse events, such as click and mousedown. Each event has a checkbox next to it.
Select the checkbox next to click:
DevTools is now set up to automatically pause when any
clickevent listener runs.In the rendered demo webpage, click the Add Number 1 and Number 2 button again. DevTools pauses the demo and highlights a line of code in the Sources tool. DevTools pauses on line 16 in
get-started.js, shown in the next code snippet:if (inputsAreEmpty()) {If you pause on a different line of code, click Resume Script Execution (
 ) until you pause on the correct line.
Note
If you paused on a different line, you have a browser extension that registers a
clickevent listener on every webpage that you visit. You are paused in theclicklistener of the extension. If you use InPrivate Mode to browse in private, which disables all extensions, you might see that you pause on the desired line of code every time.
Event Listener Breakpoints are just one of many types of breakpoints available in DevTools. Memorize all the different types to help you debug different scenarios as quickly as possible. To learn when and how to use each type, see Pause your code with breakpoints.
Step 4: Step through the code
One common cause of bugs is when a script runs in the wrong order. Stepping through your code allows you to walk through the runtime of your code. You walk through one line at a time to help you figure out exactly where your code is running in a different order than you expect. Try it now:
Click Step over next function call (
 ). DevTools runs the following code without stepping into it:
if (inputsAreEmpty()) {DevTools skips a few lines of code, because
inputsAreEmpty()evaluates asfalse, so the block of code for theifstatement doesn't run.On the Sources tool of DevTools, click Step into next function call (
 ) to step through the runtime of the
 updateLabel()function, one line at a time.
That's the basic idea of stepping through code. If you look at the code in get-started.js, you can see that the bug is probably somewhere in the updateLabel() function. Rather than stepping through every line of code, you can use another type of breakpoint (a line-of-code breakpoint) to pause the code closer to the probable location of the bug.
Step 5: Set a line-of-code breakpoint
Line-of-code breakpoints are the most common type of breakpoint. When you get to the specific line of code you want to pause, use a line-of-code breakpoint.
Look at the last line of code in
updateLabel():label.textContent = addend1 + ' + ' + addend2 + ' = ' + sum;The line number for
label.textContent = addend1 + ' + ' + addend2 + ' = ' + sum;is 34. Click line 34. DevTools displays a red circle to the left of 34. The red circle indicates that a line-of-code breakpoint is on this line. DevTools always pauses before this line of code is run.Click the Resume script execution (
) button: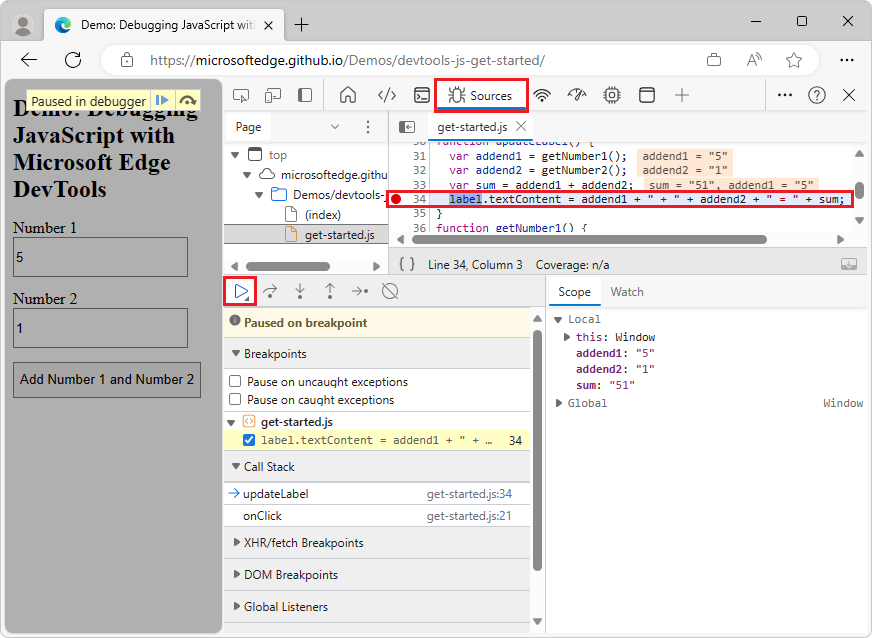
The script continues to run until it reaches line 34. On lines 31, 32, and 33, DevTools prints the values of each variable to the right of the semi-colon on each line. These values are:
addend1= "5"addend2= "1"sum= "51"
Step 6: Check variable values
The values of addend1, addend2, and sum look suspicious. These values are wrapped in quotes, which means each value is a string. This is a good clue to the cause of the bug. The next step is to gather more information about these variable values. DevTools provides various ways to examine variable values.
Examining variable values in the Scope pane
If you pause on a line of code, the Scope pane displays the local and global variables that are currently defined, along with the value of each variable:
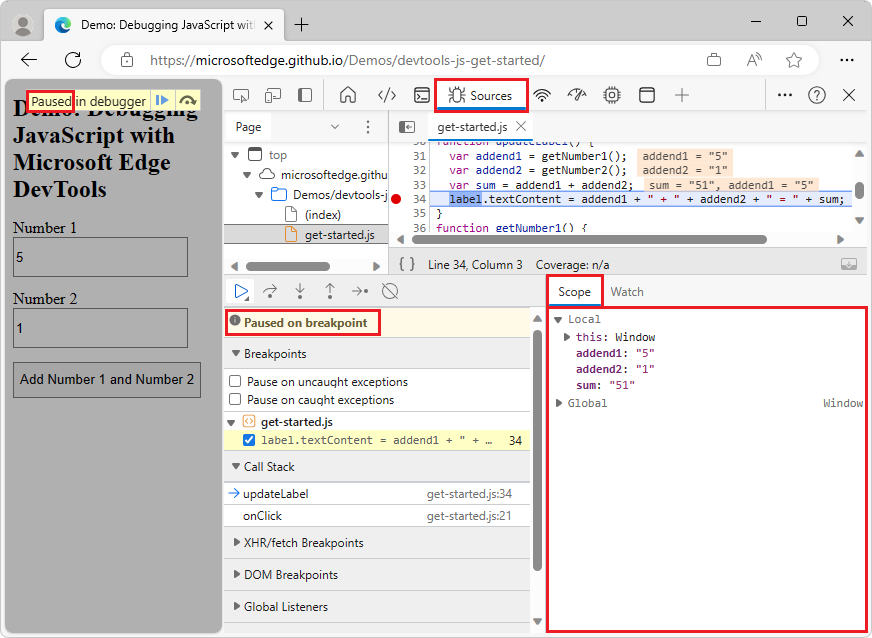
The Scope pane also displays closure variables, as applicable. If you want to edit a variable value, double-click the value in the Scope pane. If you don't pause on a line of code, the Scope pane is empty.
Examining variable values via Watch expressions
The Watch pane allows you to monitor the values of variables (such as sum) or expressions (such as typeof sum). You can store any valid JavaScript expression in a watch expression.
Select the Watch tab.
Click Add watch expression (
 ).
).Type the watch expression
typeof sum, and then press Enter:

The Watch pane displays typeof sum: "string". The value to the right of the colon is the result of the watch expression. The bug is due to sum being evaluated as a string, when it should be a number.
If your DevTools window is wide, the Watch pane is displayed within the Debugger pane, which then appears on the right.
Examining variable values via the Console
The Console allows you to view console.log() output. You can also use the Console to evaluate arbitrary JavaScript statements while the debugger is paused at a code statement. For debugging, you can use the Console to test potential fixes for bugs.
If the Console tool is closed, press Esc to open it. The Console tool opens in the lower pane of the DevTools window.
In the Console, type the expression
parseInt(addend1) + parseInt(addend2). The expression is evaluated for the current scope, given that the debugger is paused on a line of code whereaddend1andaddend2are in scope.Press Enter. DevTools evaluates the statement and prints
6in the Console, which is the correct result you expect the demo to produce: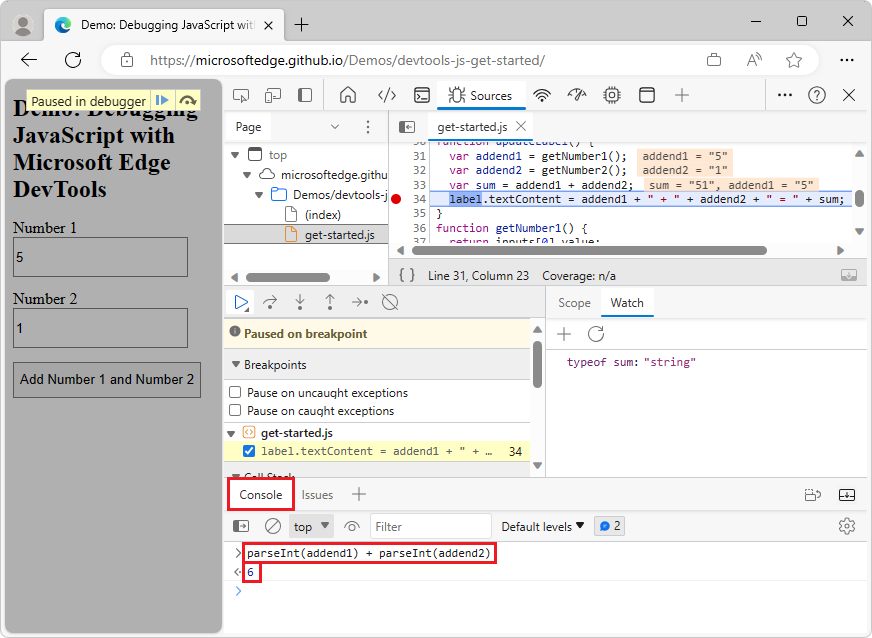
Step 7: Apply a fix to the returned code and then to your actual source code
We've identified a possible fix for the bug. Next, edit the JavaScript code directly within the DevTools UI and then rerun the demo to test the fix, as follows:
Click Resume script execution (
).In the Editor pane, replace the line
var sum = addend1 + addend2withvar sum = parseInt(addend1) + parseInt(addend2).Press Ctrl+S (Windows, Linux) or Command+S (macOS) to save your change.
Click Deactivate breakpoints (
 ). The breakpoint's icon changes to gray to indicate that the breakpoint is inactive. While Deactivate breakpoints is set, DevTools ignores any breakpoints you set. The demo webpage now displays the correct value:
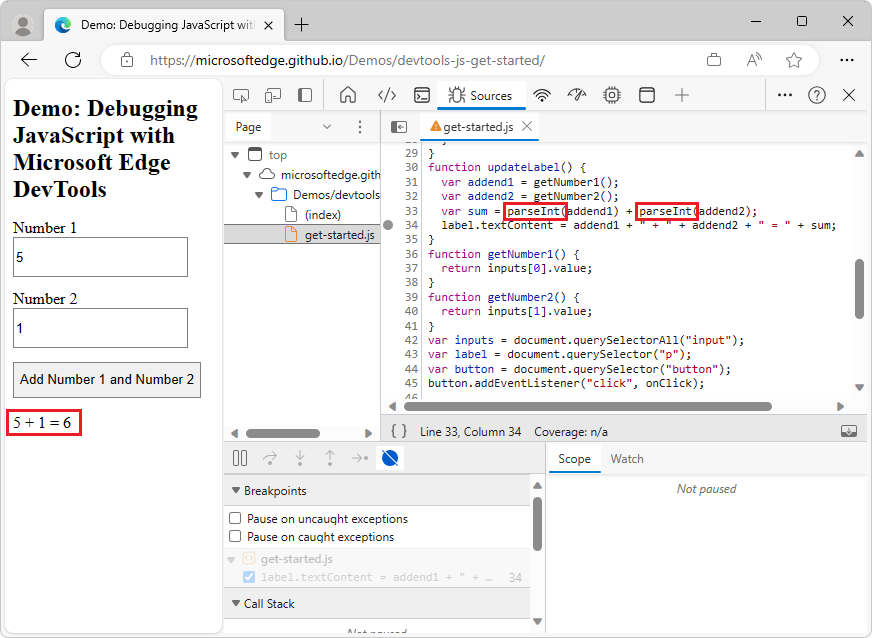
Try out the demo with different values. The demo now calculates correctly.
When debugging your own project, after you identify the fix, you then fix your actual source code on the server, such as by editing your local source code and then re-deploying your fixed code to the server. The previous steps only apply a fix to a temporary local copy of the code that's sent from the server.
Next steps
Congratulations! You now know how to make the most of Microsoft Edge DevTools when debugging JavaScript. The tools and methods you learned in this article may save you countless hours.
This article showed two ways to set breakpoints. DevTools also provides ways to set breakpoints to pause your code when certain conditions are met, such as:
- Conditional breakpoints that are only triggered when the condition that you provide is true.
- Breakpoints on caught or uncaught exceptions.
- XHR breakpoints that are triggered when the requested URL matches a substring that you provide.
For more information about when and how to use each type of breakpoint, see Pause your code with breakpoints.
For more information about the debugger buttons for stepping through code, see Step over line of code in "JavaScript debugging features".
See also
- JavaScript debugging features - Using the UI of the debugger in the Sources tool.
- Sources tool overview - Introduces the JavaScript debugger and code editor.
Note
Portions of this page are modifications based on work created and shared by Google and used according to terms described in the Creative Commons Attribution 4.0 International License. The original page is found here and is authored by Kayce Basques (Technical Writer, Chrome DevTools & Lighthouse).
![]() This work is licensed under a Creative Commons Attribution 4.0 International License.
This work is licensed under a Creative Commons Attribution 4.0 International License.
Feedback
Coming soon: Throughout 2024 we will be phasing out GitHub Issues as the feedback mechanism for content and replacing it with a new feedback system. For more information see: https://aka.ms/ContentUserFeedback.
Submit and view feedback for