What's New in DevTools (Microsoft Edge 83)
Following the updated Chromium schedule, we are adjusting our schedule for upcoming Microsoft Edge releases and cancelling the Microsoft Edge 82 release. Check out our blog post for more info.
To check out the latest features of Microsoft Edge DevTools and the Microsoft Edge DevTools extension for Microsoft Visual Studio Code and Visual Studio, read these announcements.
To stay up to date and get the latest DevTools features, download an Insiders preview version of Microsoft Edge. Whether you're on Windows, Linux, or macOS, consider using Canary (or another preview channel) as your default development browser. The Beta, Dev, and Canary versions of Microsoft Edge run as separate apps, side-by-side with the stable, released version of Microsoft Edge. See Microsoft Edge Insider Channels.
For the latest announcements, follow the Microsoft Edge team on Twitter. To report a problem with DevTools or ask for a new feature, file an issue in the MicrosoftEdge/DevTools repo.
Announcements from the Microsoft Edge DevTools team
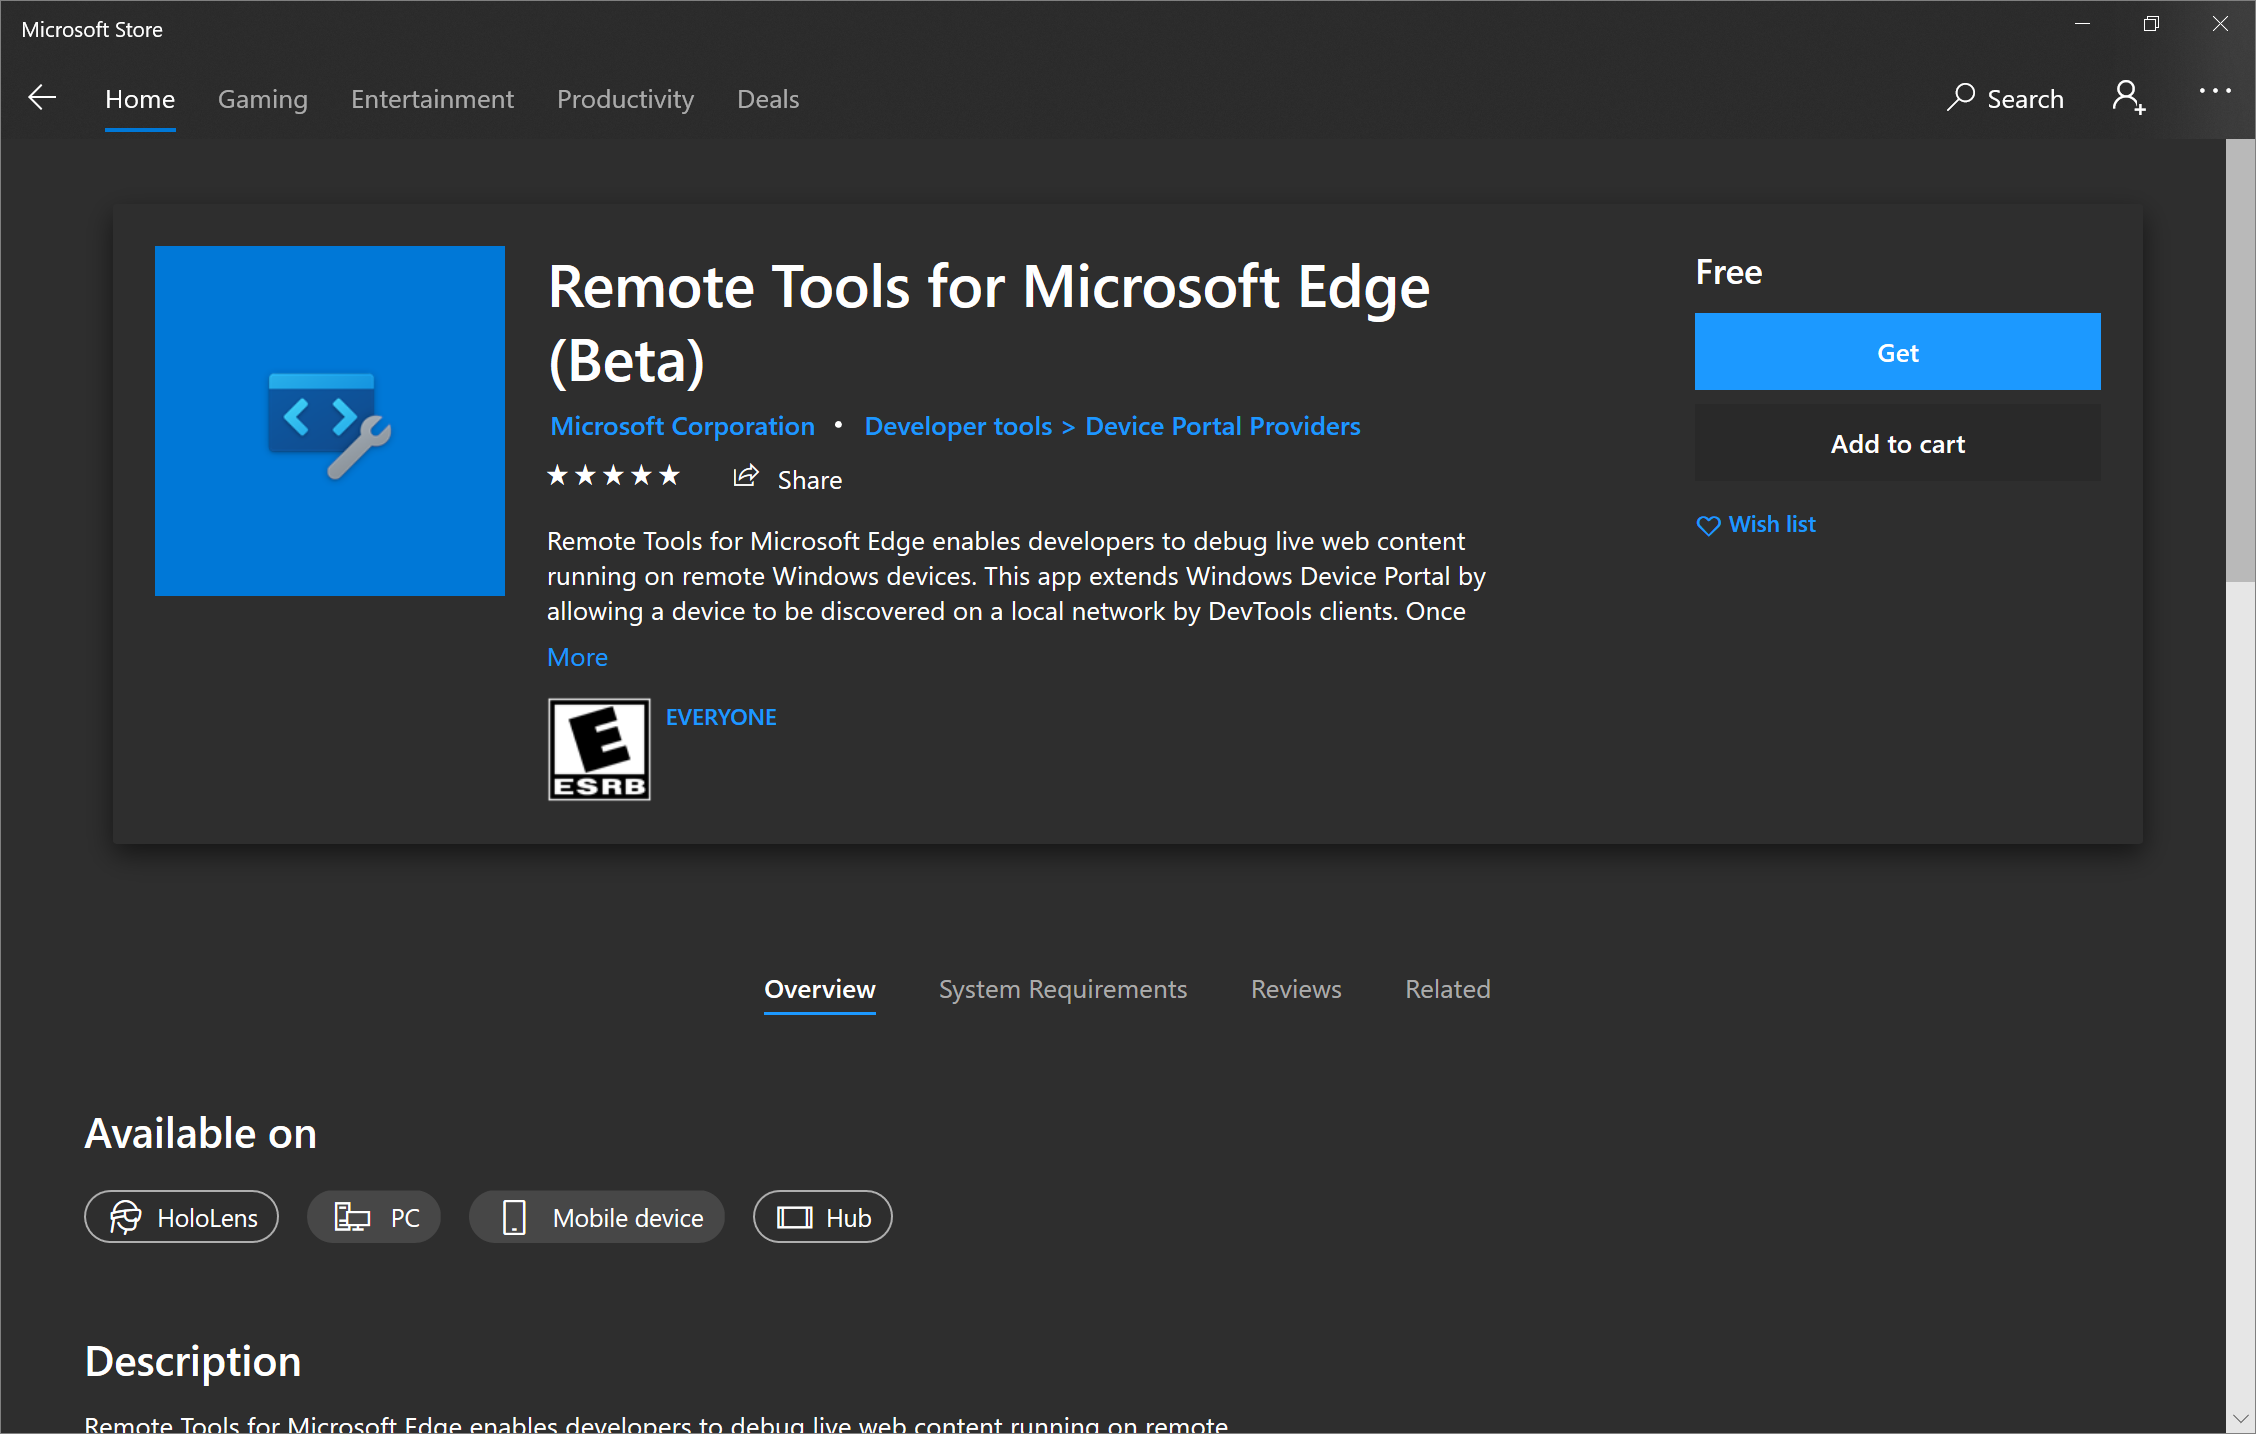
Remotely debug Microsoft Edge on Windows 10 or later Devices
The Remote Tools for Microsoft Edge (Beta) app is now available in the Microsoft Store. This app extends the Windows Device Portal. You can connect from Microsoft Edge running on your development machine to a remote Windows 10 or later device and display a list of targets. This list of targets includes all tabs in Microsoft Edge and PWAs open on the Windows device. Use DevTools on your development machine against a target running on the remote Windows device.
Read our guide for setting up your Windows 10 device and your development machine for remote debugging: Remotely debug Windows devices.
Let us know about your remote debugging experience by tweeting or clicking the Send Feedback icon.
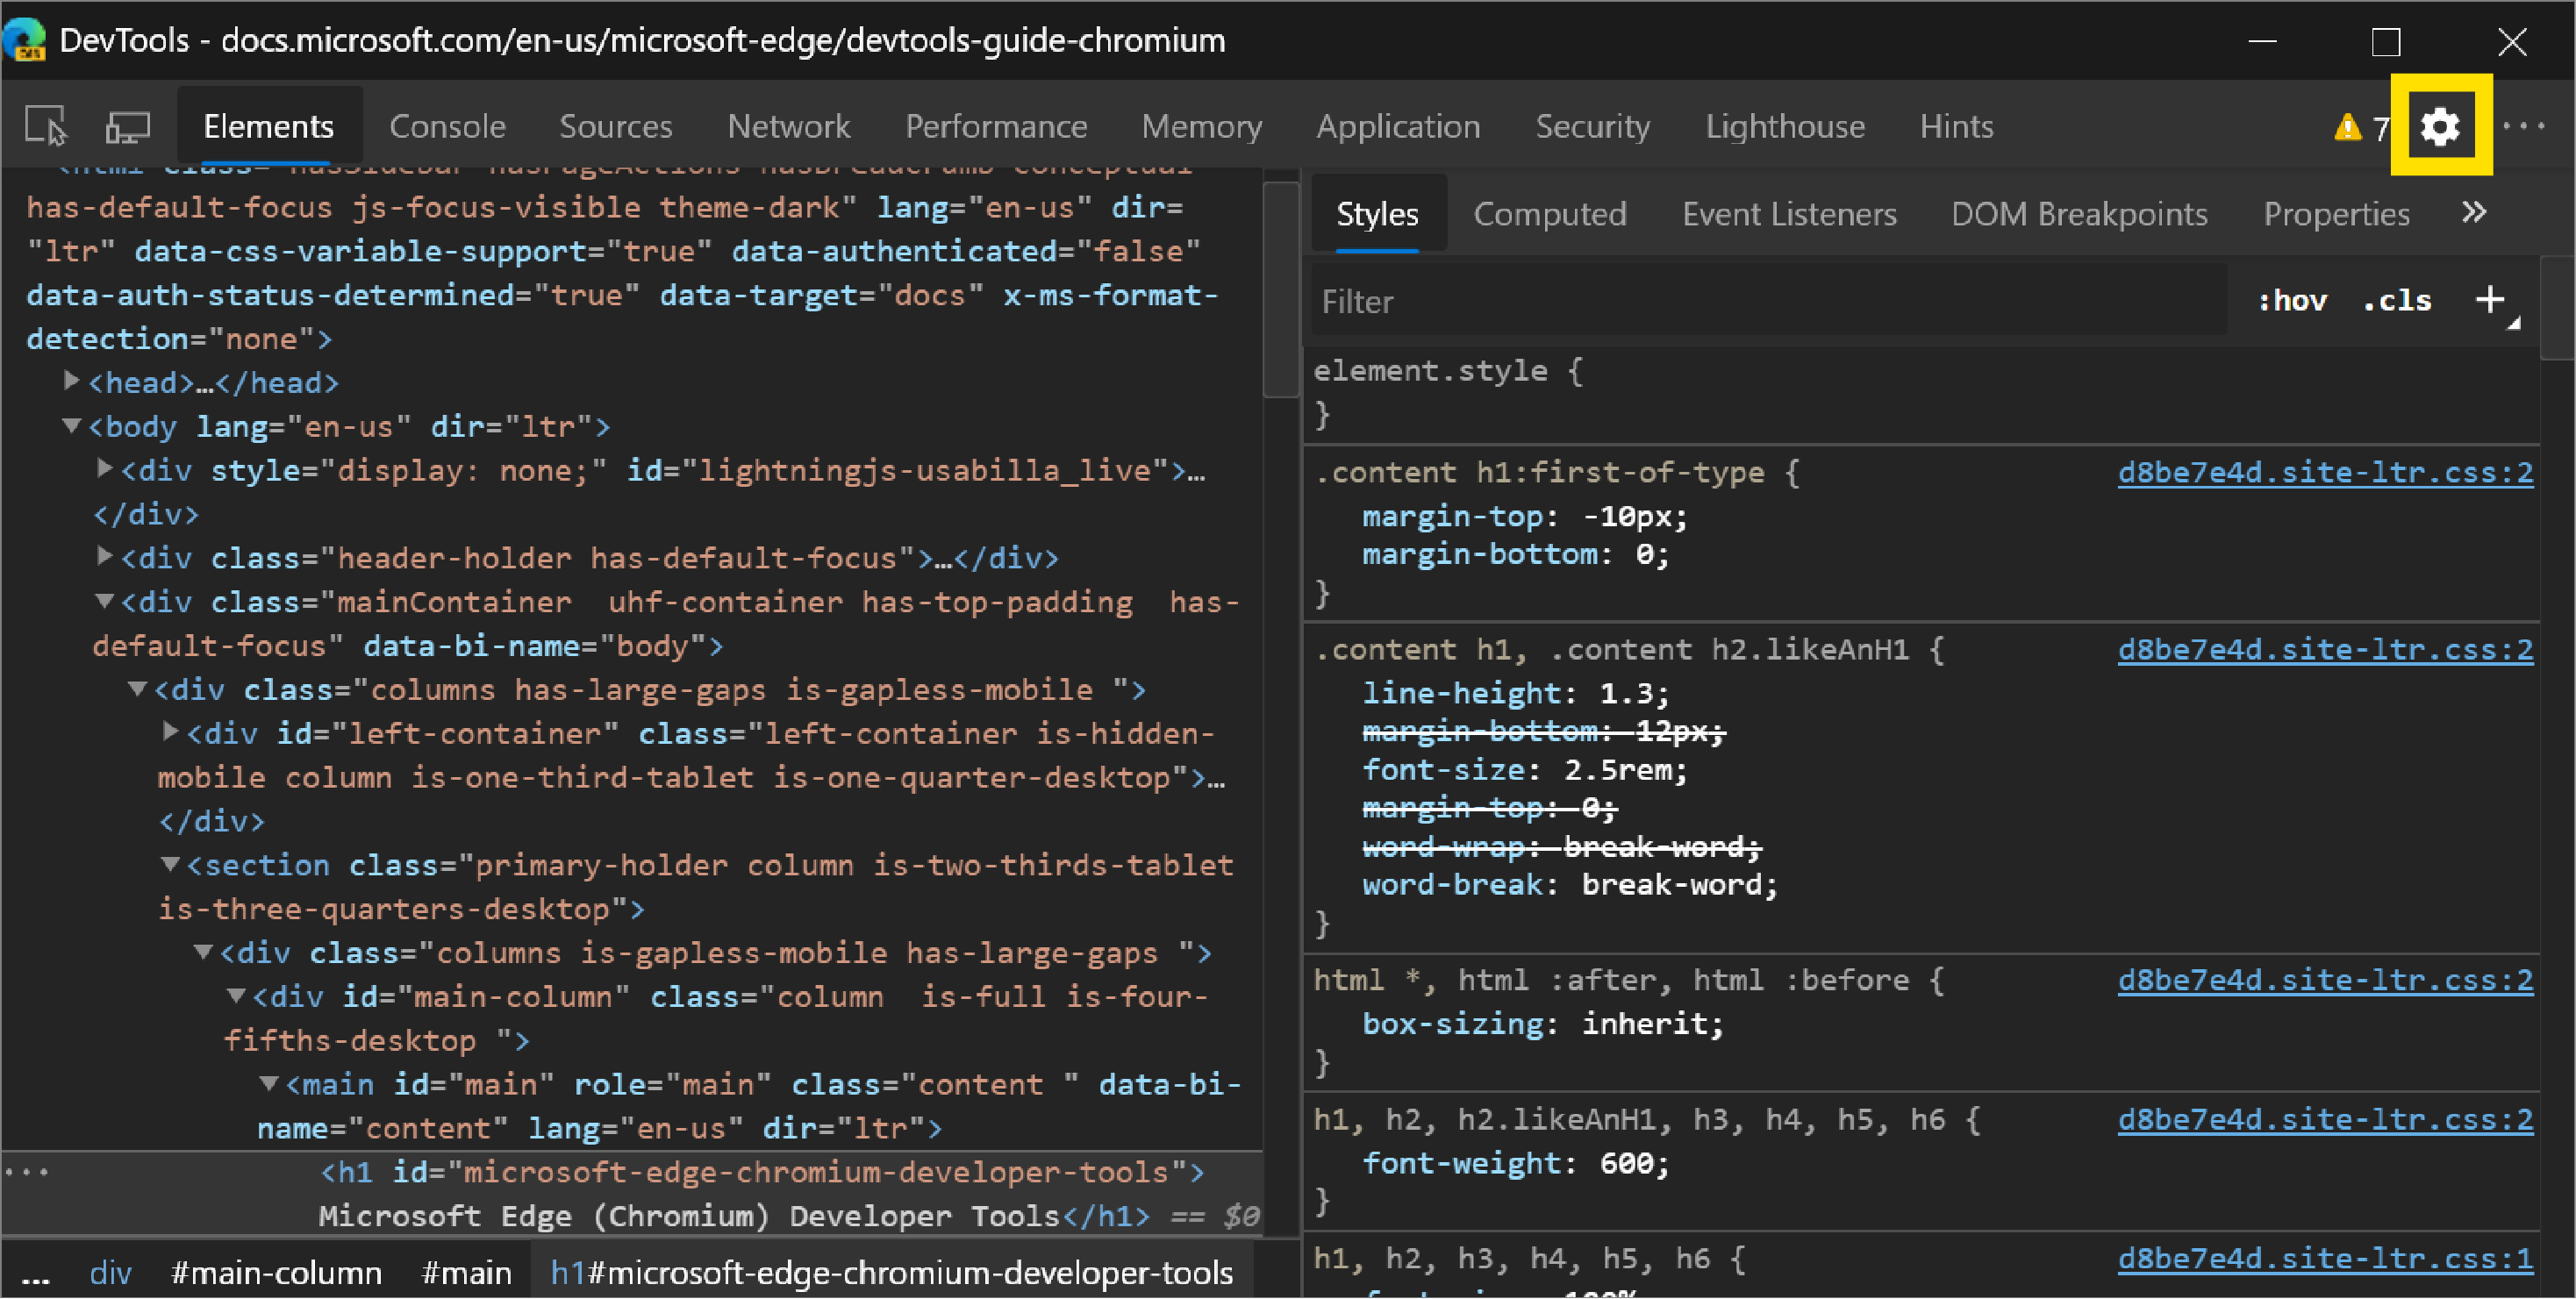
New ways to access Settings
There are tons of settings for DevTools that you can customize to make DevTools look, feel, and work the way you need. In Microsoft Edge 83, accessing Settings in DevTools is now much easier. Open Settings by clicking the gear icon next to Console alerts and the main menu.
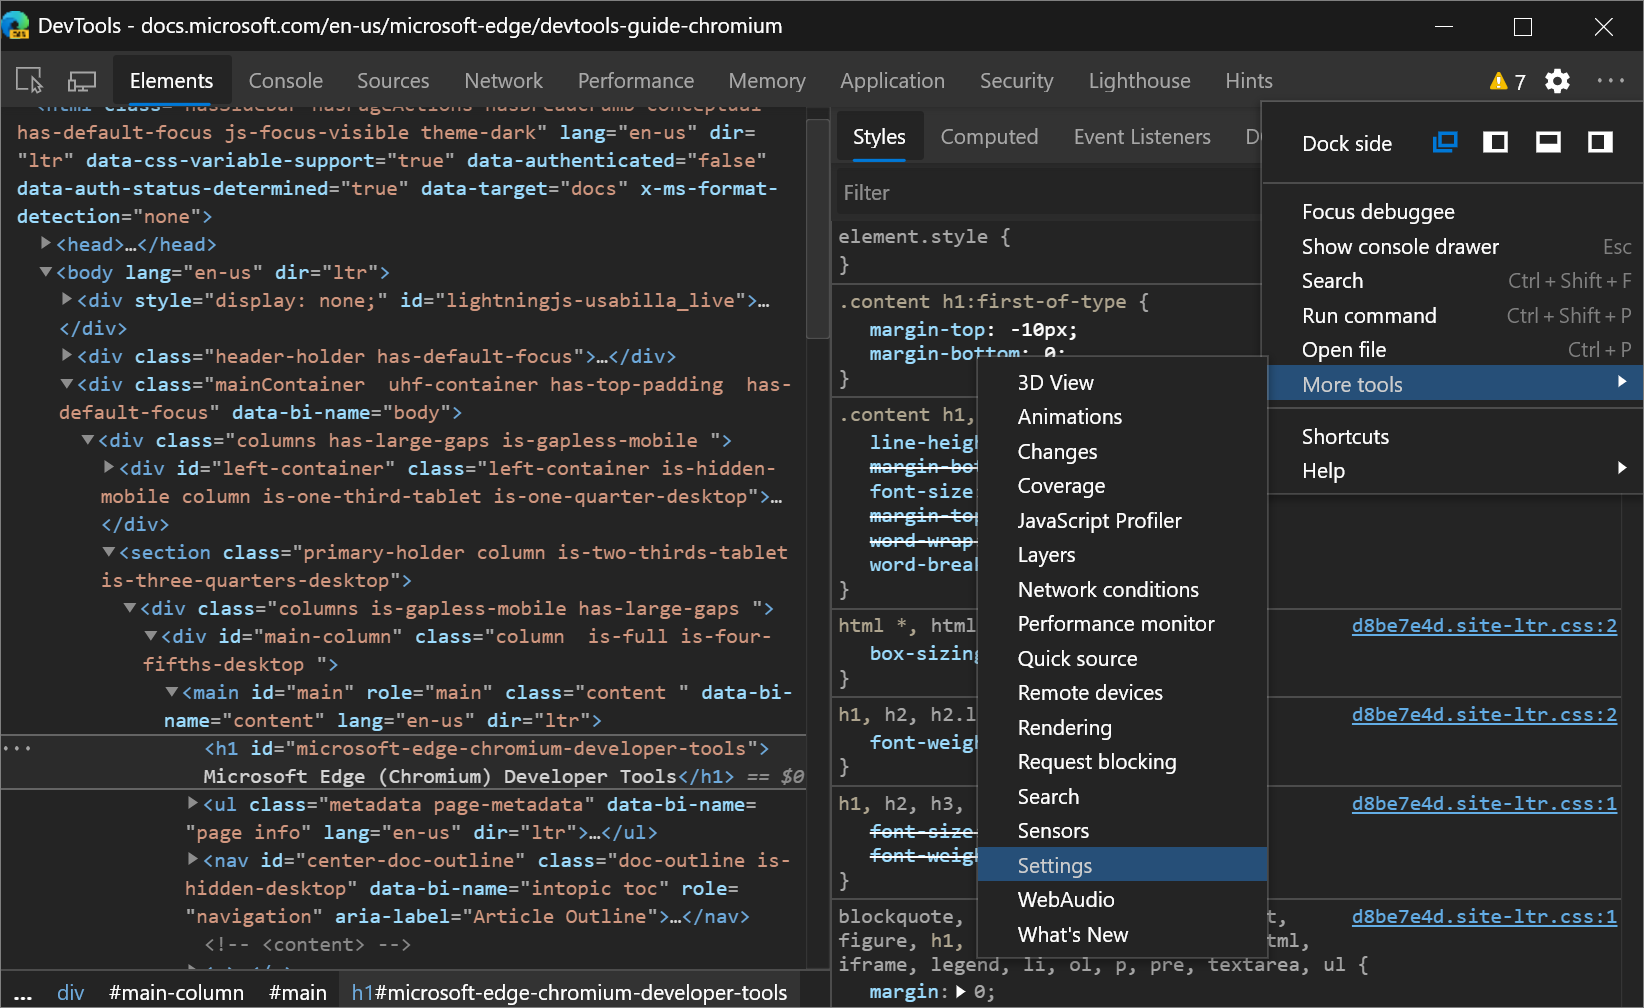
You can also open Settings from the Main Menu under More tools.
Chromium issue #1050855
New and improved infobars
Informational notification bars (infobars) in DevTools now have an improved look and more functionality. In Microsoft Edge 83, infobars are easier to read and provide buttons so you can take the relevant action right away.
Chromium issue #1056348
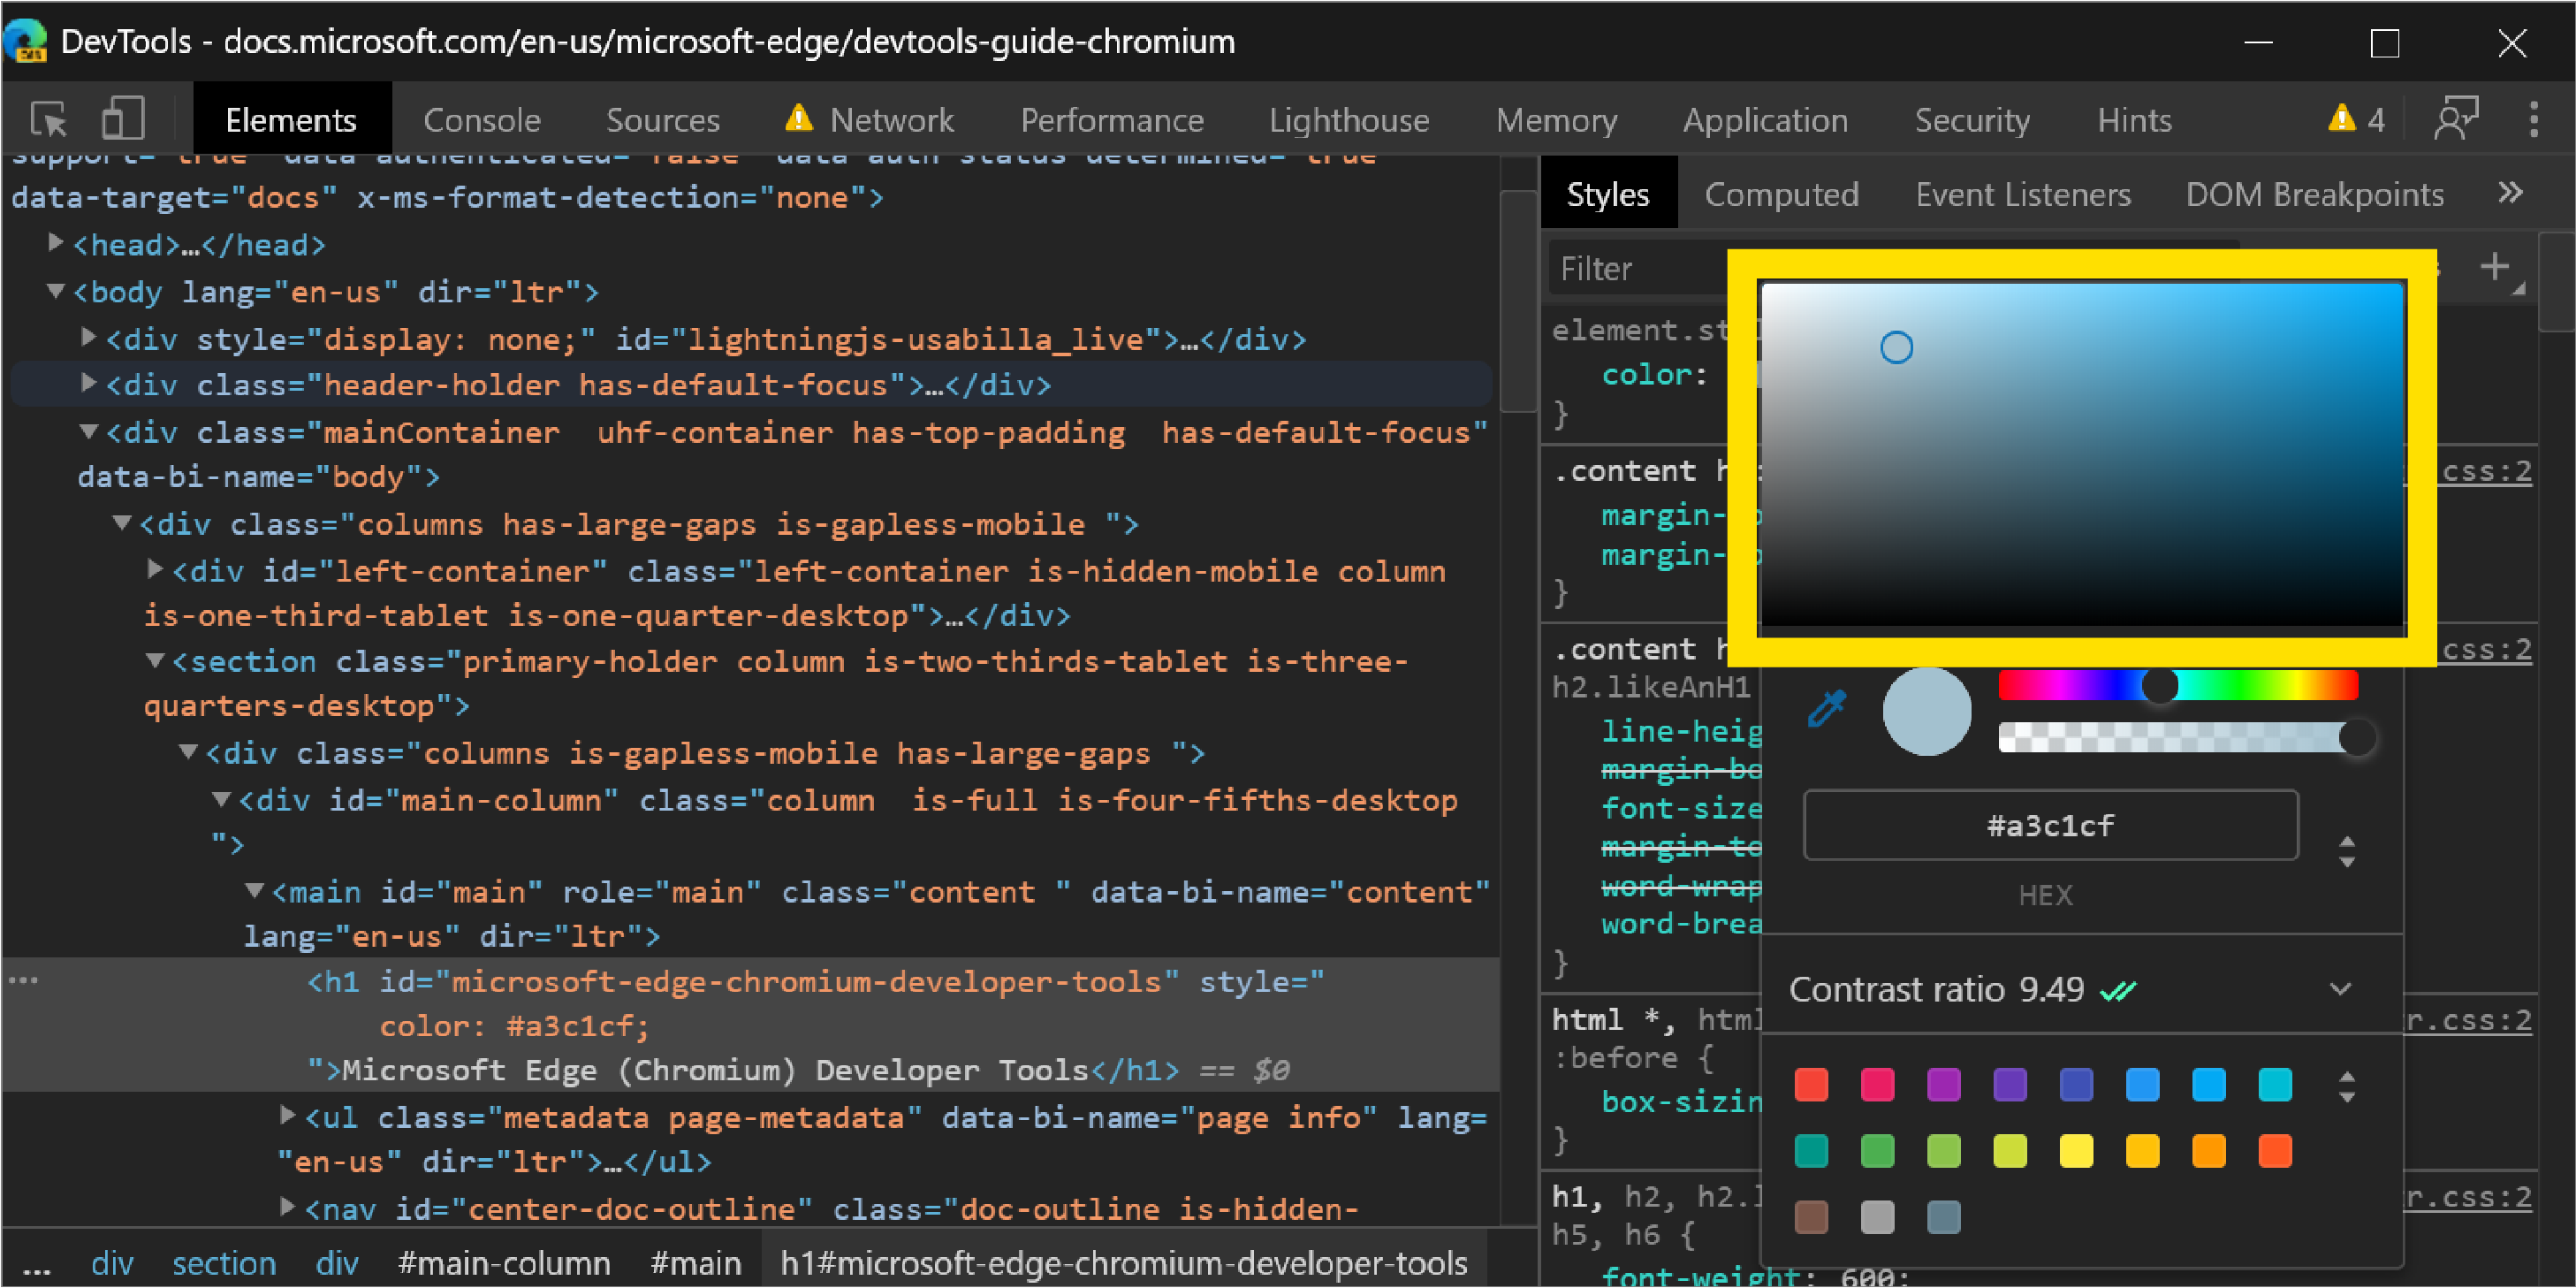
Navigate the Color Picker with your keyboard
In previous versions of Microsoft Edge, you couldn't navigate the Shades section of the Color Picker with the keyboard. In Microsoft Edge 83, you can now use the keyboard to move the selector in the Shades section of the Color Picker.
The Color Picker is a GUI in the Elements panel for changing color and background-color declarations:
Chromium issue #963183
See also:
Properties tab now populates after a page refresh
In Microsoft Edge 81 and earlier, the Properties tab in the Elements panel was broken by page refreshes. When you refreshed the page, the Properties tab didn't populate the properties of the currently selected element:
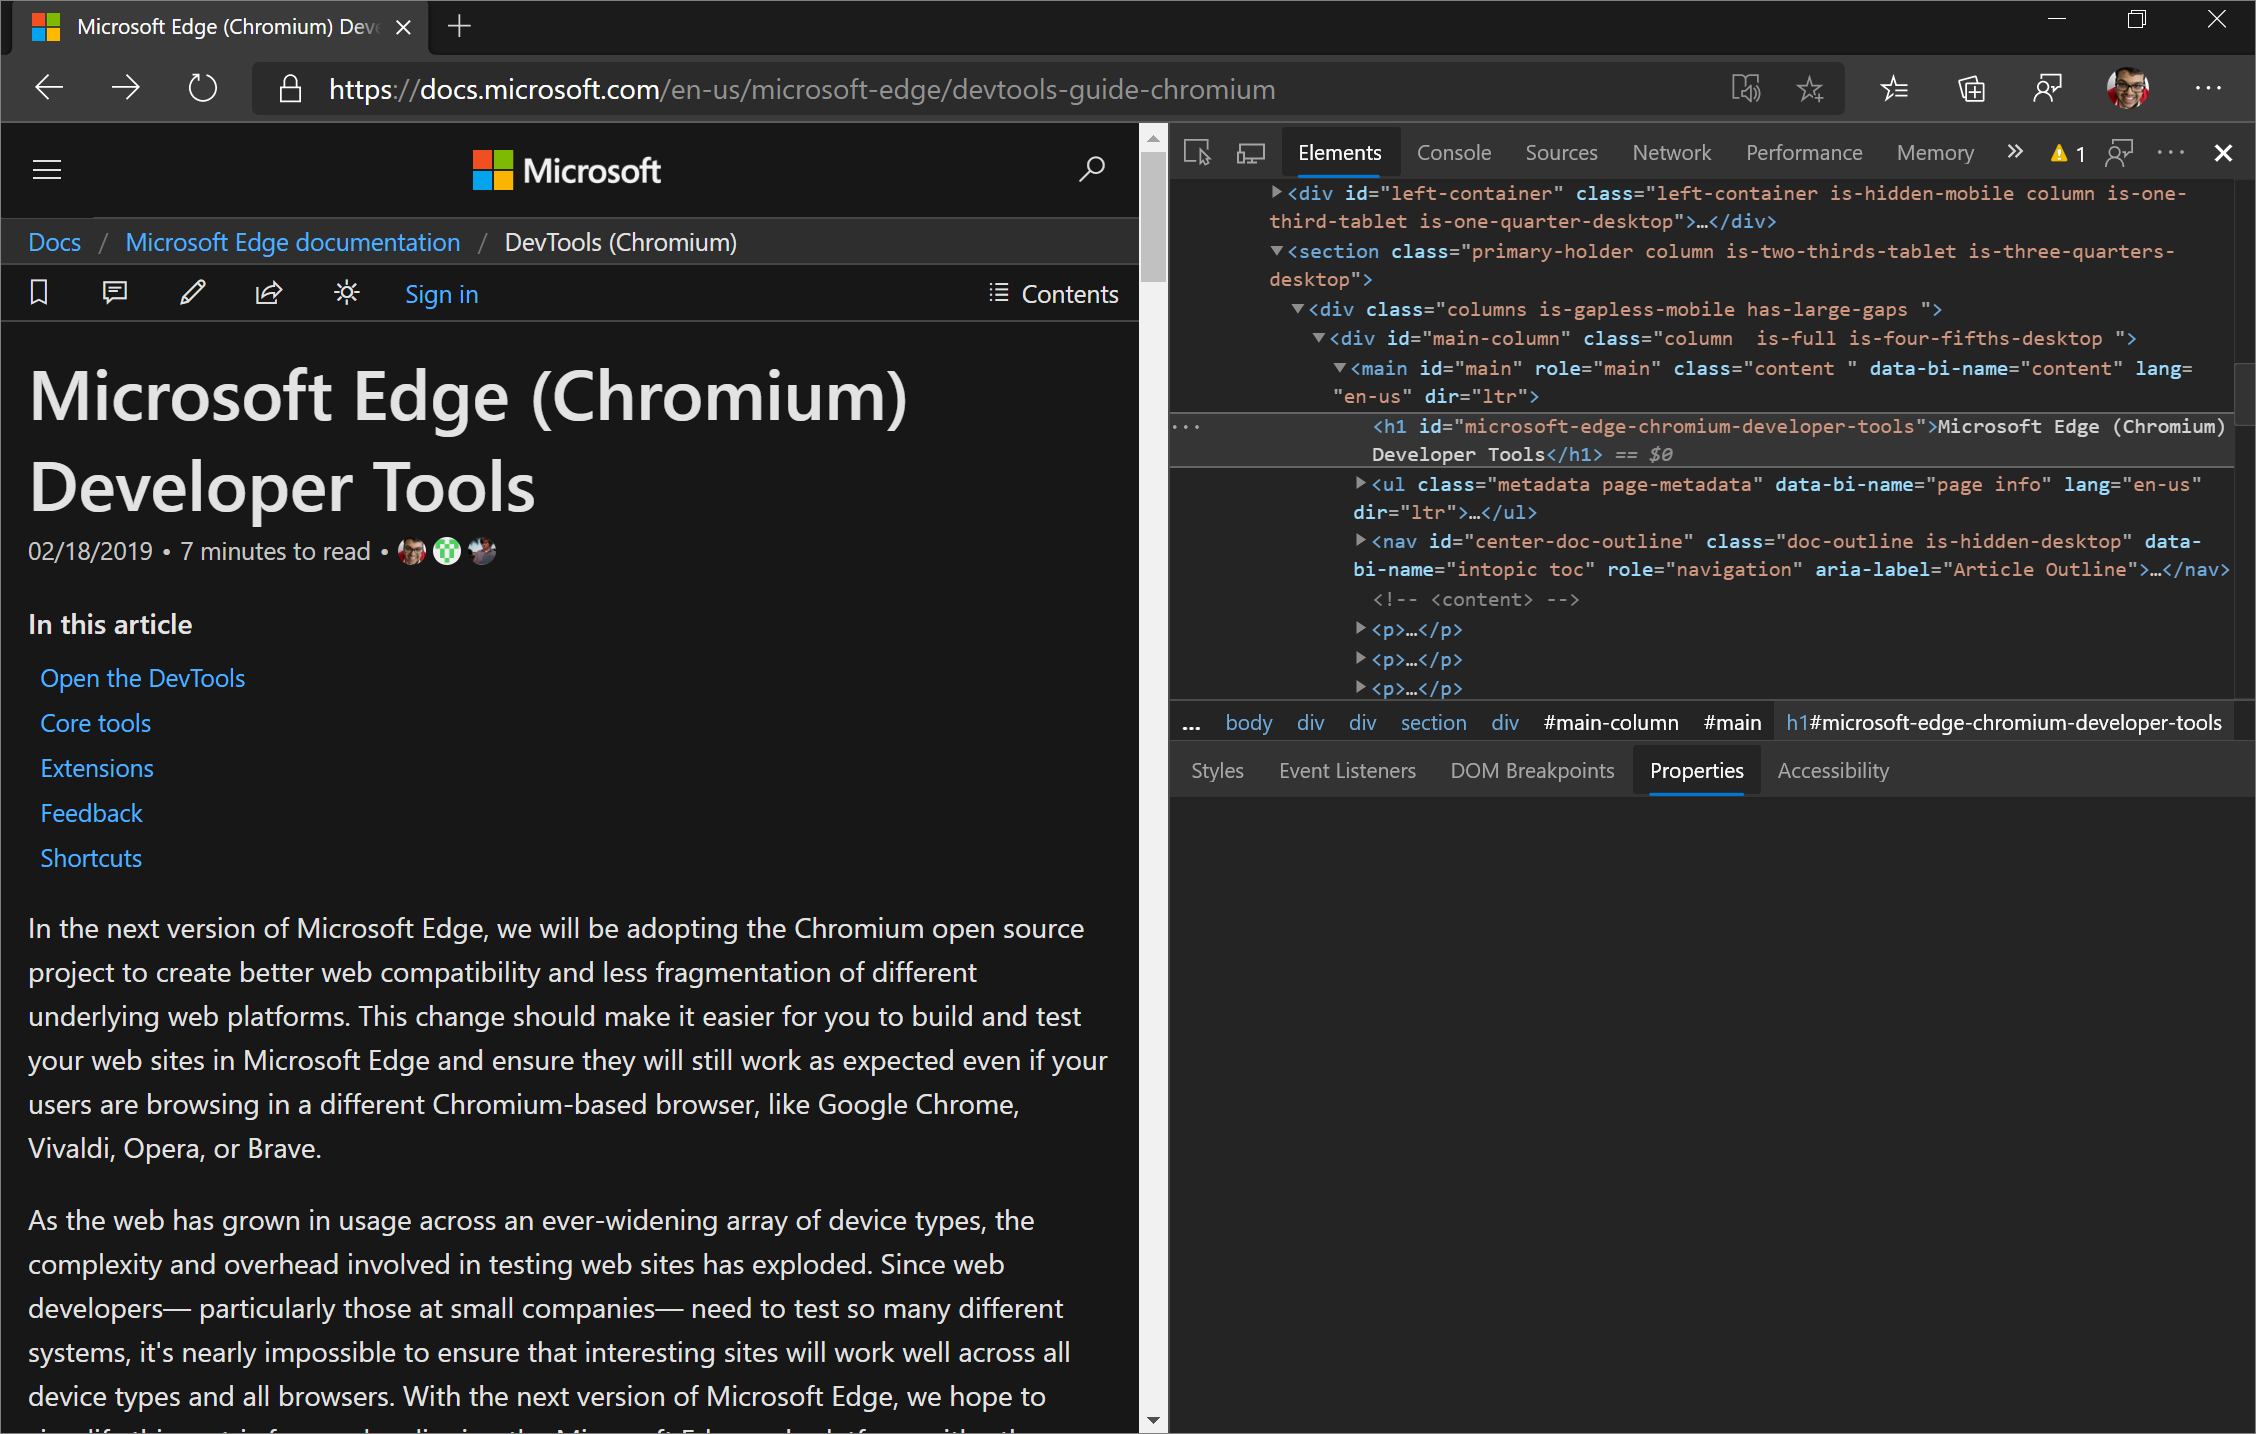
In Microsoft Edge 83, you can now display the properties of the currently selected element after a page refresh in the Properties tab:

Chromium issue #1050999
See also:
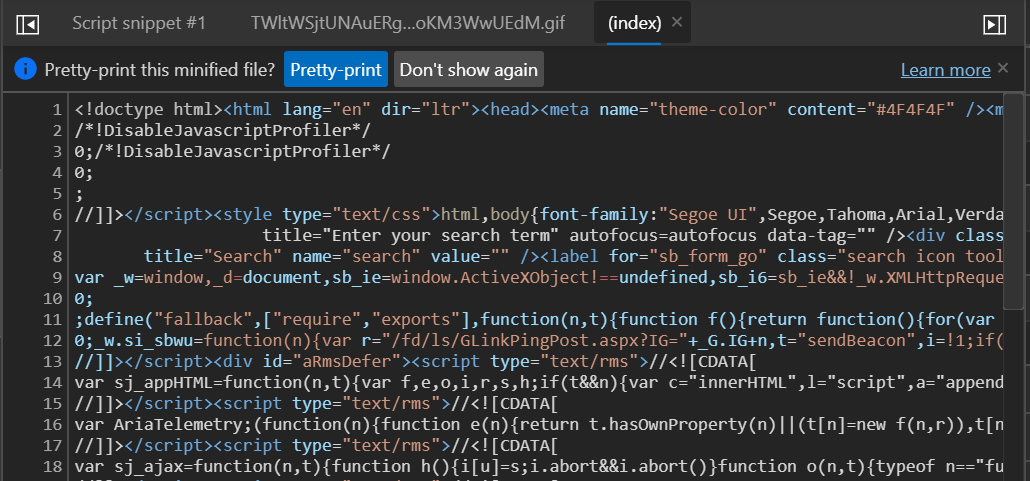
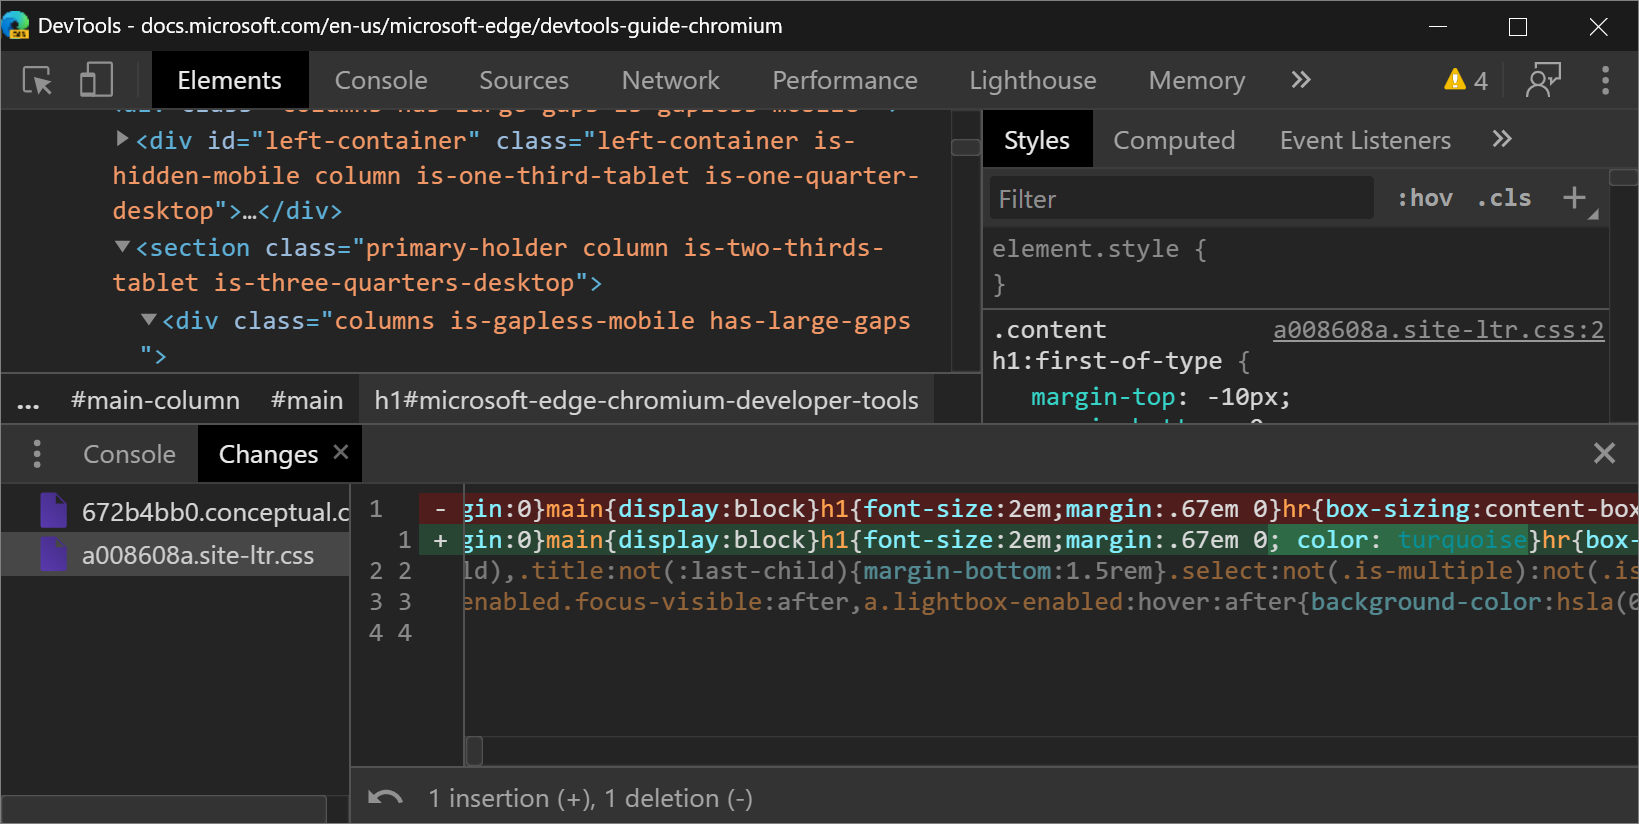
Use the arrow keys to scroll in the Changes tool
The Changes tool tracks any changes you have made to CSS or JavaScript in DevTools. You can use the Changes tool to quickly display all your changes and take those back to your editor/IDE.
To open the Changes tool, in DevTools, press Ctrl+Shift+P (Windows/Linux) or Command+Shift+P (macOS) to open the Command Menu, and then type changes. Select the Show Changes command and then press Enter. The Changes tool opens in the Drawer.
When you have made a change to a minified file, the Changes tool enables you to scroll horizontally to display all of your minified code. Starting in Microsoft Edge 83, you can now scroll horizontally using the arrow keys on your keyboard.
If you use screen readers or the keyboard to navigate around DevTools, send us your feedback by tweeting at us or clicking the Send Feedback icon.
Chromium issue #963183
See also:
Announcements from the Chromium project
The following sections announce additional features available in Microsoft Edge 83 that were contributed to the open source Chromium project.
Emulate vision deficiencies
In the Rendering tool, use the new Emulate vision deficiencies feature to get a better idea of how people with different types of vision deficiencies experience your site:
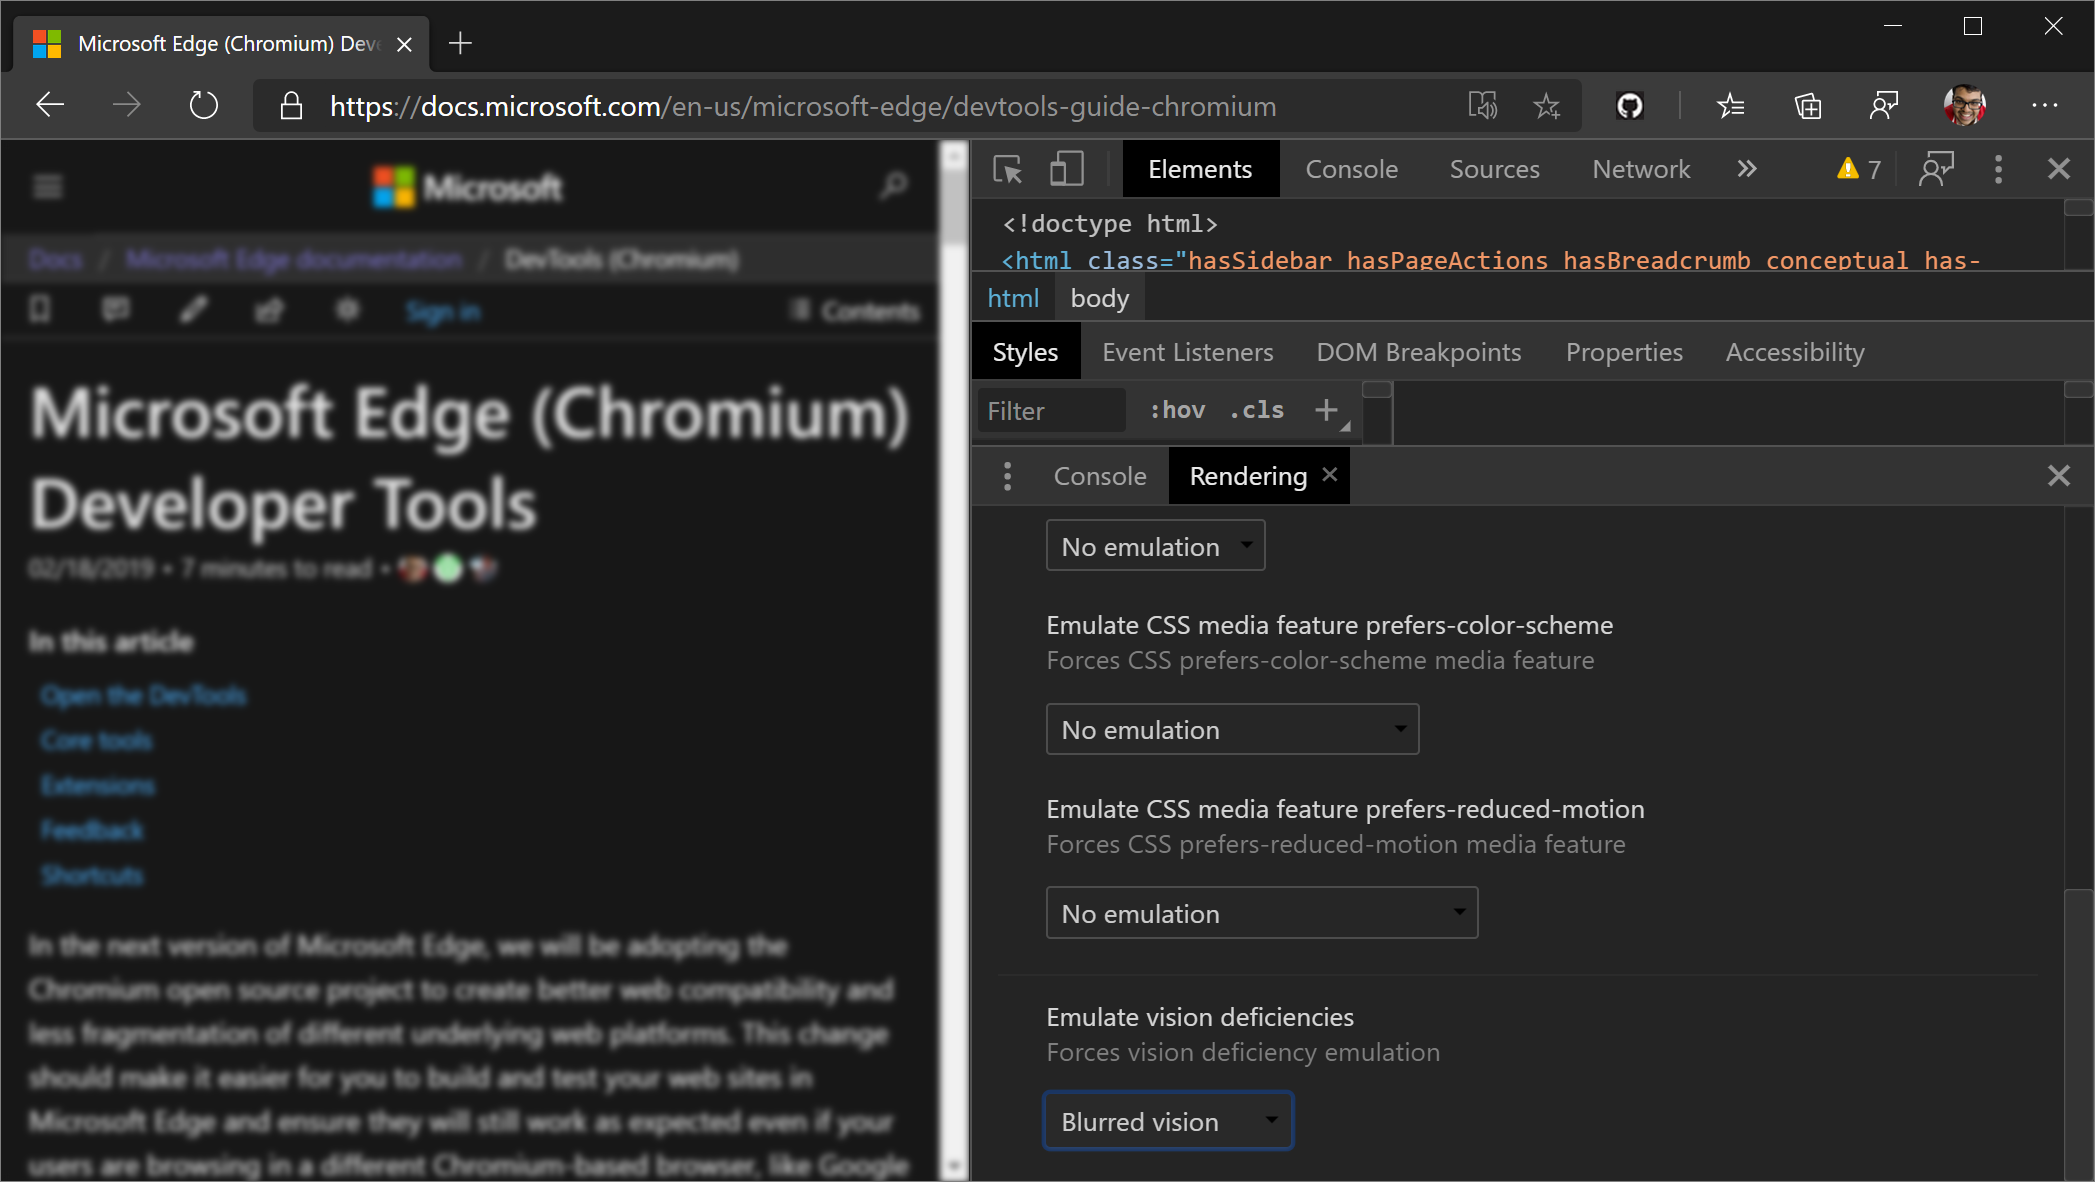
DevTools can emulate blurred vision and the following types of color vision deficiencies:
| Color Vision Deficiency | Details |
|---|---|
| Protanopia | The inability to perceive any red light. |
| Deuteranopia | The inability to perceive any green light. |
| Tritanopia | The inability to perceive any blue light. |
| Achromatopsia | The inability to perceive any color, except for shades of grey (extremely rare). |
Less extreme versions of these color vision deficiencies exist, and are more common. For example, protanomaly is a reduced sensitivity to red light (as opposed to protanopia, which is the complete inability to perceive red light). However, these -omaly vision deficiencies aren't as clearly defined: every person with such a vision deficiency is different, and may see things differently (being able to perceive more or less of the relevant colors).
By designing for the more extreme simulations in DevTools, your web apps are guaranteed to be accessible to people with vision deficiencies as well.
Send your feedback by tweeting or clicking the Send Feedback icon.
Chromium issue #1003700
See also:
- Emulate vision deficiencies
- Analyze rendering performance with the Rendering tool in Performance features reference
- Types of Colour Blindness, at Colourblindawareness.org.
Emulate locales
To emulate locales, in the Sensors tool, select a location from the Location dropdown list. (To access the Sensors tool, open the Command Menu and type Sensors.) After you select a location, DevTools modifies the current default locale, which affects the following code:
Intl.*APIs, for example:new Intl.NumberFormat().resolvedOptions().locale- Other locale-aware JavaScript APIs such as
String.prototype.localeCompareand*.prototype.toLocaleString, for example:123_456..toLocaleString() - DOM APIs such as
navigator.languageandnavigator.languages - The Accept-Language HTTP request header
Note
Updates to navigator.language and navigator.languages aren't visible immediately, but only after the next navigation or page refresh. Changes to the Accept-Language HTTP header are only reflected for subsequent requests.
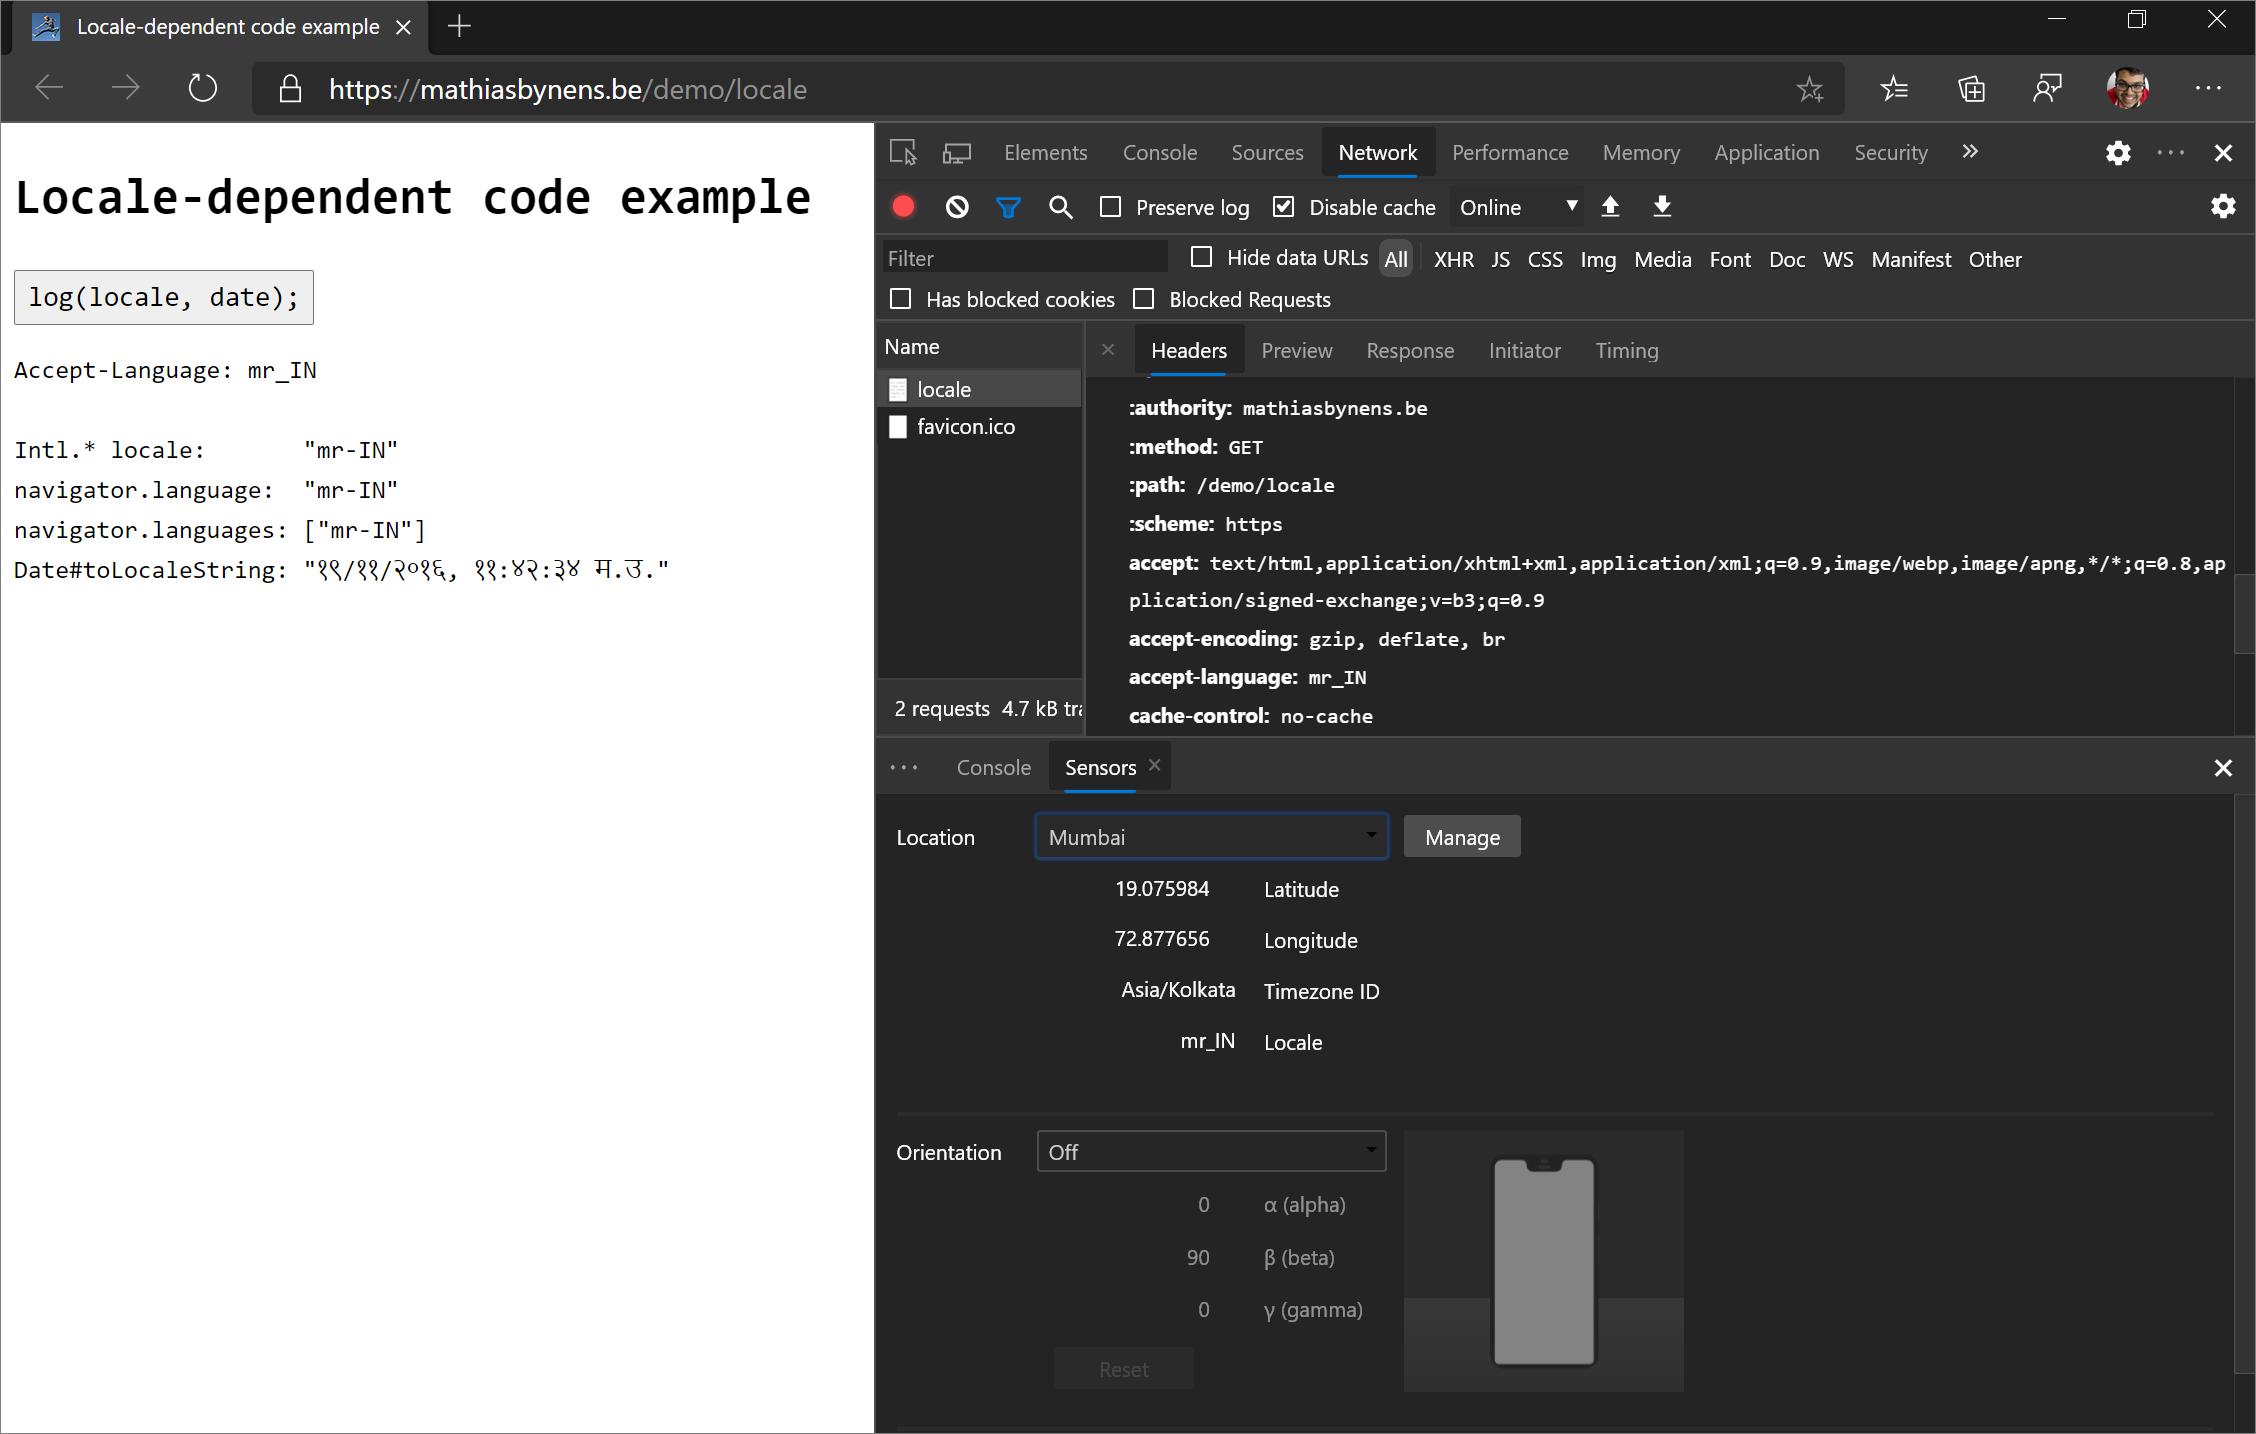
To try a demo, see Locale-dependent code example.
Chromium issue #1051822
See also:
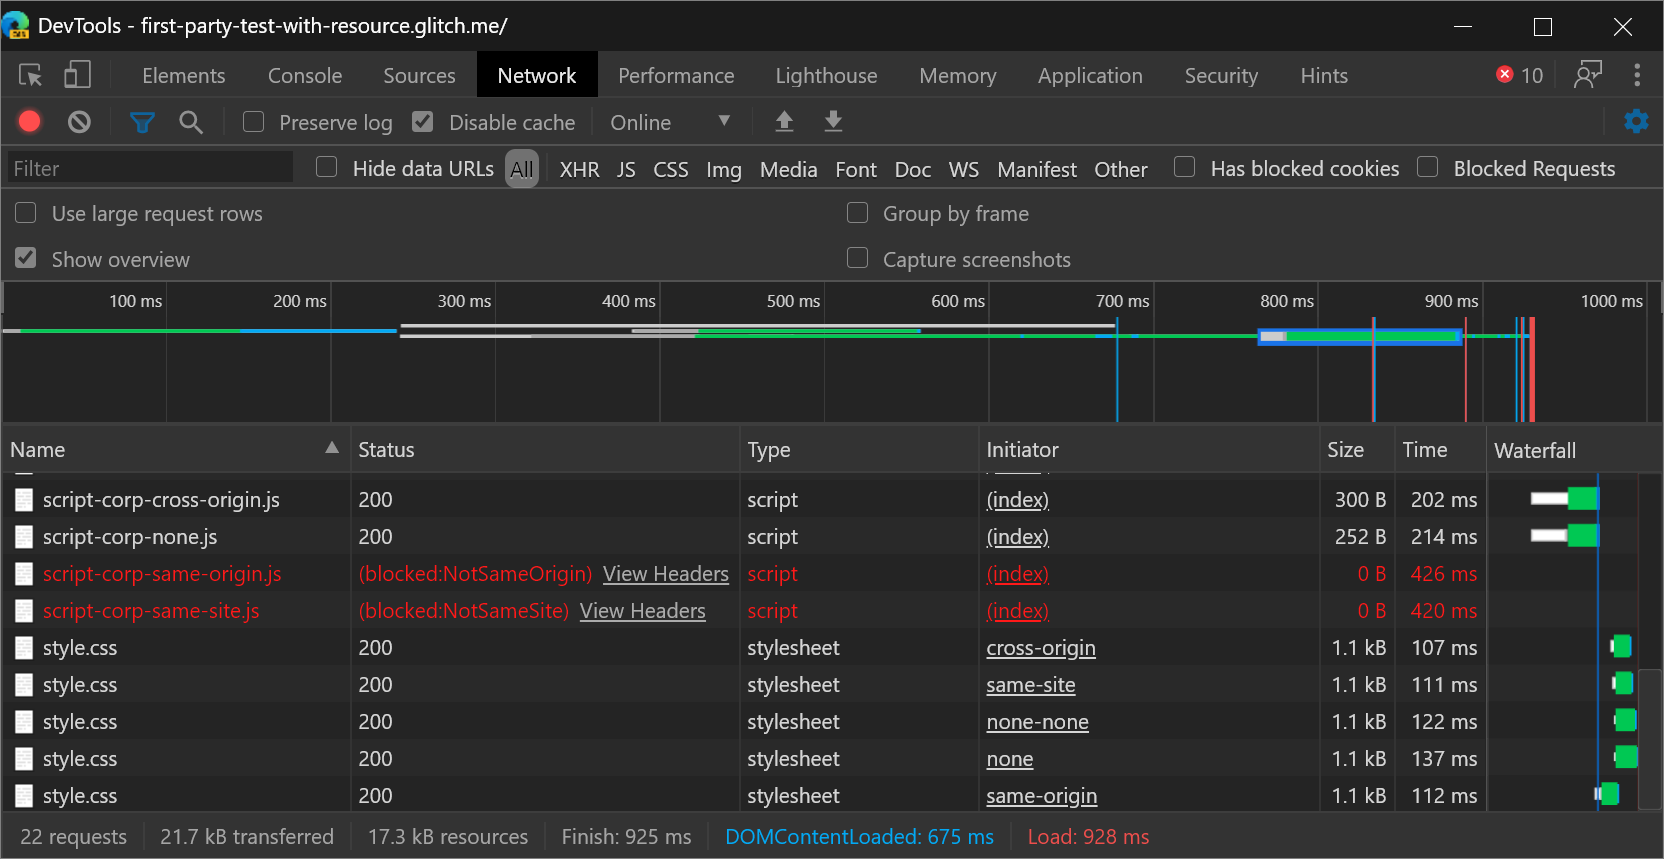
Cross-Origin Embedder Policy (COEP) debugging
The Network panel now provides Cross-Origin Embedder Policy debugging information.
The Status column now provides a quick explanation of why a request was blocked as well as a link to view the headers of that request for further debugging:
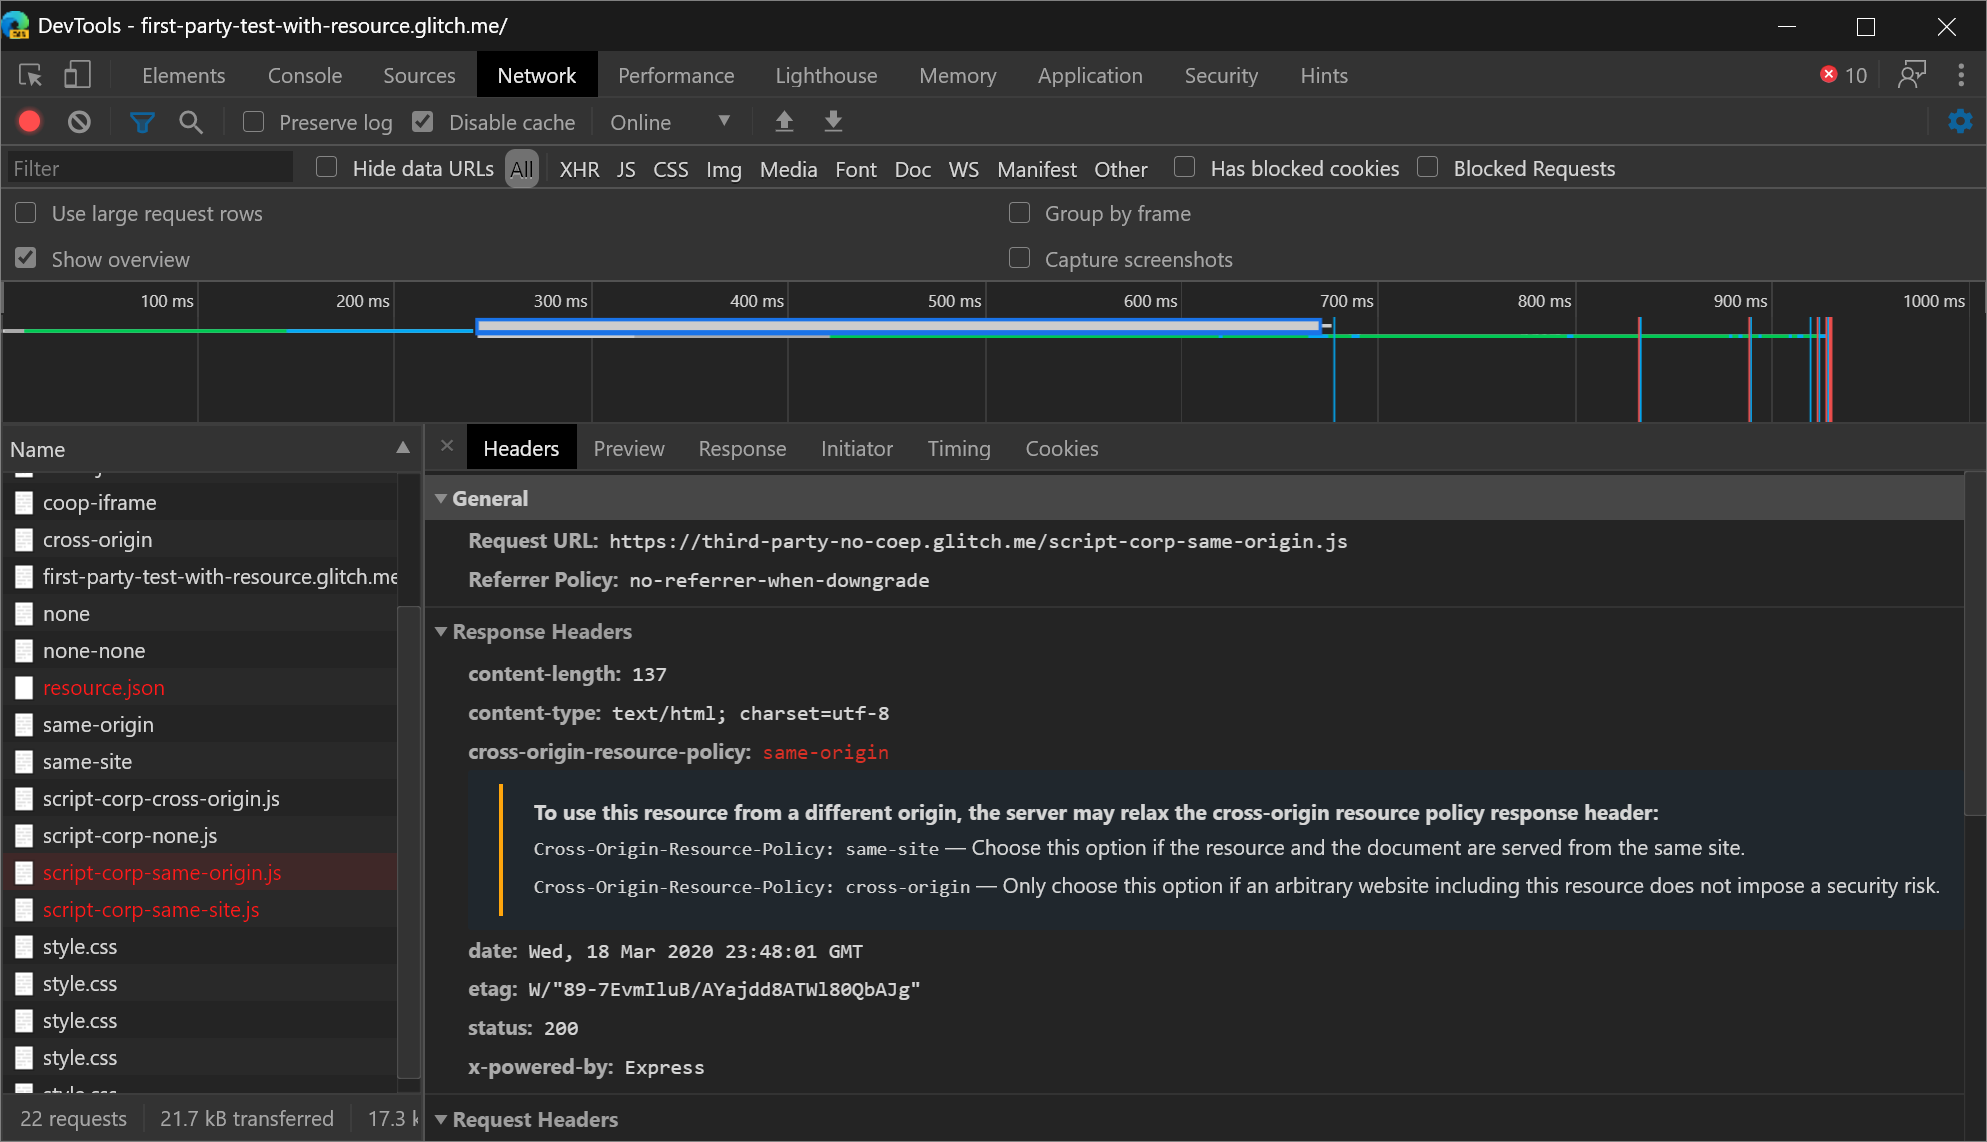
The Response Headers section of the Headers tab provides more guidance on how to resolve the issues:
Send your feedback by tweeting or clicking the Send Feedback icon.
Chromium issue #1051466
See also:
- Block requests in Inspect network activity.
New icons for breakpoints, conditional breakpoints, and logpoints
Update: As of 2022, breakpoints are now indicated by a blue rectangle, instead of a red circle.
The Sources panel has new icons for breakpoints, conditional breakpoints, and logpoints:
- Breakpoints (
 ) are represented by red circles.
 - Conditional Breakpoints (
 ) are represented by half-red half-white circles.
 - Logpoints (
 ) are represented by red circles with Console icons.
The motivation for the new icons was to make the UI more consistent with other GUI debugging tools (which usually color breakpoints red) and to make it easier to distinguish between the 3 features at a glance.
Chromium issue #1041830
See also:
View network requests that set a specific cookie path
Use the new cookie-path filter keyword in the Network tool to focus on the network requests that set a specific cookie path.
To discover more keywords like cookie-path, see Filter requests by properties in Network features reference.
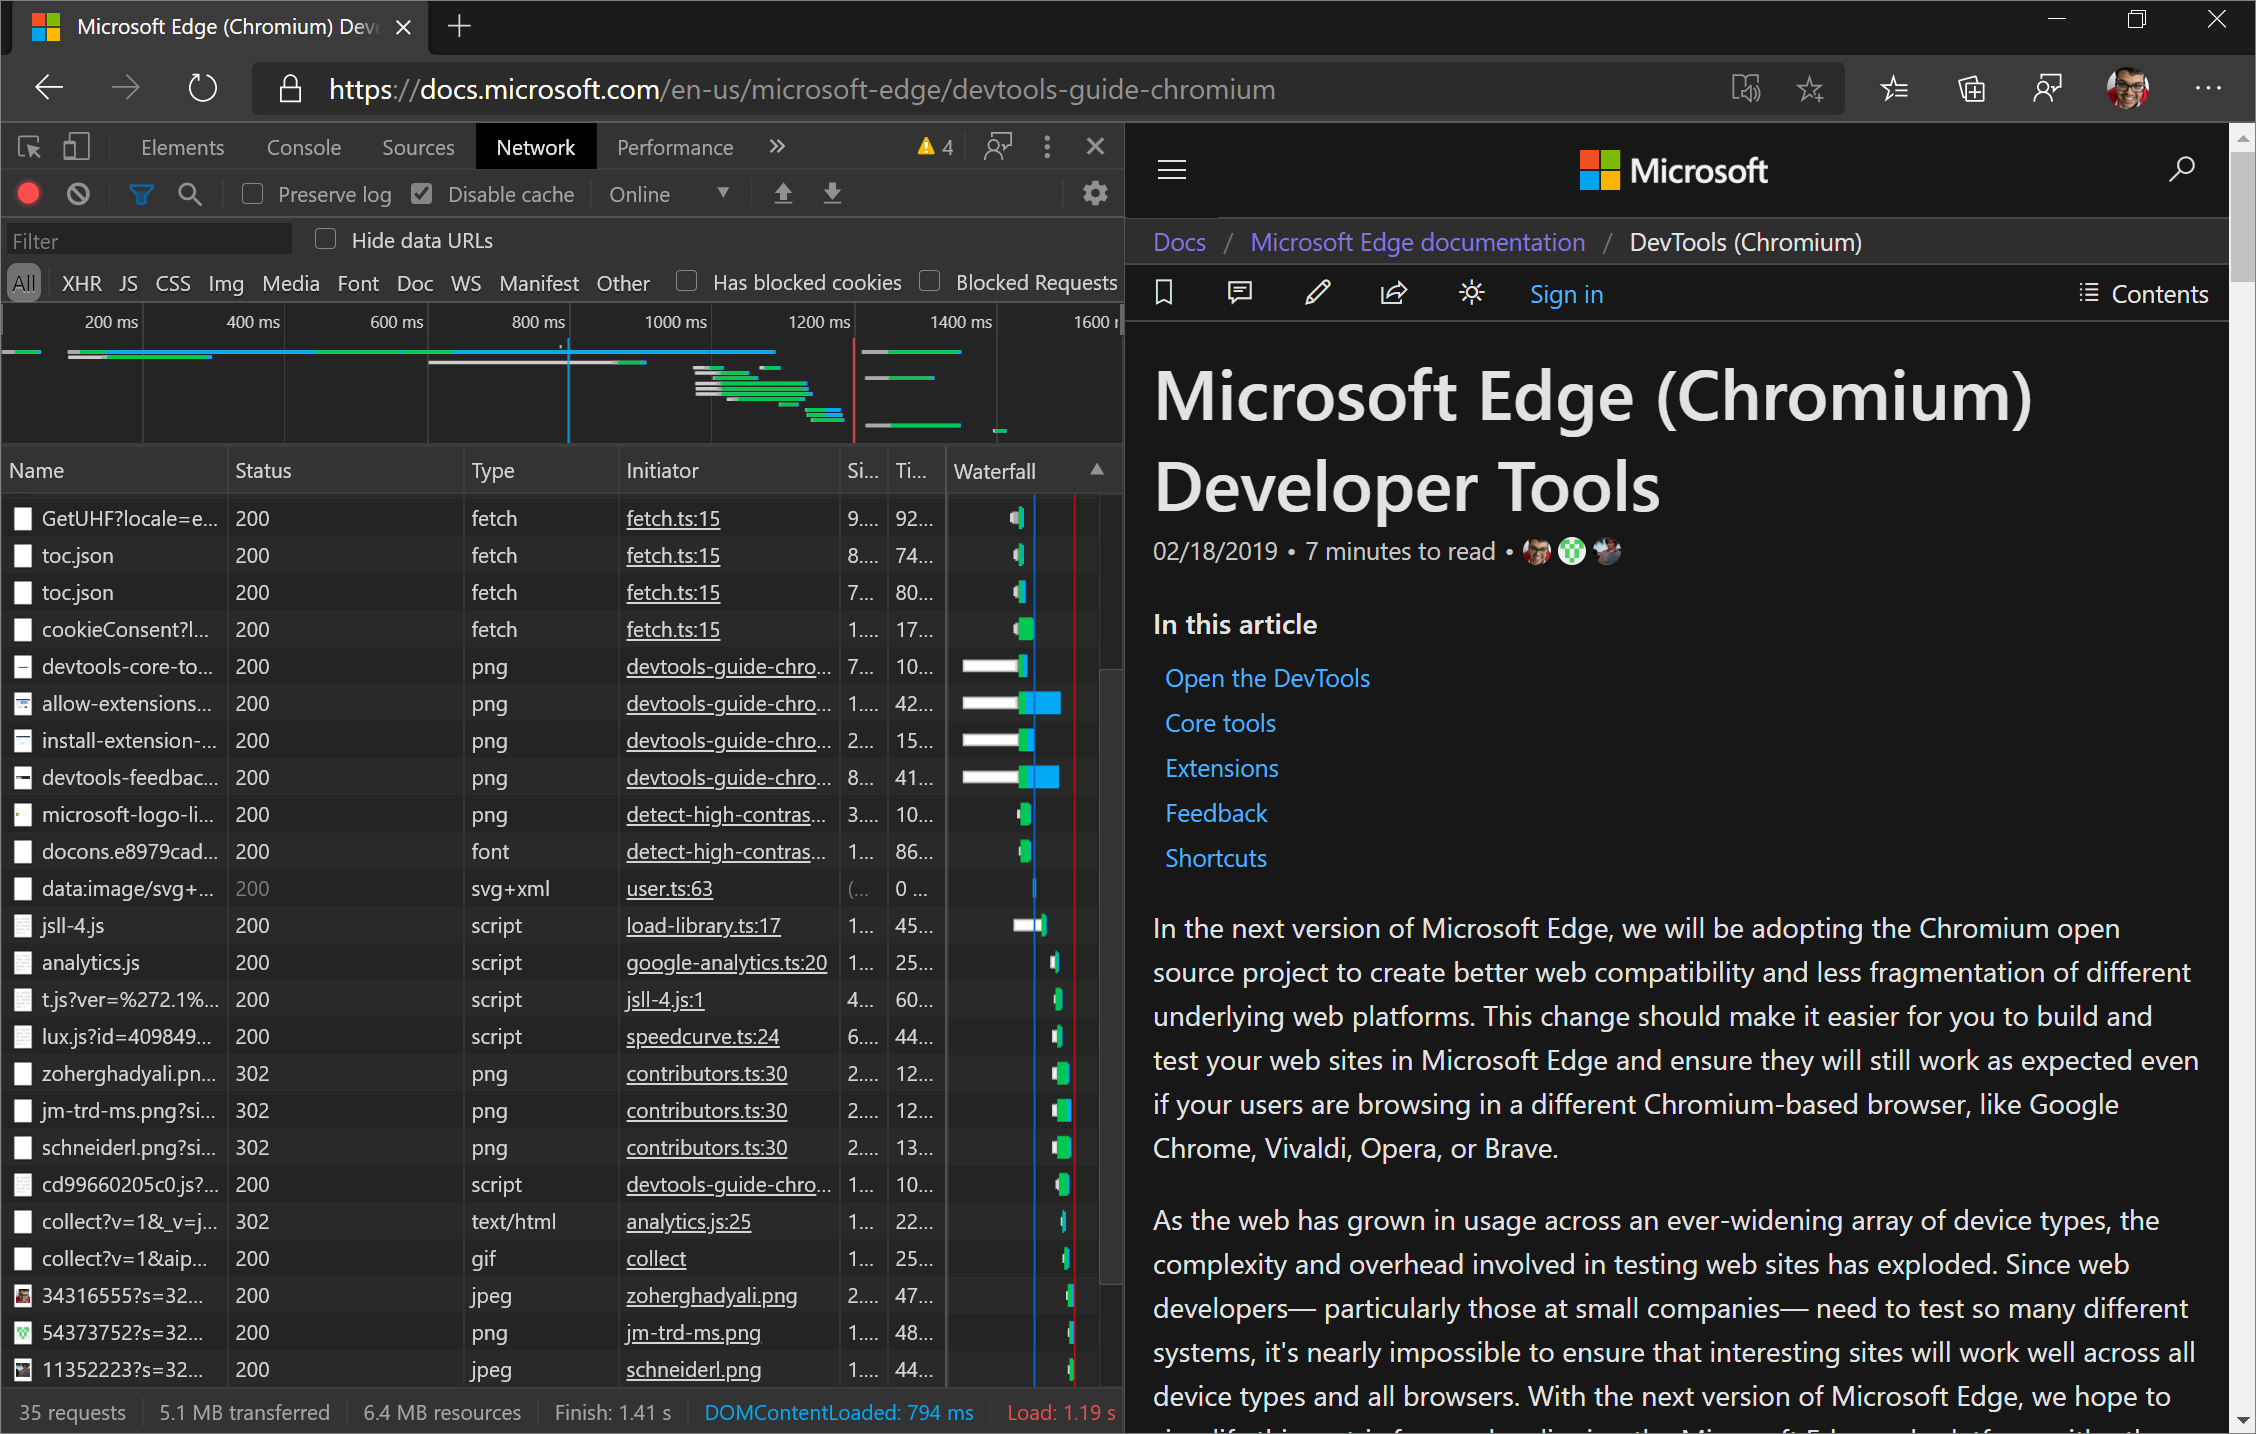
Dock to left from the Command Menu
To move DevTools to the left of the viewport (rendered webpage), open the Command Menu and run the Dock to left command. The Dock to left feature has been available since Microsoft Edge 75, but it was previously only accessible from the main menu. You can now access the Dock to left feature from the Command Menu, as well.
 "
"
Send your feedback by tweeting or clicking the Send Feedback icon.
Chromium issue #1011679
See also:
The Audits panel is now the Lighthouse panel
The DevTools team frequently got feedback from web developers that while it was possible to run Lighthouse from DevTools, when they tried it out, they couldn't find a "Lighthouse" panel. So, the Audits panel is now called the Lighthouse panel.
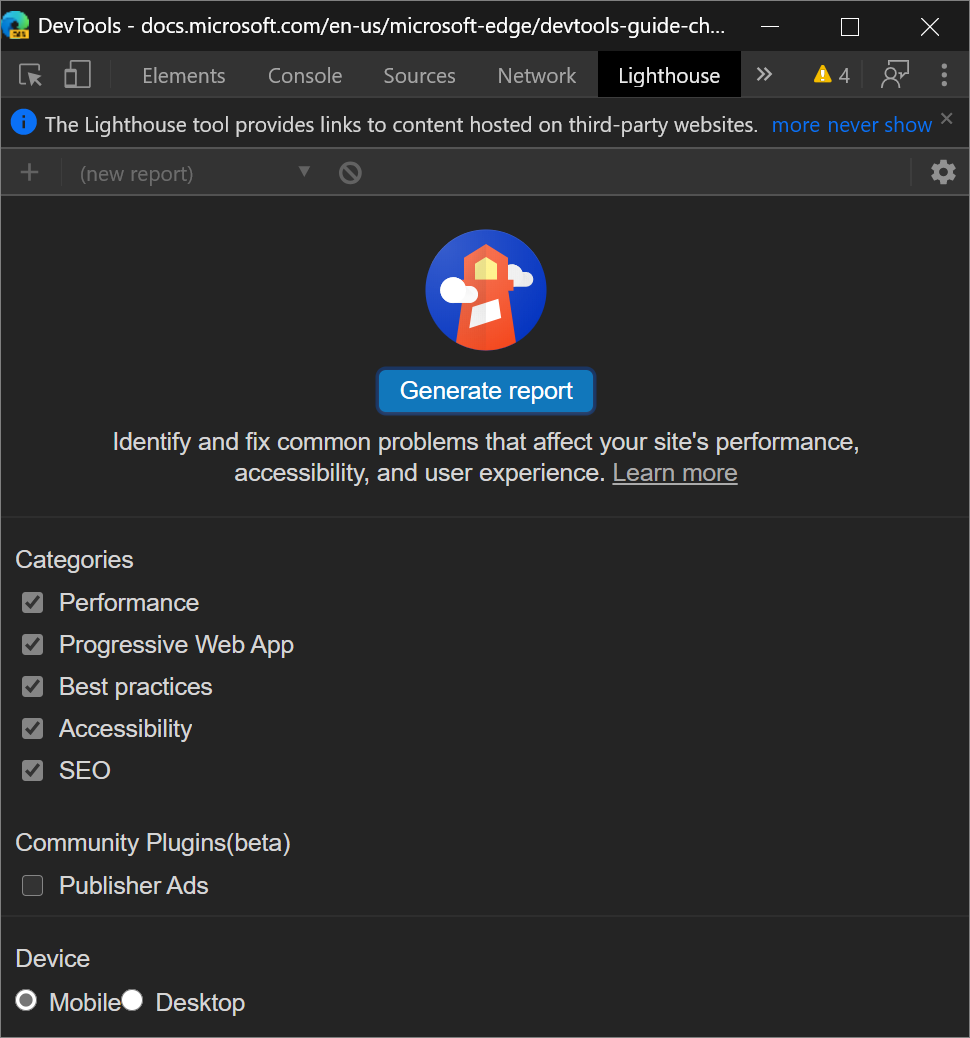
Note: The Lighthouse panel provides links to content hosted on third-party websites. Microsoft is not responsible for and has no control over the content of these sites and any data they may collect.
See also:
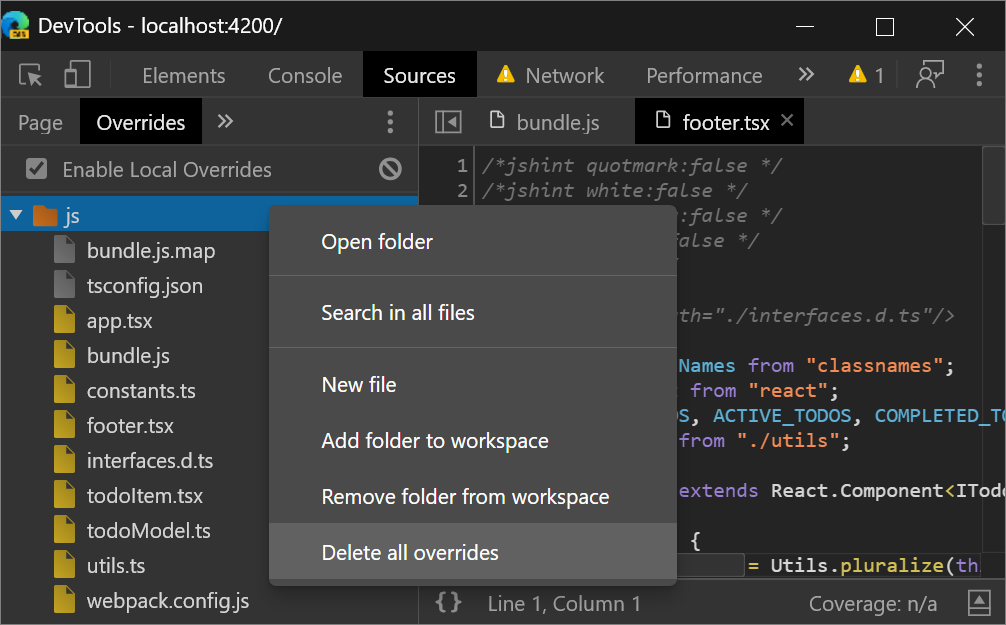
Delete all Local Overrides in a folder
After setting up Local Overrides, you can right-click a directory and then select the new Delete all overrides option to delete all Local Overrides in that folder.
Send your feedback by tweeting or clicking the Send Feedback icon.
Chromium issue #1016501
See also:
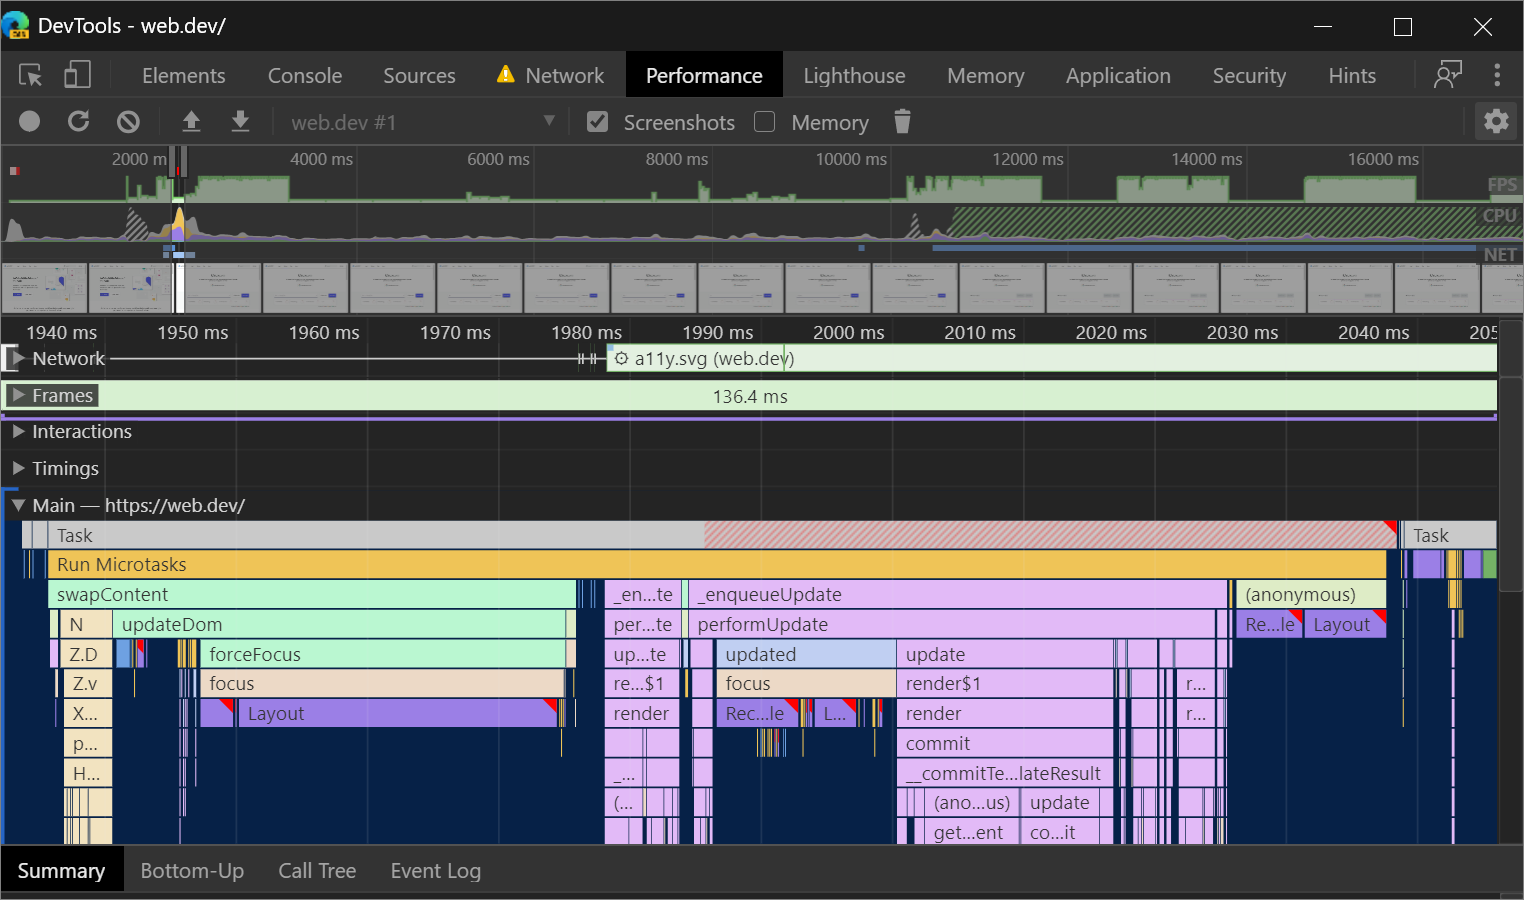
Updated Long tasks UI
A Long Task is JavaScript code that monopolizes the main thread for a long time, causing a web page to freeze.
You've been able to visualize Long Tasks in the Performance panel for a while now, but in Microsoft Edge 83 the Long Task visualization UI in the Performance panel has been updated. The Long Task portion of a task is now colored with a striped red background:
Send your feedback by tweeting or clicking the Send Feedback icon.
Chromium issue #1054447
Maskable icon support in the Manifest pane
There's a new checkbox, Show only the minimum safe area for maskable icons, in the Manifest pane of the Application tool.
Android Oreo introduced adaptive icons, which display app icons in a variety of shapes across different device models. Maskable icons are a new icon format that support adaptive icons, which enable you to ensure that your PWA icon looks good on devices that support the maskable icons standard.
To check that your maskable icon looks good on Android Oreo devices, in the Manifest pane of the Application tool, select the new checkbox Show only the minimum safe area for maskable icons:
![]()
This feature launched in Microsoft Edge 81. The updates covered here in Microsoft Edge 83 weren't covered in What's New in DevTools (Microsoft Edge 81).
See also:
- View, edit, and delete cookies - Articles about the Application tool.
Note
Portions of this page are modifications based on work created and shared by Google and used according to terms described in the Creative Commons Attribution 4.0 International License. The original page is found here and is authored by Kayce Basques (Technical Writer, Chrome DevTools & Lighthouse).
![]() This work is licensed under a Creative Commons Attribution 4.0 International License.
This work is licensed under a Creative Commons Attribution 4.0 International License.
Feedback
Coming soon: Throughout 2024 we will be phasing out GitHub Issues as the feedback mechanism for content and replacing it with a new feedback system. For more information see: https://aka.ms/ContentUserFeedback.
Submit and view feedback for