Overview
Applies to: ![]() Visual Studio
Visual Studio ![]() Visual Studio for Mac
Visual Studio for Mac
Note
This article applies to Visual Studio 2017. If you're looking for the latest Visual Studio documentation, see Visual Studio documentation. We recommend upgrading to the latest version of Visual Studio. Download it here
Each Roslyn analyzer diagnostic or rule has a default severity and suppression state that can be overwritten and customized for your project. This article covers setting analyzer severities and suppressing analyzer violations.
Configure severity levels
You can configure the severity of analyzer rules, or diagnostics, if you install the analyzers as a NuGet package. You can change the severity of a rule from Solution Explorer or in a rule set file.
The following table shows the different severity options:
| Severity (Solution Explorer) | Severity (EditorConfig file) | Build-time behavior | Editor behavior |
|---|---|---|---|
| Error | error |
Violations appear as Errors in the Error List and in command-line build output, and cause builds to fail. | Offending code is underlined with a red squiggle and marked by a small red box in the scroll bar. |
| Warning | warning |
Violations appear as Warnings in the Error List and in command-line build output, but don't cause builds to fail. | Offending code is underlined with a green squiggle and marked by a small green box in the scroll bar. |
| Info | suggestion |
Violations appear as Messages in the Error List, and not at all in command-line build output. | Offending code is underlined with a gray squiggle and marked by a small gray box in the scroll bar. |
| Hidden | silent |
Non-visible to user. | Non-visible to user. The diagnostic is reported to the IDE diagnostic engine, however. |
| None | none |
Suppressed completely. | Suppressed completely. |
| Default | default |
Corresponds to the default severity of the rule. To determine what the default value for a rule is, look in the Properties window. | Corresponds to the default severity of the rule. |
Rule violations found by the analyzer appear in the code editor (as a squiggle under the offending code) and in the Error List window by analyzer.
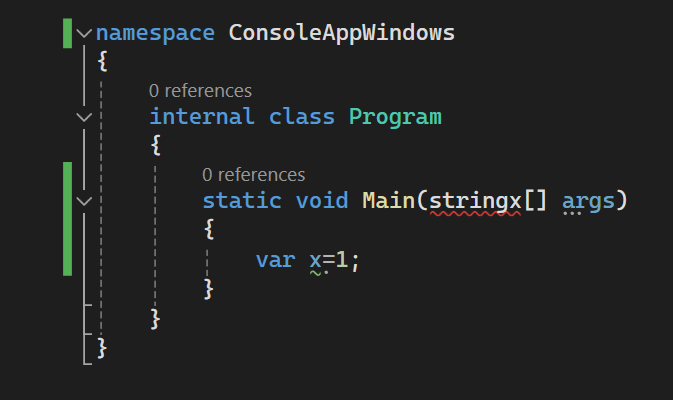
The analyzer violations reported in the error list match the severity level setting of the rule. Analyzer violations also show up in the code editor as squiggles under the offending code. The following image shows three violations—one error (red squiggle), one warning (green squiggle), and one suggestion (three grey dots):
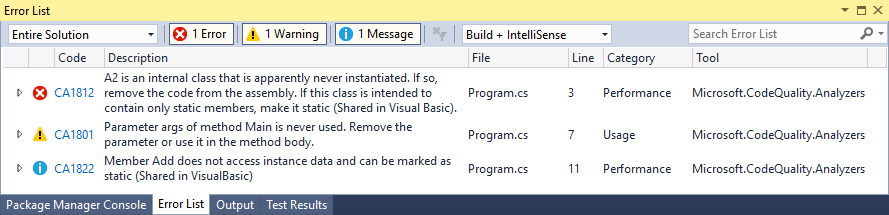
The following screenshot shows the same three violations as they appear in the Error List:
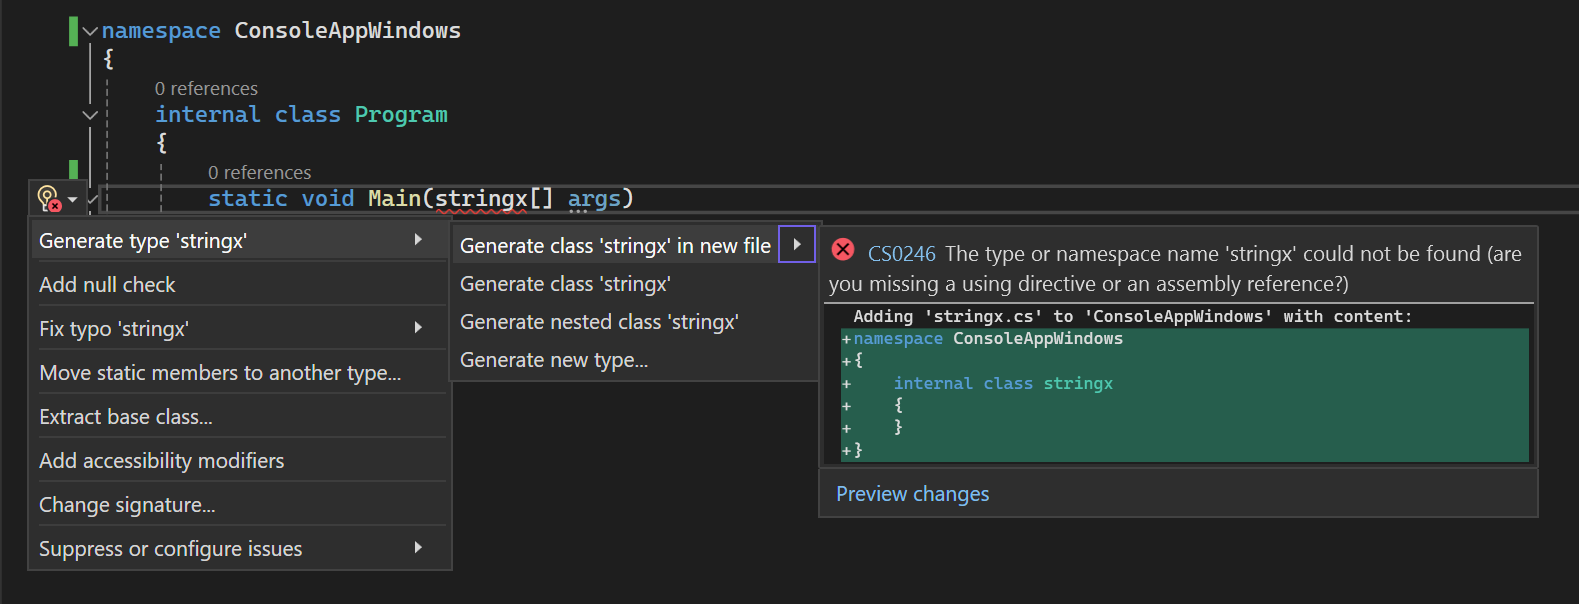
Many analyzer rules, or diagnostics, have one or more associated code fixes that you can apply to correct the rule violation. Code fixes are shown in the light bulb icon menu along with other types of Quick Actions. For information about these code fixes, see Common Quick Actions.
'Hidden' severity versus 'None' severity
Hidden severity rules that are enabled by default differ from disabled or None severity rules in certain aspects.
- If any code fix is registered for a
Hiddenseverity rule, Visual Studio offers the fix as a light bulb code-refactoring action even if the hidden diagnostic isn't visible to the user. The fix isn't offered if the severity rule is disabled asNone. Hiddenseverity rules can be bulk configured by entries that set rule severity of multiple analyzer rules at once in an EditorConfig file.Noneseverity rules can’t be configured this way. Instead, they must be configured through entries that set rule severity in an EditorConfig file for each rule ID.
Set rule severity from Solution Explorer
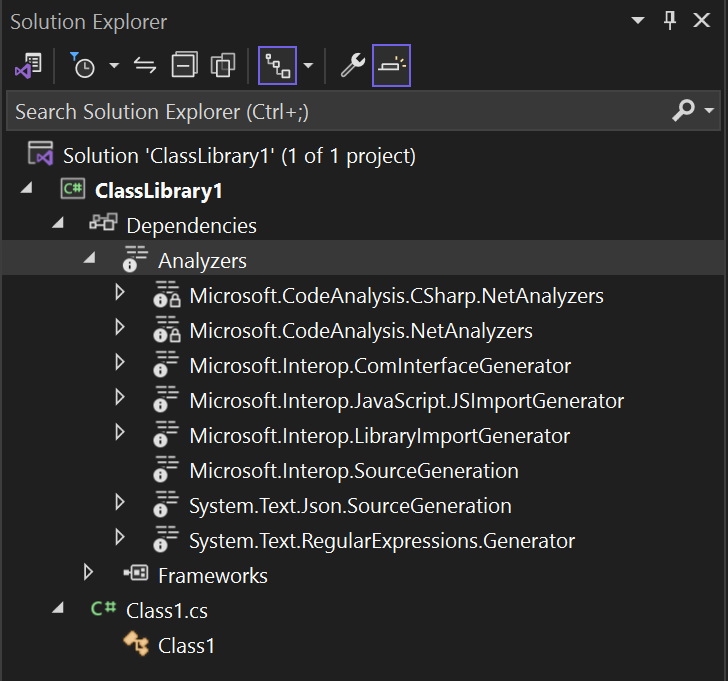
You can do much of the customization of analyzer diagnostics from Solution Explorer. If you install analyzers as a NuGet package, an Analyzers node appears under the References or Dependencies node in Solution Explorer. If you expand Analyzers, and then expand one of the analyzer assemblies, you see all the diagnostics in the assembly.
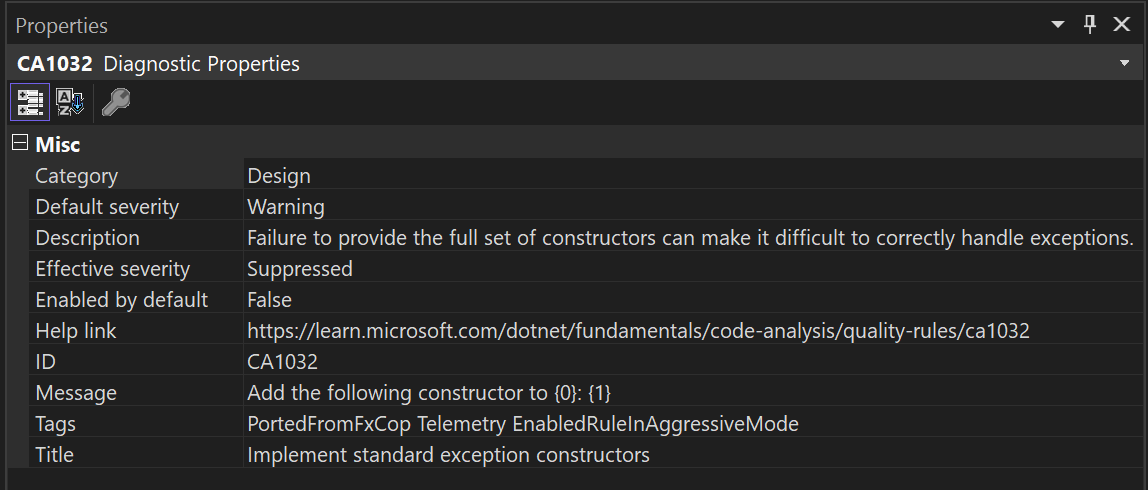
You can view the properties of a diagnostic, including its description and default severity, in the Properties window. To view properties, right-click the rule and select Properties, or select the rule and then press Alt+Enter.
To see online documentation for a diagnostic, right-click the diagnostic and select View Help.
The icons next to each diagnostic in Solution Explorer correspond to the icons you see in the rule set when you open it in the editor:
- "x" in a circle indicates a severity of Error
- "!" in a triangle indicates a severity of Warning
- "i" in a circle indicates a severity of Info
- "i" in a circle on a light-colored background indicates a severity of Hidden
- Downward-pointing arrow in a circle indicates that the diagnostic is suppressed
![]()
Set rule severity from Solution Explorer
In Solution Explorer, expand References > Analyzers (or Dependencies > Analyzers for .NET Core projects).
Expand the assembly that contains the rule you want to set severity for.
Right-click the rule and select Set Rule Set Severity. In the context menu, choose one of the severity options.
The severity for the rule is saved in the active rule set file.
Set rule severity in the rule set file
Open the active rule set file in one of the following ways:
In Solution Explorer, double-click the file, right-click References > Analyzers node, and select Open Active Rule Set.
On the Code Analysis property page for the project, select Open .
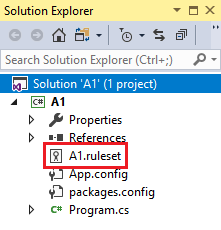
If you're editing the rule set for the first time, Visual Studio makes a copy of the default rule set file, names it <projectname>.ruleset, and adds it to your project. This custom rule set also becomes the active rule set for your project.
Note
.NET Core and .NET Standard projects don't support the menu commands for rule sets in Solution Explorer, for example, Open Active Rule Set. To specify a non-default rule set for a .NET Core or .NET Standard project, manually add the CodeAnalysisRuleSet property to the project file. You can still configure the rules within the rule set in the Visual Studio rule set editor UI.
Browse to the rule by expanding its containing assembly.
In the Action column, select the value to open a drop-down list, and choose the desired severity from the list.

Suppress violations
You can suppress rule violations using various methods. For more information, see Suppress code analysis violations.
Command-line usage
When you build your project at the command line, rule violations appear in the build output if the following conditions are met:
The analyzers are installed with the .NET SDK or as a NuGet package, and not as a VSIX extension.
For analyzers installed using the .NET SDK, you may need to Enable the analyzers. For code styles, you can also enforce code styles on build by setting an MSBuild property.
One or more rules are violated in the project's code.
The severity of a violated rule is set to either warning, in which case violations don't cause build to fail, or error, in which case violations cause build to fail.
The verbosity of the build output doesn't affect whether rule violations are shown. Even with quiet verbosity, rule violations appear in the build output.
Tip
If you're accustomed to running legacy analysis from the command line, either with FxCopCmd.exe or through msbuild with the RunCodeAnalysis flag, here's how to do that with code analyzers.
To see analyzer violations at the command line when you build your project using msbuild, run a command like this:
msbuild myproject.csproj /target:rebuild /verbosity:minimal
The following image shows the command-line build output from building a project that contains an analyzer rule violation:

Dependent projects
In a .NET Core project, if you add a reference to a project that has NuGet analyzers, those analyzers are also automatically added to the dependent project. To disable this behavior, for example, if the dependent project is a unit test project, mark the NuGet package as private in the .csproj or .vbproj file of the referenced project by setting the PrivateAssets attribute:
<PackageReference Include="Microsoft.CodeAnalysis.NetAnalyzers" Version="5.0.0" PrivateAssets="all" />