Set featured tables in Power BI Desktop to appear in Excel
In the Data Types Gallery in Excel, users can find data from featured tables in your Power BI semantic models. In this article, you learn how to set tables as featured in your semantic models. These tags make it easier for users to add enterprise data to their Excel sheets. Here are the basic steps for setting and sharing featured tables.
- Identify featured tables in your semantic models in Power BI Desktop (this article).
- Save those semantic models with featured tables to a shared workspace. Report creators can create reports with those featured tables.
- The rest of the organization can connect to those featured tables, referred to as data types in Excel, for relevant and refreshable data. The article Access Power BI featured tables in Excel describes how to consume these featured tables in Excel.
Select a table
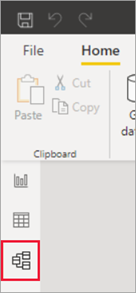
In Power BI Desktop, go to Model view.
Select a table, and set Is featured table to Yes.
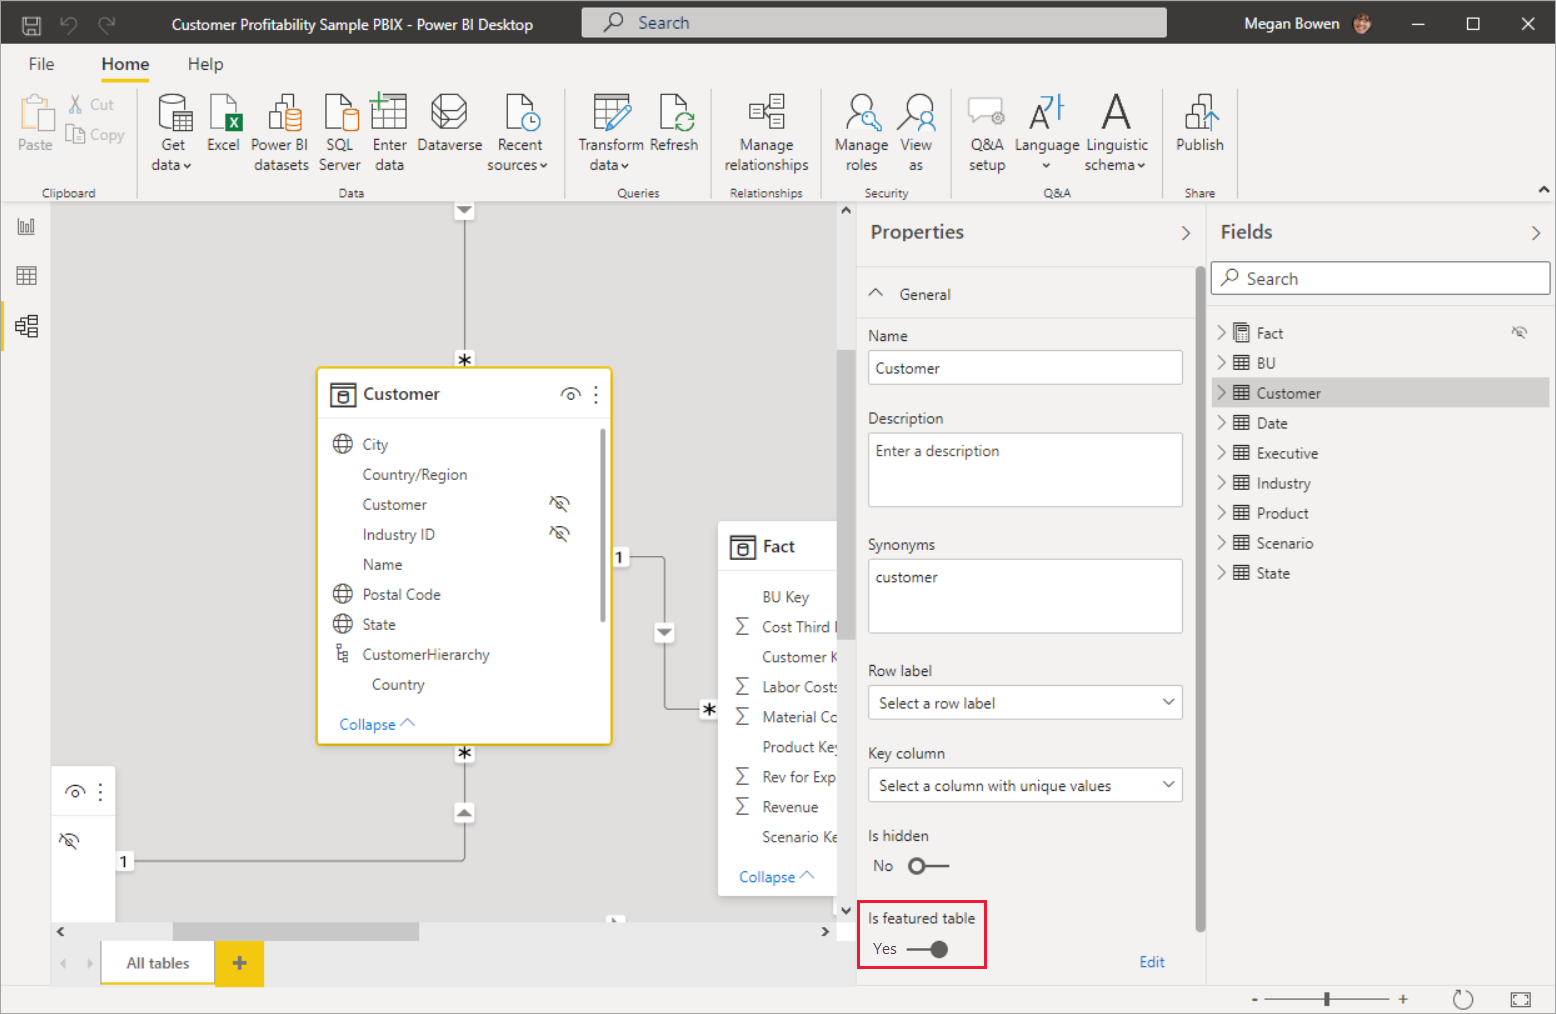
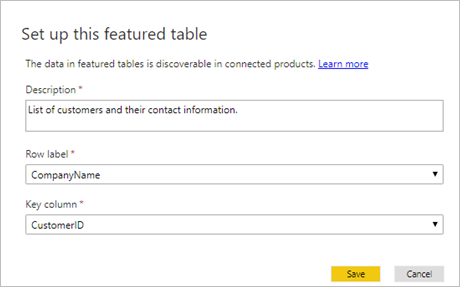
In the Set up this featured table dialog box, provide the required fields:
- A Description.
Tip
Start the description with "Featured table" to help Power BI report creators identify it.
- A Row label. The Row label field value is used in Excel so users can easily identify the row. It appears as the cell value for a linked cell, in the Data Selector pane, and in the Information card.
- A Key column. The Key column field value provides the unique ID for the row. This value enables Excel to link a cell to a specific row in the table.
- A Description.
After you publish or import the semantic model to the Power BI service, the featured table appears in the Excel Data Types Gallery. You and other report creators can also create reports built on this semantic model.
In Excel:
- Restart Excel. Excel caches the list of data types so you need to restart Excel to see newly published featured tables.
- Because some semantic models aren't supported, featured tables defined in those semantic models don't appear in Excel. See the next section, Considerations and limitations, for details.
The Data Types experience in Excel
The Data Types experience in Excel is similar to a lookup function. It takes a cell value provided by the Excel sheet, and searches for matching rows in Power BI featured tables. The search experience has the following behaviors:
Row matching is based on text columns in the featured table. It uses the same indexing as Power BI Q&A capability, which is optimized for the English-language search. Searching in other languages might not result in accurate matches.
Featured tables use Power BI Q&A indexing when users query data in those tables. For more information, see How does indexing work with Q&A.
Most numerical columns aren't considered for matching. If the Row label or Key column is numeric, they're included for matching.
Matching is based on Exact and Prefix matches for individual search terms. A cell’s value is split based on spaces or other whitespace characters like tabs. Then each word is considered a search term. A row’s text field values are compared to each search term for Exact and Prefix matches. A Prefix match is returned if the row’s text field starts with the search term. For example, if a cell contains “Orange County”, then “Orange” and “County” are distinct search terms.
- Rows with text columns whose values exactly match “Orange” or “County” are returned.
- Rows with text columns whose values start with “Orange” or “County” are returned.
- Importantly, rows that contain “Orange” or “County” but don’t start with them aren't returned.
Considerations and limitations
Considerations
- You can promote or certify semantic models in Power BI, which is called endorsement. Excel prioritizes tables in endorsed semantic models in the Data Types Gallery. Excel lists featured tables in certified semantic models first, then tables in promoted semantic models. Excel lists featured tables in unendorsed semantic models after that.
- Creating featured tables is available by default. You can change the Featured tables capability through File > Options and Settings > Options > Preview Features.
- You can use Excel files with a data model to publish featured tables. Load the data into Power BI Desktop and then publish the featured table.
Limitations
Here are the current limitations:
The integration is available in Excel in the current channel.
Featured tables in Power BI semantic models that use the following capabilities aren't shown in Excel:
- DirectQuery semantic models
- Semantic models with a live connection
Excel shows only data in columns, calculated columns, and measures defined in the featured table. The following aren't provided:
- Measures defined on related tables
- Implicit measures calculated from relationships
Power BI returns at most 100 row suggestions for each cell.
Some symbols aren't supported.
Setting or updating the featured table isn't supported in the XMLA endpoint.
Changing the Table name, Row Label, or Key Column in the featured table may impact Excel users with linked cells to rows in the table.
Excel shows when the data was retrieved from the Power BI semantic model. This time isn't necessarily the time that the data was refreshed in Power BI, or the time of the most recent data point in a semantic model. For example, say a semantic model in Power BI was refreshed a week ago, but the underlying source data was a week old when the refresh happened. The actual data would be two weeks old, but Excel would show data retrieved as the date/time at which the data was pulled into Excel.
See Considerations and limitations in the article "Access Power BI featured tables in Excel" for other Excel considerations.
Related content
- Access Power BI featured tables in Excel
- Read about using Excel data types from Power BI in the Excel documentation.
- Questions? Try the Power BI Community
Feedback
Coming soon: Throughout 2024 we will be phasing out GitHub Issues as the feedback mechanism for content and replacing it with a new feedback system. For more information see: https://aka.ms/ContentUserFeedback.
Submit and view feedback for