Create custom Power BI visuals without data binding
This article explains how to use the No data binding feature to create Power BI custom visuals without data roles. Ordinarily, when you create a visual in a Power BI report, the values are defined interactively by adding data fields to the Values well on the Visualizations pane.
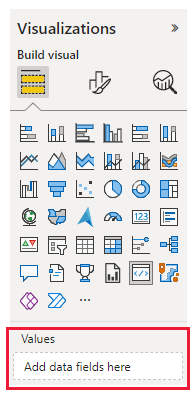
By default, if no values are defined, the format settings are disabled, and you can't update the visual's formatting.
The dataRoles property of the capabilities model allows you to format graphics in Power BI without binding data.
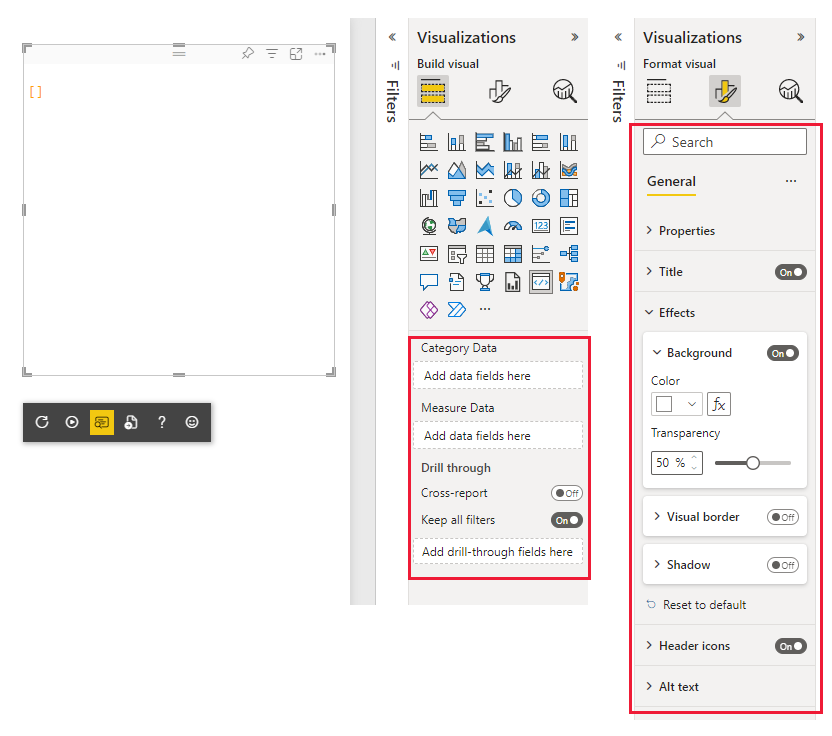
Using the dataRoles capabilities property, you can render a visual and use the update method to change the format settings. You can change settings even if the data buckets are empty, or if your visual doesn't use any data roles.
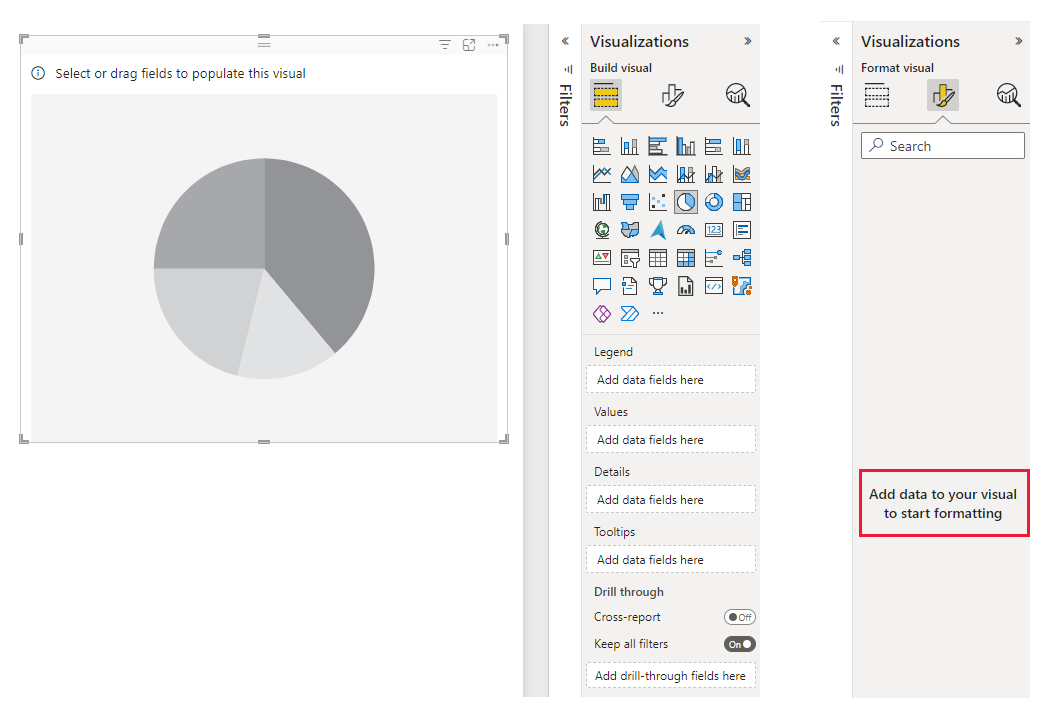
The following tabs show two examples of a Power BI visual. One visual requires binding data, and the other uses the no data roles feature and doesn't require binding data.
When binding data is required, the formatting settings are disabled if there are no data roles or the data wells are empty.
How to create a visual that doesn't require data binding
Note
This feature is available from API version 3.6.0 and above. To find out which version you’re using, check the apiVersion in the pbiviz.json file.
To enable the No data binding feature, set the following two parameters in the capabilities.json file to true.
supportsLandingPageallows you to display information on the Power BI card before it's loaded with data.supportsEmptyDataViewallows Power BI updates when the values field is empty.
    {
        "supportsLandingPage": true,
        "supportsEmptyDataView": true,
    }
Related content
Feedback
Coming soon: Throughout 2024 we will be phasing out GitHub Issues as the feedback mechanism for content and replacing it with a new feedback system. For more information see: https://aka.ms/ContentUserFeedback.
Submit and view feedback for