Configure automatic aggregations
Configuring automatic aggregations includes enabling training for a supported DirectQuery semantic model and configuring one or more scheduled refreshes. After several iterations of the training and refresh operations have run, you can return to semantic model settings to fine-tune the percentage of report queries that use the in-memory aggregations cache. Before completing these steps, be sure you fully understand the functionality and limitations described in Automatic aggregations.
Enable
You must have semantic model Owner permissions to enable automatic aggregations. Workspace admins can take over model owner permissions.
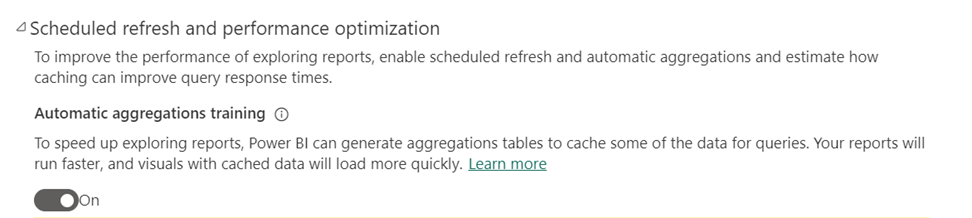
In semantic model Settings, expand Scheduled refresh and performance optimization.
Switch Automatic aggregations training to On. If the switch is greyed out, ensure Data source credentials are configured and you're signed in.
In Refresh schedule, specify a refresh frequency and time zone. If the Refresh schedule controls are disabled, verify the data source configuration including gateway connection (if necessary) and data source credentials.
Select Add another time, and then specify one or more refreshes.
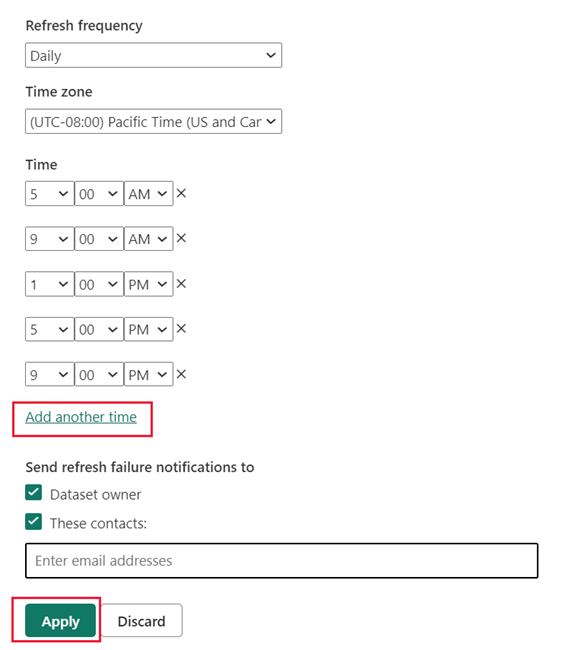
You must schedule at least one refresh. The first refresh for the frequency you select will include both a training operation and a refresh that loads new and updated aggregations into the in-memory cache. Schedule more refreshes to ensure report queries that hit the aggregations cache are getting results that are most in-sync with the backend data source. For more information, see Refresh operations.
Select Apply.
On-demand train and refresh
The first scheduled refresh operation for your chosen frequency includes a training operation. If that training operation doesn't complete within the 60-minute time limit, the subsequent refresh operation won't load or update aggregations in the cache. The next training operation won't run until the first refresh operation of your chosen frequency.
In such cases, you can manually run one or more on-demand training and refresh operations to fully complete the training and load or refresh aggregations in the cache. For example, when checking the Refresh history, if the first scheduled training and refresh operation for the day (frequency) doesn't complete within the time limit, and you don't want to wait for the next day's scheduled refresh that includes a training operation to run, you can run one or more on-demand train and refresh operations to fully process the data query log (train) and load aggregations to the cache (refresh).
To run an on-demand train and refresh operation, select Train and Refresh Now. Be sure to keep an eye on the refresh history to ensure the on-demand training operation completes successfully. If not, run another train and refresh operation until training completes successfully, and aggregations are loaded or refreshed in the cache.
Running Train and Refresh Now can be helpful for fine-tuning the percentage of report queries that will use aggregations from the in-memory cache. By running an on-demand train and refresh now operation, you can more quickly determine if your new percentage setting allows the training operation to complete within the time limit.
Keep in mind, training and refresh operations, whether scheduled or on-demand are process and resource intensive for both the data source and Power BI. Choose a time when resources are least impacted.
Fine-tuning
Both user-defined and system-generated aggregations tables are part of the model, contribute to the model size, and are subject to existing Power BI model size constraints. Aggregations processing also consumes resources and impacts model refresh durations. An optimal configuration strikes a balance between providing pre-aggregated results from the in-memory aggregations cache for the most frequently used report queries, while accepting slower results for outlier and ad-hoc queries in exchange for faster training and refresh times and a reduced burden on system resources.
Adjust the percentage
By default, the aggregations cache setting that determines the percentage of report queries that will use aggregations from the in-memory cache is 75%. Increasing the percentage means a greater number of report queries are ranked higher and therefore aggregations for them are included in the in-memory aggregations cache. While a higher percentage can mean more queries are answered from the in-memory cache, it can also mean longer training and refresh times. Adjusting to a lower percentage, on the other hand, can mean shorter training and refresh times, and less resource utilization, but report visualization performance could diminish because fewer report queries would be answered by the in-memory aggregations cache, as those report queries instead must then roundtrip to the data source.
Before the system can determine the optimal aggregations to include in the cache, it must first know the report query patterns being used most often. Be sure to allow several iterations of the training/refresh operations to complete before adjusting the percentage of queries that will use the aggregations cache. This gives the training algorithm time to analyze report queries over a broader time period and self-adjust accordingly. For example, if you've scheduled refreshes for daily frequency, you might want to wait a full week. User reporting patterns on some days of the week can be different than others.
To adjust the percentage
In semantic model Settings, expand Scheduled refresh and performance optimization.
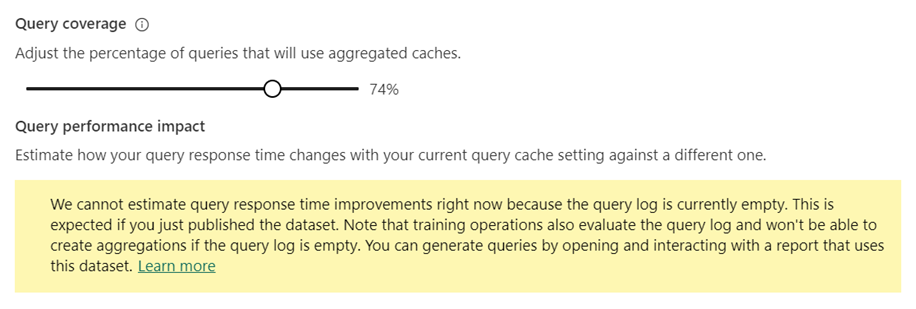
In Query coverage, use the Adjust the percentage of queries that will use the aggregated caches slider to increase or decrease the percentage to the desired value. As you adjust the percentage, the Query Performance Impact Lift chart provides estimated query response times.
Select Train and Refresh Now or Apply.
Estimate query performance impact
The Query performance impact lift chart provides estimated report query run times as a function of the percentage of queries that will use cached aggregations. The chart will initially show 0.0 for all metrics until at least one training/refresh operation is performed. After an initial training/refresh operation, the chart can help you determine if adjusting the percentage of queries that use the in-memory aggregations cache can potentially further improve query response.
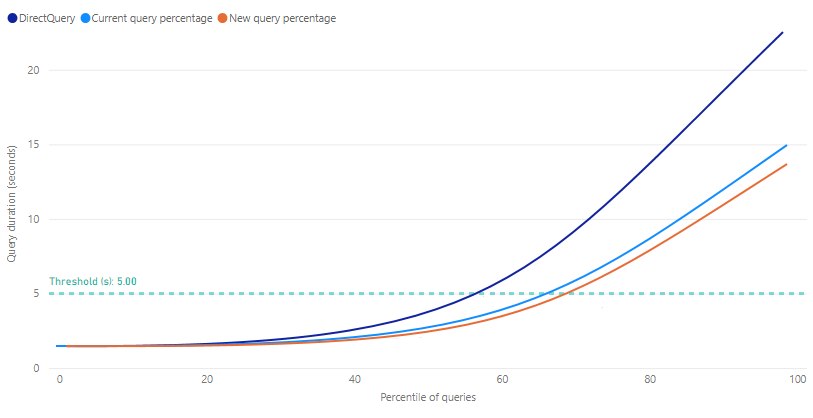
Threshold appears as a marker line on the lift chart and indicates the target query response time for your reports. You can then fine-tune the percentage of queries that will use the aggregations cache to determine a new query percentage that meets the desired threshold.
Metrics
DirectQuery - An estimated duration in seconds for a report query sent to and returned from the data source by using DirectQuery. Queries that can't be answered by the in-memory aggregations cache will typically be within this estimate.
Current query percentage - An estimated duration in seconds for report queries answered from the in-memory aggregations cache, based on the percentage setting for the most recent training/refresh operation.
New query percentage - An estimated duration in seconds for report queries answered from the in-memory aggregations cache for the newly selected percentage. As the percentage slider is changed, this metric reflects the potential change.
Disable
You must have model owner permissions to disable automatic aggregations. Workspace admins can take over model owner permissions.
To disable, switch Automatic aggregations training to Off.
When you disable training, you're prompted with an option to delete automatic aggregation tables.
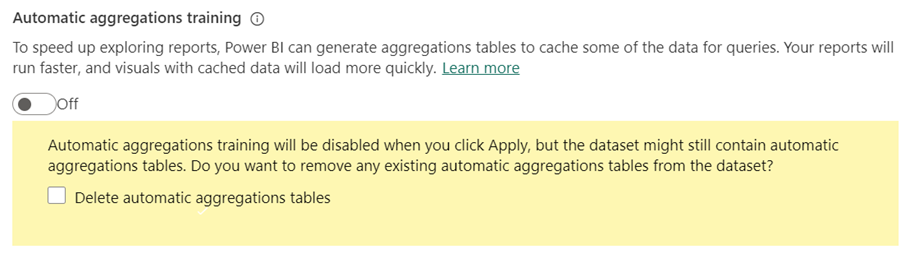
If you choose not to delete existing automatic aggregation tables, the tables will remain in the model and continue to be refreshed. However, because training is disabled, no new aggregations will be added to them. Power BI will continue to use the existing tables to get aggregated query results when possible.
If you choose to delete the tables, the model is reverted to its original state without any automatic aggregations.
Select Apply.
Related content
Feedback
Coming soon: Throughout 2024 we will be phasing out GitHub Issues as the feedback mechanism for content and replacing it with a new feedback system. For more information see: https://aka.ms/ContentUserFeedback.
Submit and view feedback for